OFS - Ares Capital Vs. OFS Capital: 2 Fat Yields The BDC Giant Vs. A Minnow
2023-11-10 16:04:45 ET
Summary
- Ares Capital currently offers a forward dividend yield that's roughly 343 basis points lower than OFS Capital.
- Whilst OFS is currently trading at a 20% discount to NAV per share versus an ARCC premium of 2.5%, OFS has seen this figure decline for six consecutive quarters.
- Total investments on non-accrual status for OFS at the end of its fiscal 2023 third quarter is 6.1x higher than ARCC.
Ares Capital ( ARCC ) at $11.11 billion is the largest business development company by market cap, OFS Capital ( OFS ) at $140.7 million is one of the smallest. If income is the prize, which is the better buy? New York-based ARCC last declared a quarterly cash dividend of $0.48 per share , unchanged from its prior distribution for what currently works out to be a 9.87% annualized forward dividend yield. The business development company is externally managed by a subsidiary of Ares Management Corporation ( ARES ), one of the largest alternative asset management firms with $395 billion in AUM. It has a storied history, going public in 2004 , it's become a bellwether for the blooming publicly traded private credit vehicles known as BDCs. OFS Capital ( OFS ) is comparatively a minnow, externally managed by Chicago-based OFS Capital Management with $4.3 billion in AUM, the BDC invests in senior secured floating rate loans to US middle market companies.
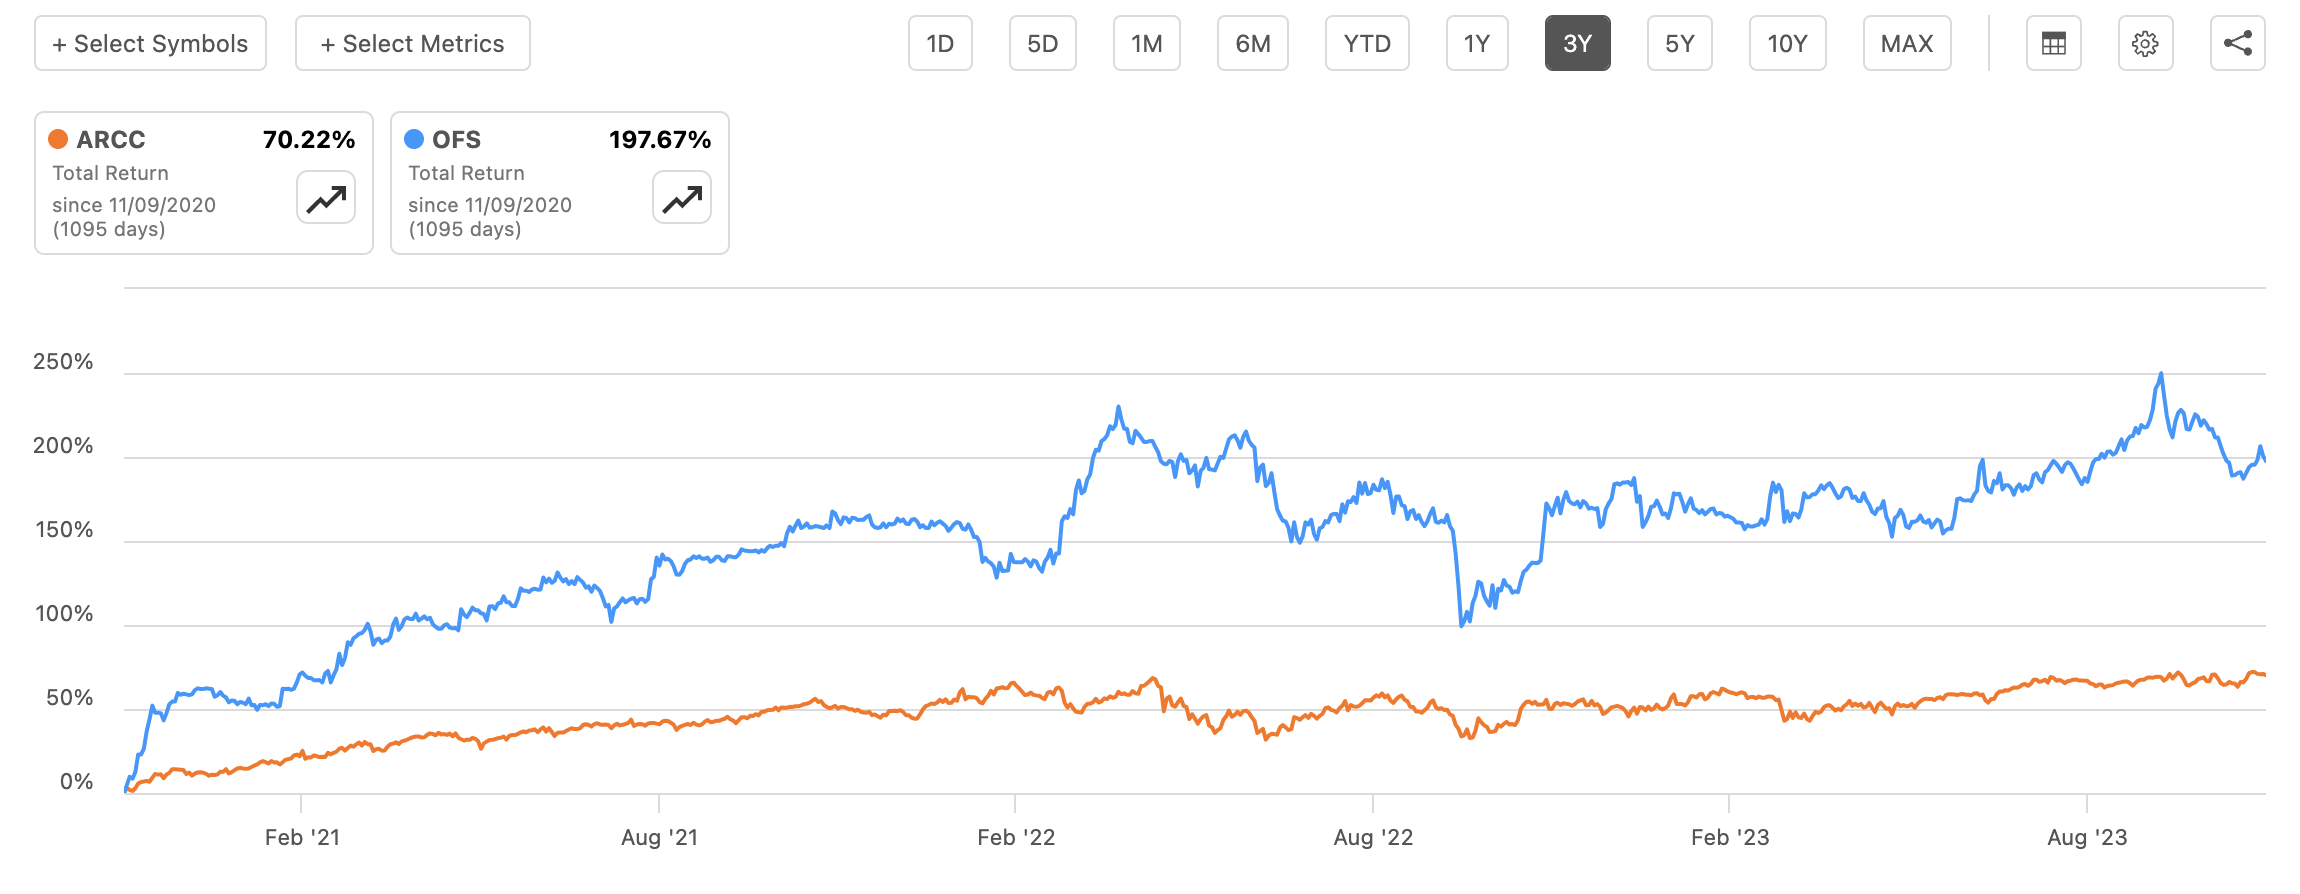
ARCC has outperformed OFS year-to-date on a total return basis but performance materially diverges when looked at over three years with OFS up 200% versus a return of 70% from ARCC. OFS last declared a quarterly cash dividend of $0.34 per share , unchanged from its prior distribution for what currently works out to be a 13.3% annualized forward dividend yield. It's important to note that OFS cut its dividend in half by 14 cents per share at the onset of the pandemic in 2020. This was a move that saw its common shares suffer a more material drop than ARCC with the distributions only recently recovering back to this level. Hence, whilst ARCC has a yield that's roughly 346 basis points lower than OFS, it has the edge for stability. Total returns over three years were impacted by the steeper OFS drop during the pandemic.
Growth, Investment Income, And Portfolio Diversification
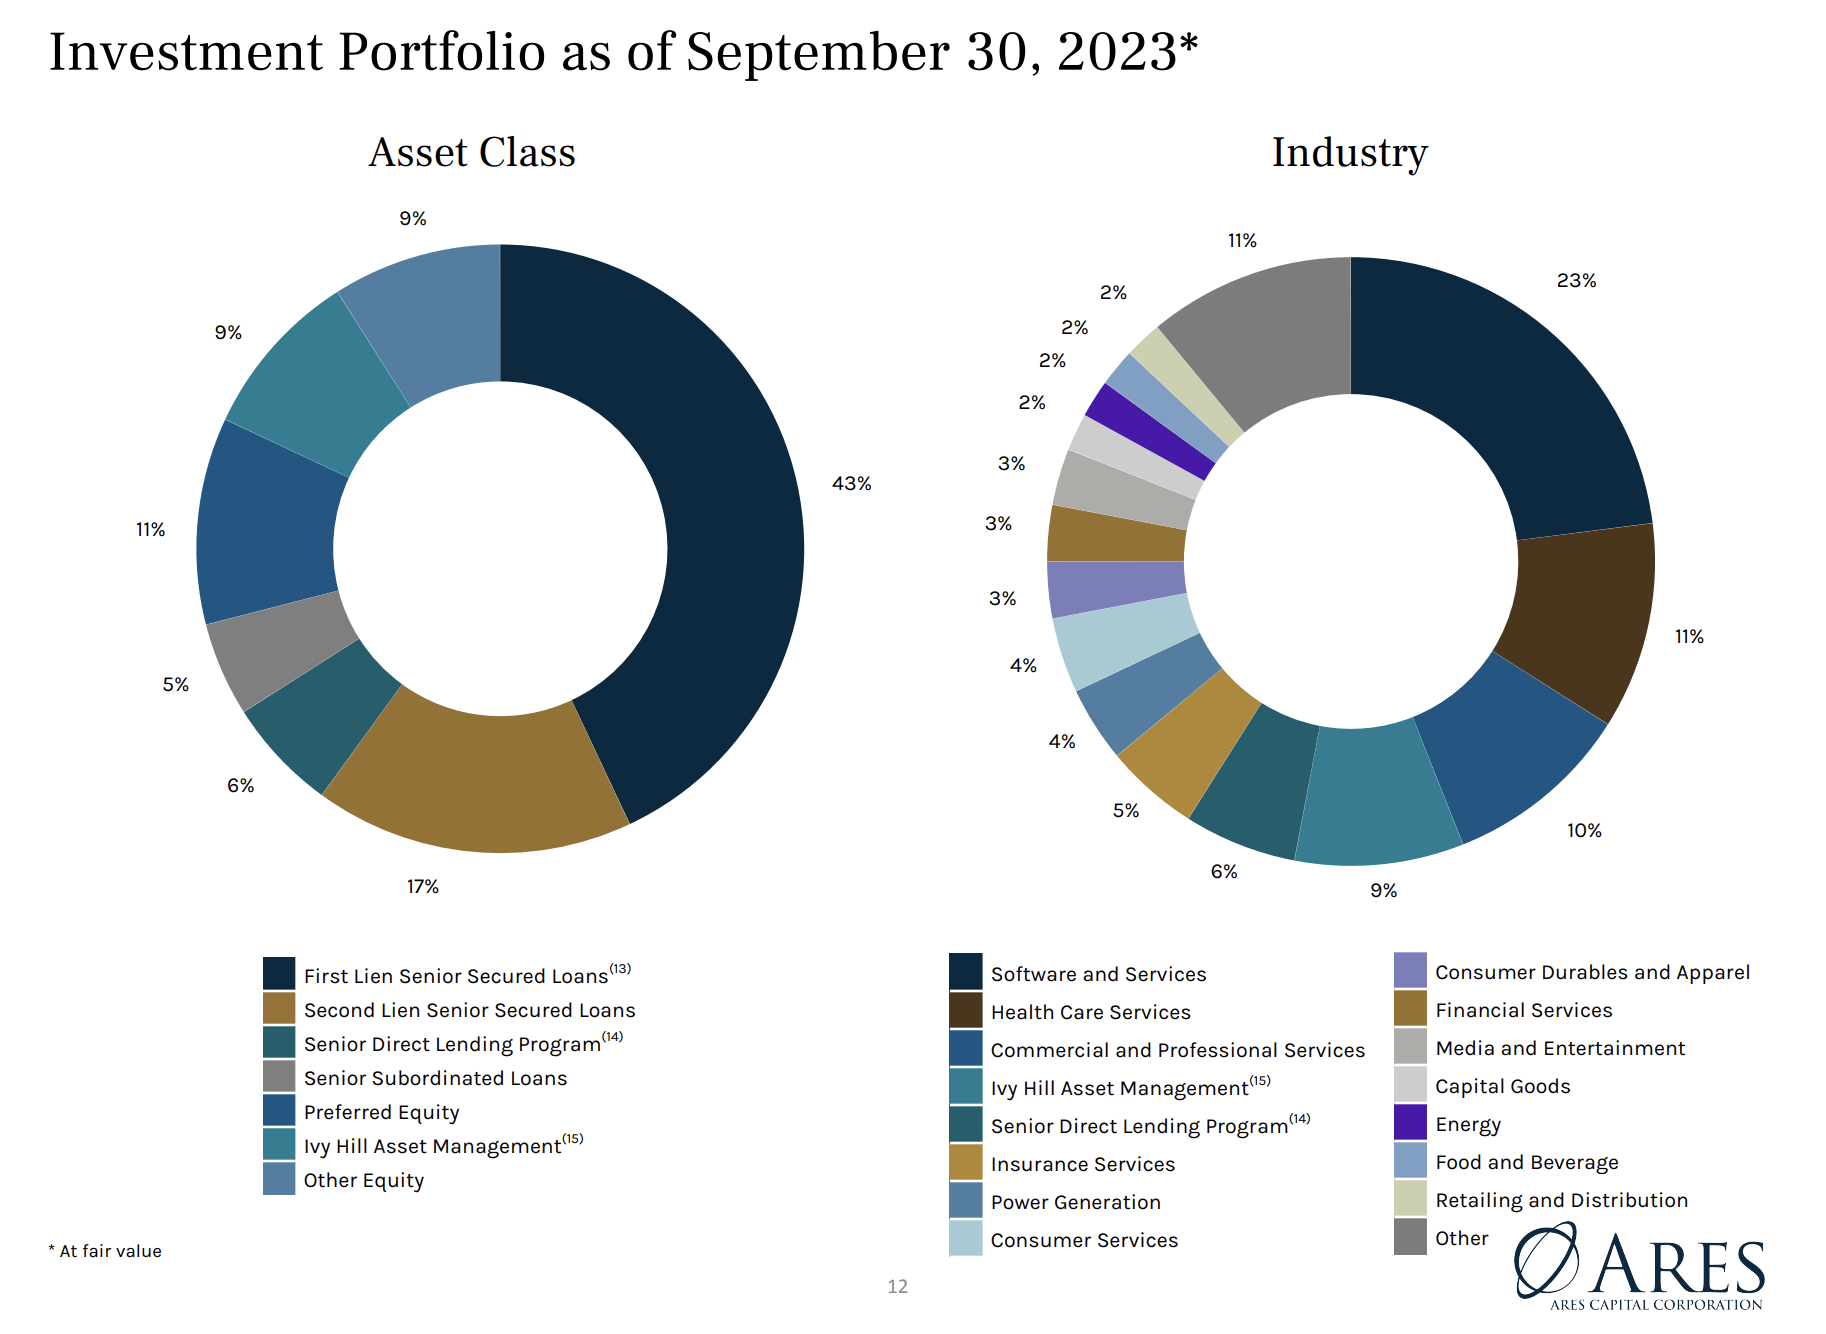
ARCC also invests in US-based middle market firms with loans ranging from $30 million to $500 million. The BDC reported fiscal 2023 third quarter total investment income of $655 million , up 22% over its year-ago comp but a miss by $4.14 million on consensus estimates. Growth was driven by the Fed raising rates to a 22-year high at 5.25% to 5.50% to boost a portfolio that was 69% invested in floating rate loans at the end of the third quarter. Around 43% of ARCC's portfolio are first lien senior secured loans with broad industry diversification, albeit with a focus on software and services which categorized 23% of tenants at the end of the third quarter.
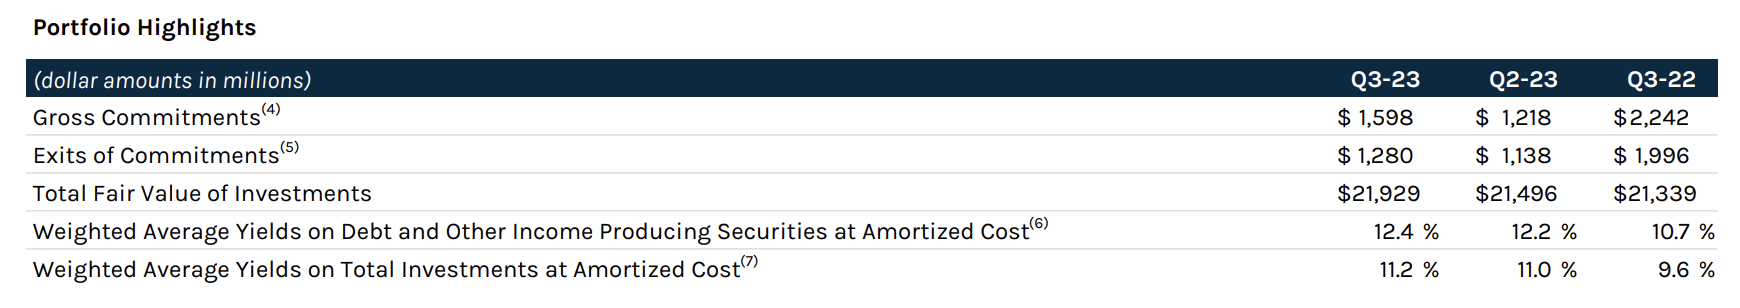
ARCC's portfolio investments at fair value stood at $21.9 billion , up from $21.5 billion in the prior second quarter, and were spread across 490 companies. The BDC's weighted average yields on total investments at amortized cost at 11.2% at the end of the third quarter advanced 160 basis points over its year-ago comp and came as the BDC saw gross commitments of $1.6 billion dip from $2.24 billion in the year-ago quarter. The lower investment activity likely underscores a level of defensive positioning ahead of expectations that the US economy might fall into a recession in calendar 2024.
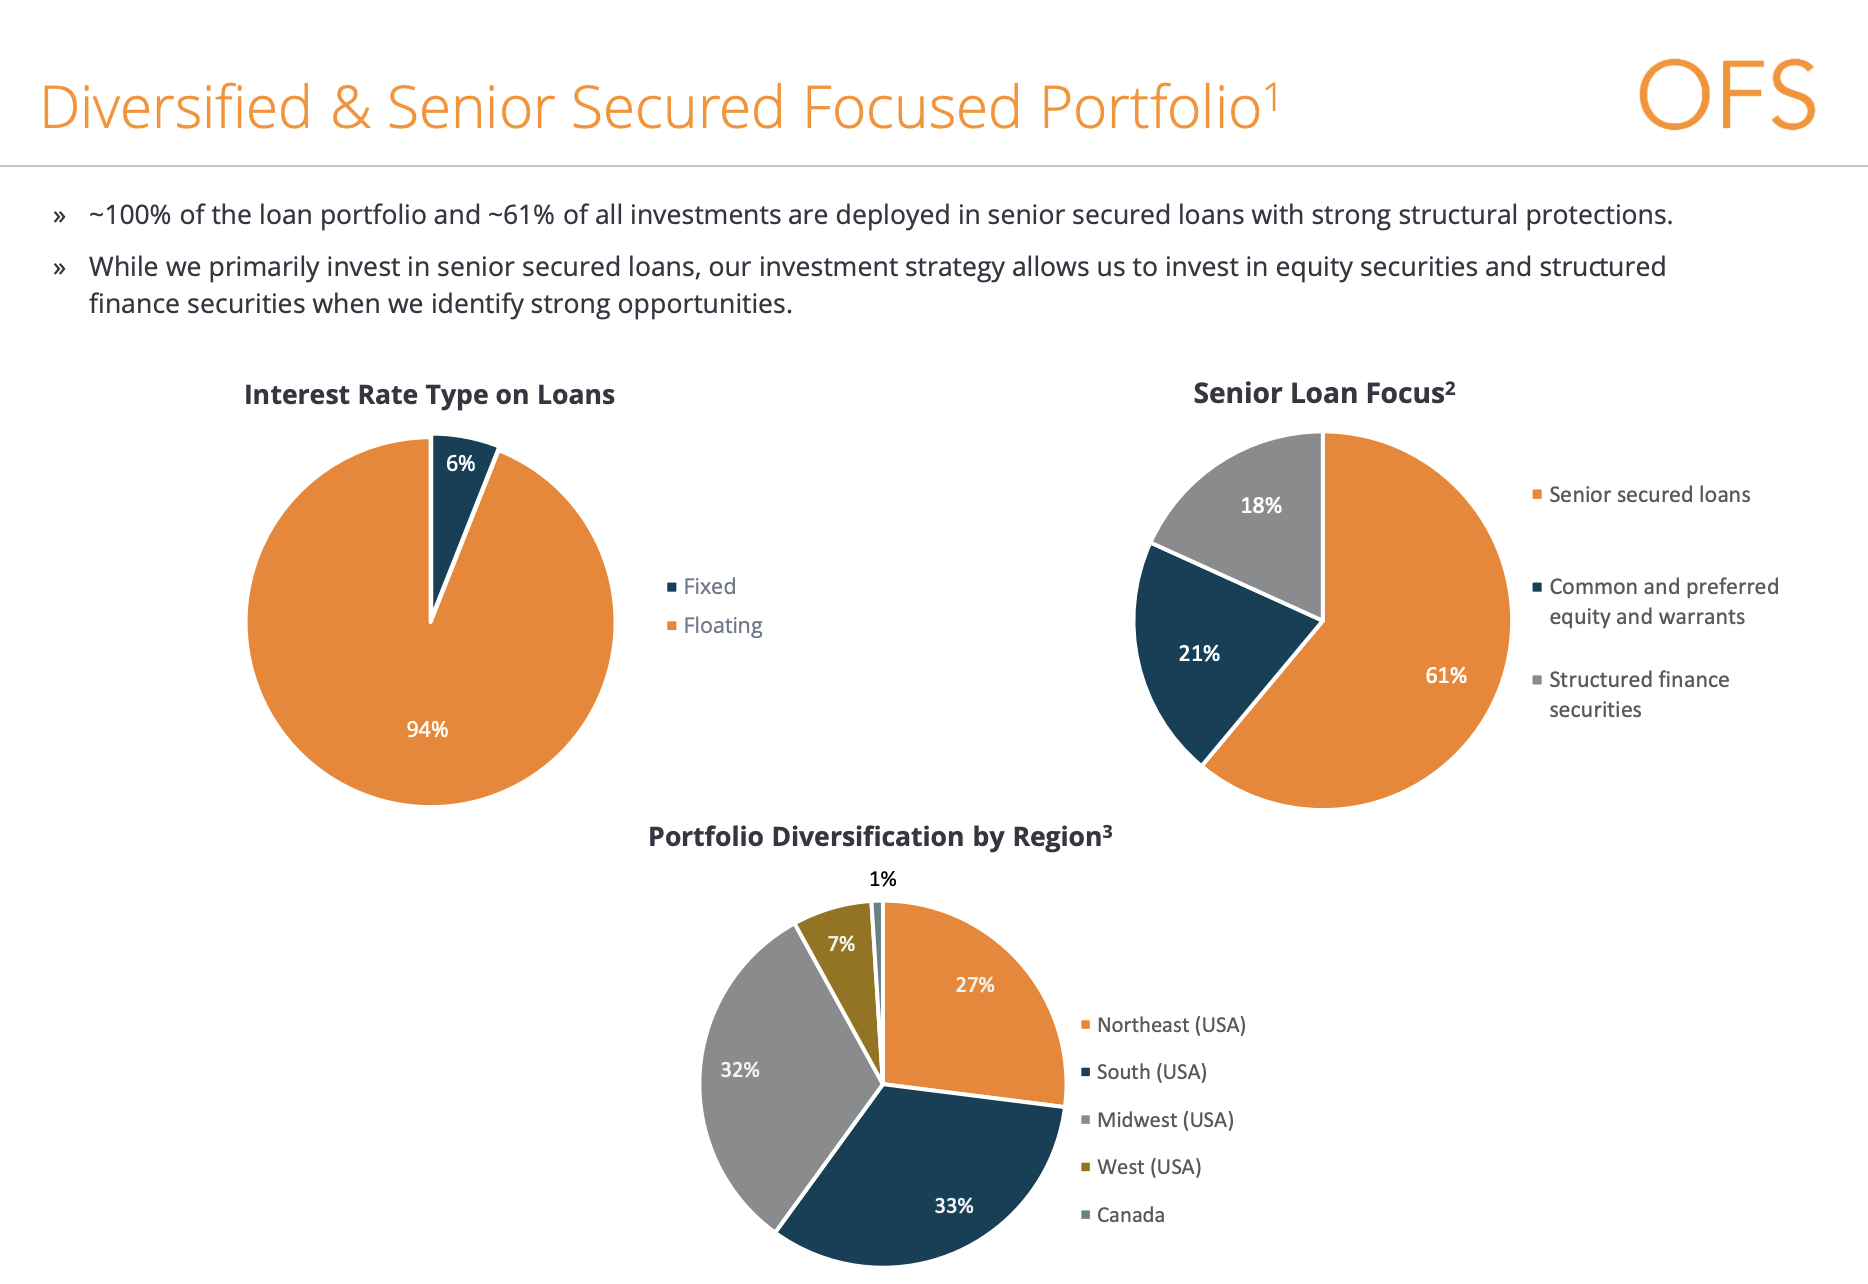
OFS saw its total investment income of $14.65 million , up a lower 9.6% over its year-ago comp and a small miss on analyst consensus by roughly $26K. OFS had a $457 million investment portfolio at fair value with debt investments of $279.2 million spread across 43 companies and 94% invested in floating rate loans. Around 61% of its broader total investment portfolio is in senior secured loans. These are not all first lien loans though with the second lien component at 20% . A higher first-lien loan exposure reduces the risk of losses as it provides the lender first claim on collateral. OFS also differs more markedly from ARCC from its 21% position in common and preferred securities, a positioning that comes with more risk albeit with the potential of higher upside.
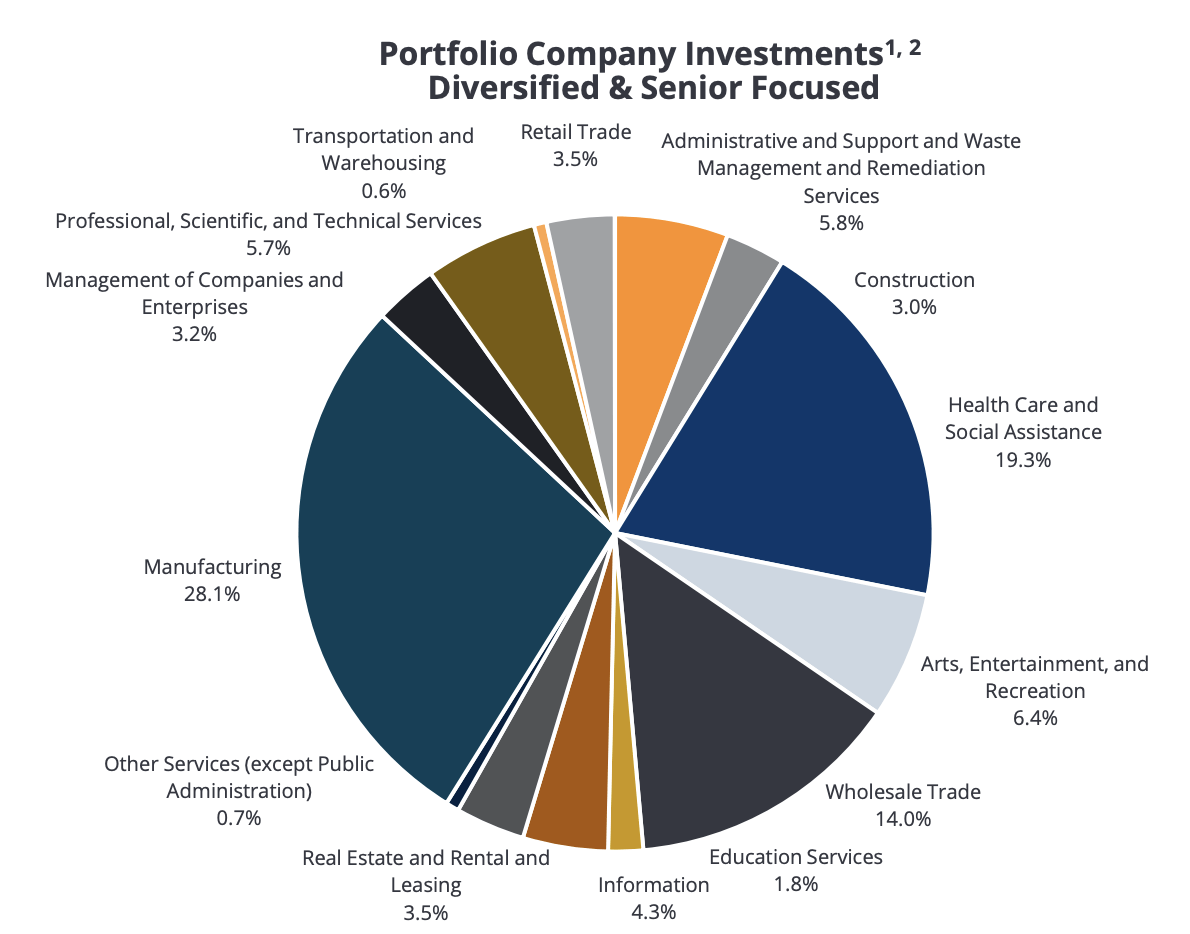
OFS is also heavier on lending to manufacturing companies which form 28.1% of its portfolio of company investments with healthcare and social assistance forming the second largest sector at 19.3%. The BDC recorded a net investment income of $5.39 million , around $0.40 per share, and up 7 cents from $0.33 per share in the year-ago quarter. This means the dividend is 117% covered by third-quarter NII, around an 85% payout ratio. The 21% growth in NII per share reflects an uplift from floating rate loans with OFS seeing an 80 basis point increase in its portfolio's weighted average realized yield on income-bearing investment to 13.3% from 12.5% in the second quarter. Total investments conducted during the third quarter at $8.3 million dipped by 49% over the second quarter with the BDC also moderating new investment activity.
Net Asset Value, Non Accruals, And The Economy
ARCC recorded third quarter NII of $289 million, around $0.52 per share, and down $0.05 per share from $0.57 in the year-ago quarter. Hence, the BDC is currently covering its dividend by 108%, a roughly 92% payout ratio. ARCC's net asset value at $ 18.99 per share, grew from $18.57 per share in the year-ago quarter and means the BDC is currently swapping hands for a 2.5% premium to NAV. OFS recorded a third-quarter NAV of $12.74 per share , a dip from $13.58 per share in the year-ago period. The BDC has recorded a decline in NAV on a per share basis for six consecutive quarters with NAV per share peaking at $15.53 per share as of the end of the first quarter of fiscal 2022. Over the last year, ARCC has been able to raise its net asset value by 13% versus a decline of 5.4% for OFS on a nominal basis.
Total investments at fair value on non-accrual status for OFS stood at 3.7% at the end of the third quarter, materially higher than ARCC whose figure of 0.6% dipped from 1.1% in the second quarter. For OFS, second quarter investments at fair value on non-accrual status was 2.1% , hence, the BDC is seeing a decline in NAV on both a nominal and per share basis as investments on non-accrual status rise. This instability means the BDC is currently trading at a large 20% discount to NAV. Does the minnow beat the giant? No. ARCC is the better pick as we enter a new year set to see continued macroeconomic uncertainty. BDCs currently face a Goldilocks economic scenario of high rates, resilient economic growth, and strong labor figures. A deterioration of this macro picture could cause non-accruals to spike and it is imperative to be defensive ahead of any such discombobulation. The giant in this case provides a defensive positioning.
For further details see:
Ares Capital Vs. OFS Capital: 2 Fat Yields, The BDC Giant Vs. A Minnow