ARKK - ARKK Vs. STMZF In The Age Of Money Printing
2023-07-10 15:46:21 ET
Summary
- ARKK and STMZF both seek to capitalize on the upcoming tech revolution, but STMZF has the better long strategy, while ARKK performs better during rapid central bank balance sheet expansion.
- There is a contrarian case to hold these funds long, even seemingly so close to the end of the business cycle, that has to do with debt/central bank maneuvers.
- Despite their recent beat downs, the funds are considered undervalued and have performed adequately to stupendously in the long run.
Thesis
Ark Innovation ETF ( ARKK ) and Scottish Mortgage Investment Trust ( STMZF ) are funds focused on capitalizing on the upcoming technological revolution, where multiple innovative technologies synergistically interact with one another to create rapid growth over the entire sector.
Though the Federal Reserve is in the midst of trying to cool the economy, multiple indicators are warning that such could be around the corner, and structural inflation is generally bearish for unprofitable tech, there is a contrarian case to currently hold these funds, and eventually add to them during the next downturn.
This contrarian case is based on the macro landscape with the following features:
- The U.S. and other developed countries are in so much debt, that central banks have no other choice but to monetize that debt in the long run to avoid secular contraction, or systemic risk.
- Global liquidity is on the rise.
- The market may have already priced in a recession last year, and is looking forward to the inevitable central bank balance sheet expansion that will occur at some point in the future, after the Fed breaks something significantly enough to pivot.
- The S&P 500 is not in an AI driven bubble currently, and is starting to show signs of being in a bull run.
- Crypto, working as an ultra forward looking indicator of global liquidity, is providing a bull case for other liquidity sensitive assets like ARKK and STMFZ.
- In the end, crypto and technology are the only assets to outperform central bank balance sheet expansion, and subsequent currency debasement, in the long run in my view.
ARKK and STMFZ have been beaten down mightily from their all-time highs and are currently under their fair values. Even so, ARKK has performed adequately in the long run, and STMFZ has performed more than so, in the era of money printing. Further, during periods of rapid central bank balance sheet expansion these funds readily beat the market, allowing long holders to trim positions and rebalance to other areas of their portfolios.
ARKK is likely more undervalued than STMFZ, but the latter seems to have the better strategy and execution, as evidenced by its higher long term price appreciation; though this could simply be a feature of it being a much older, more established fund, with more holdings that have matured to their individual investment theses. Further ARKK has historically been more efficient in capturing upside during the Fed’s balance sheet expansion during the Covid-19 pandemic response.
General Case for Fast Growing Tech
The case for holding funds owning baskets of potentially high growth equities, whose companies are at the forefront of up-and-coming technology, not only has to do with the explosive, exponential rate of technological advancement that will likely define the last half of the decade, but has a lot to do with the macro picture in the era of money printing, and subsequent currency debasement.
I’ve heard the cynical argument, multiple times over the years, in the Seeking Alpha comments sections, from gold bugs, and on housing bubble themed websites, that the Federal Reserve’s money printing is causing currency debasement and making all assets more and more expensive. But I didn’t put much thought behind it, until I heard the case being made in a much more eloquent fashion by macro economist Raoul Pal on his YouTube channel, Real Vision Finance. I’ll lay out this case below:
Since the Global Financial Crisis, the Fed and other central banks, seemingly realizing that GDP growth is not enough to service both public and private debt, have been “printing” the difference, i.e. monetizing the debt, to avoid secular contraction in the private sector.
For example, the debt to GDP for the US private sector is currently at around 150% :
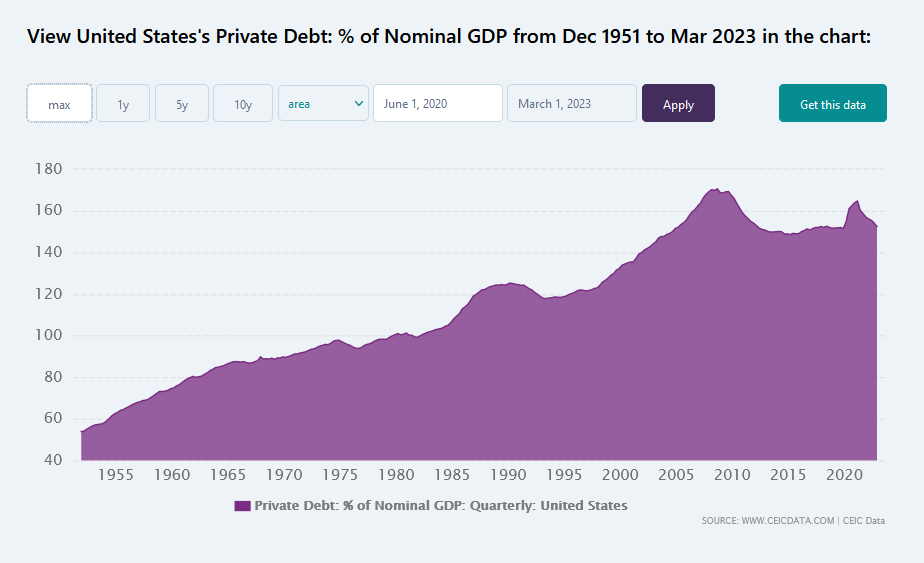
US Private Debt (ceicdata.com)
While the US public debt to GDP doesn’t fare much better, at 118%:
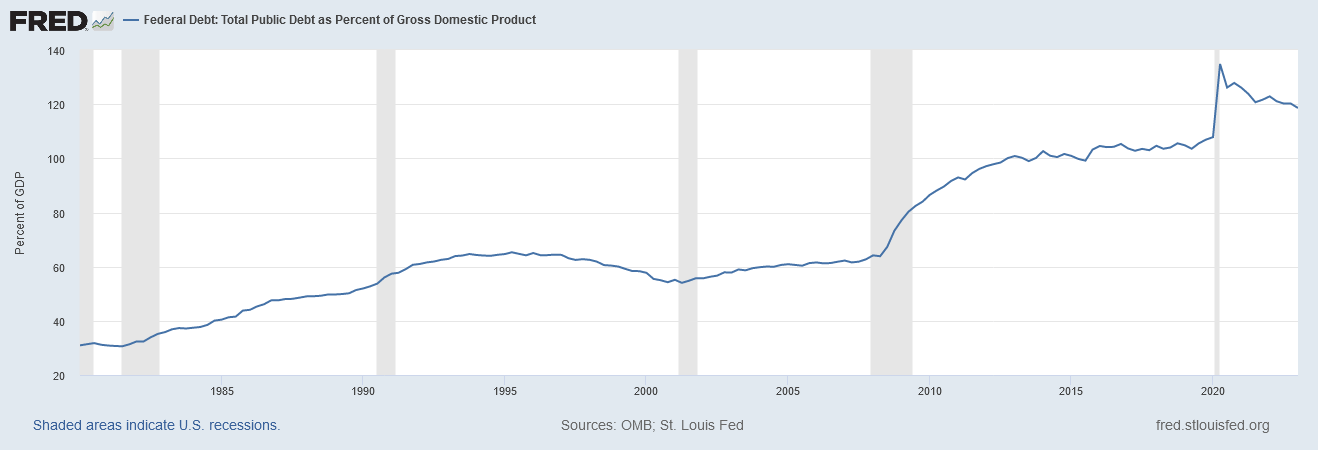
US Public Debt (St. Louis Fed)
And US GDP growth since the GFC has been on average, sub 2%:
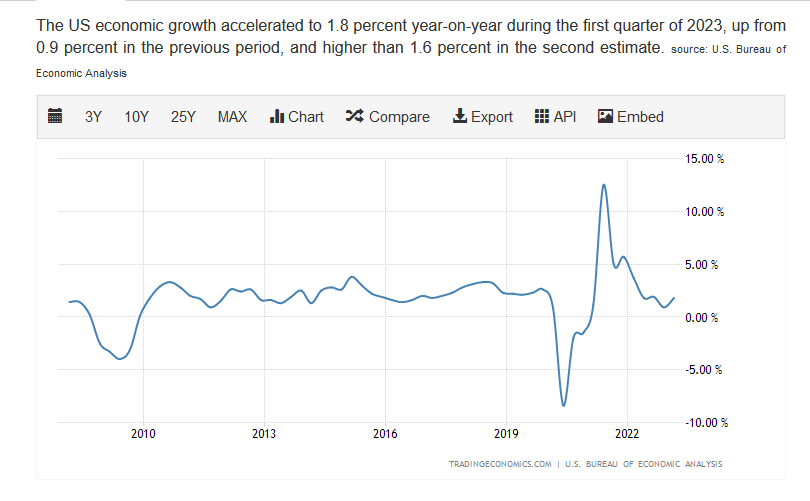
US GDP Growth Since 2008 (TradingEconomics.com)
Though recently trending higher, as a thought experiment, let’s say the average US interest rate on all of its public and private debt is 2%. Further for this thought experiment, let’s just say the public sector is 100% of GDP in debt, and the private sector is also 100% of GDP in debt, even though in reality we are worse off than such. If US GDP grows at 2% on average, then all of that growth has to go into servicing debt.
The problem is that if it fully satisfies, say the public debt (again at a 2% interest rate), then the private debt is left out in the cold, with zero servicing. GDP growth would have to be 4% to be able to service both the public and private debt. Because of this discrepancy, the Fed then just prints this shortfall, to keep the private sector from imploding, and it goes onto its balance sheet.
The end result of this obligatory printing is currency debasement, and asset price inflation, as a function of such.
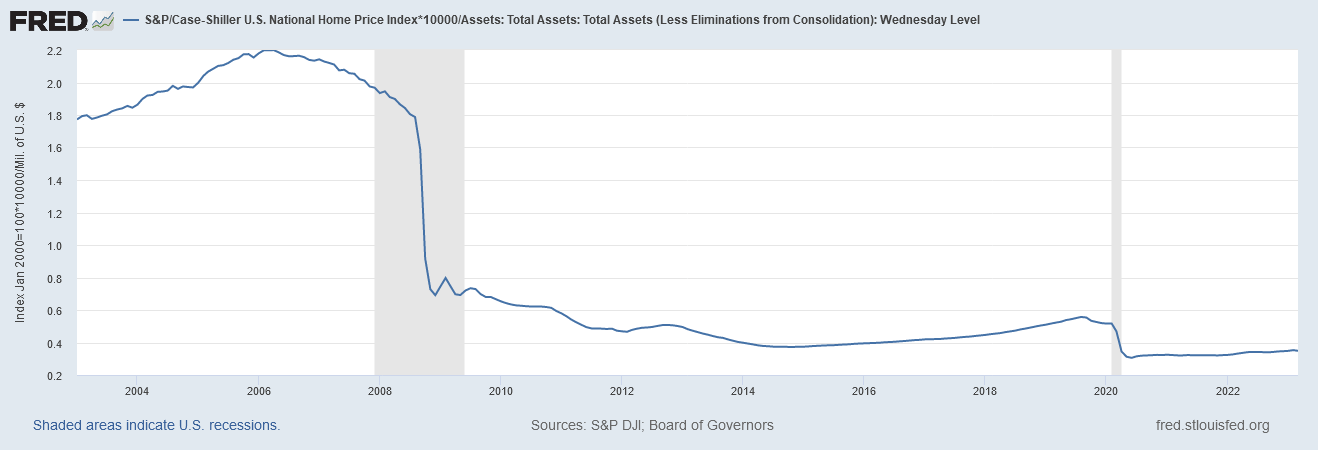
When accounting for this debasement, assets seemingly have gone nowhere since the GFC. Evidence for this can be seen by dividing the S&P 500 price time series by that of the Fed balance sheet, and doing the same with existing housing, via the Case Shiller index:
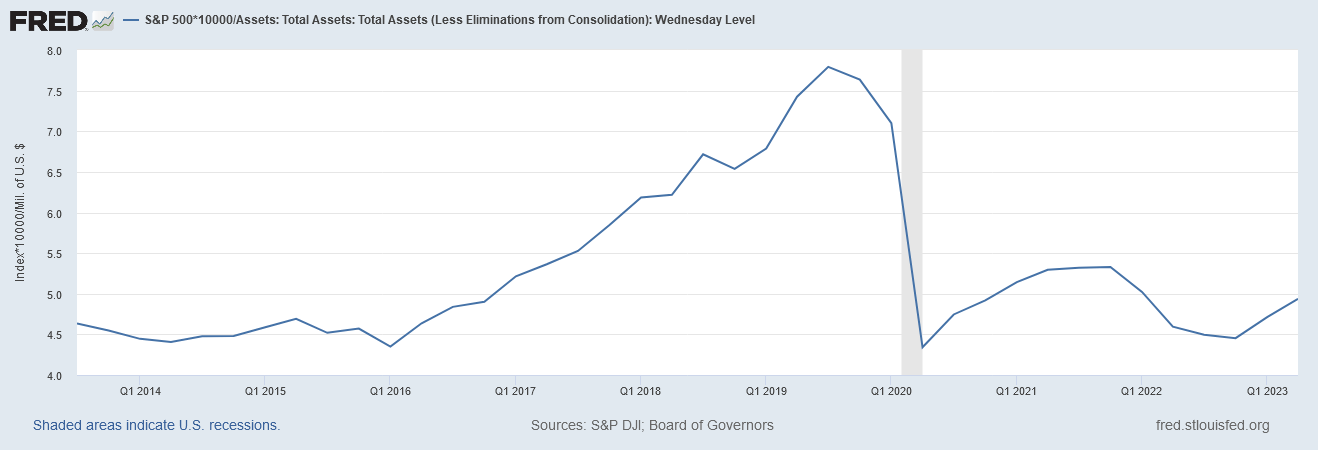
S&P 500 divided by Fed balance sheet, 2014 to present (St. Louis Fed)
Case Shiller Index divided by Fed balance sheet, 2004 to present (St. Louis Fed)
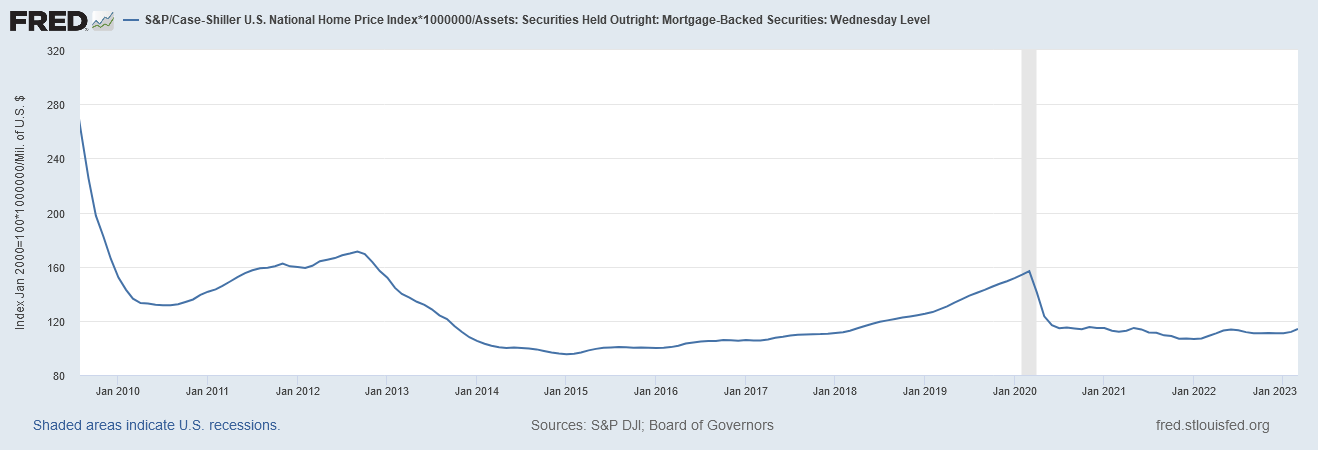
Case Shiller Index divided by Fed held mortgage backed securities, 2010 to present (St. Louis Fed)
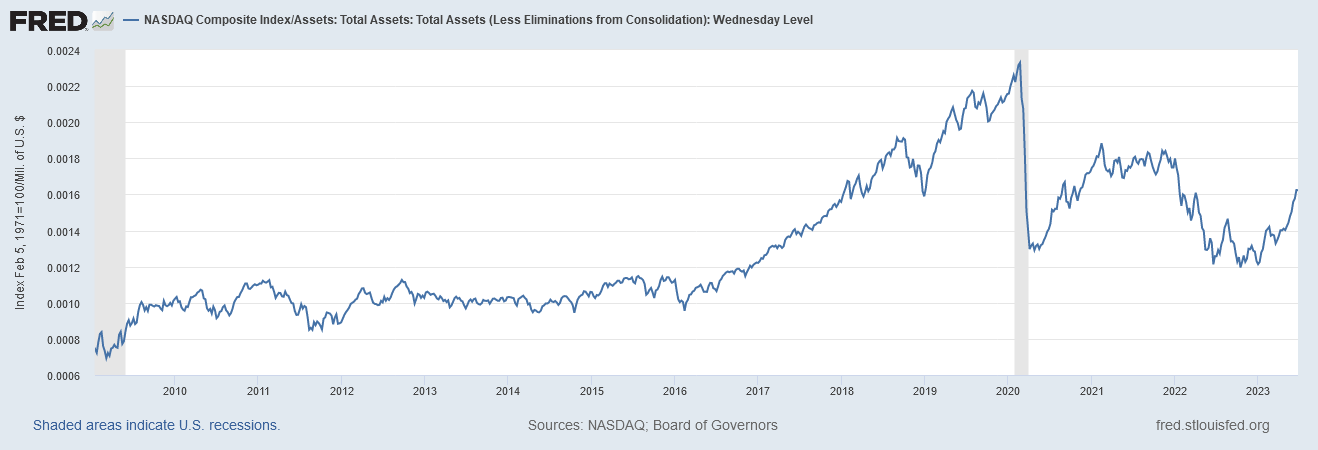
Indeed the only assets able to outperform this currency debasement were naturally the fastest growing, technology related assets, as we can see by dividing the NASDAQ against the Fed Balance sheet:
NASDAQ divided by Fed balance sheet (St. Louis Fed)
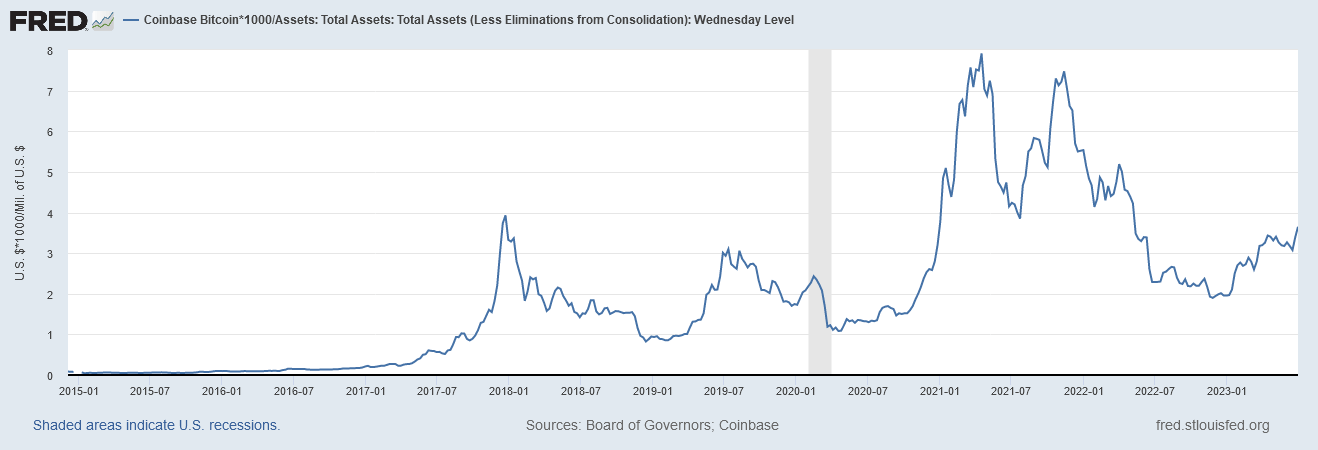
And by dividing Bitcoin ( BTC-USD ) by the Fed balance sheet:
Bitcoin divided by Fed balance sheet (St. Louis Fed)
Investors looking for long term alpha should consider looking at fast growing, tech related assets that can outperform the inevitable Fed balance sheet (and global liquidity) expansion.
Indeed all the interest expense obligations from the recent US pandemic and upcoming infrastructure related spending, along with the long term trend of tax cuts for the wealthy, make it likely that the Fed balance sheet will be significantly higher than it is now, in the not so far off future. And don’t be surprised if a bunch of commercial real estate loans get transferred from regional banks onto the Fed balance sheet as well, as that slow moving train wreck plays out.
Currently, little by little, public and private debt is being rolled over into higher interest rates, which will eventually precipitate our long anticipated recession. At that point, to prevent long term secular contraction, secondary to the massive debt levels out there, the Fed will be back to rate cuts and balance sheet expansion in my opinion.
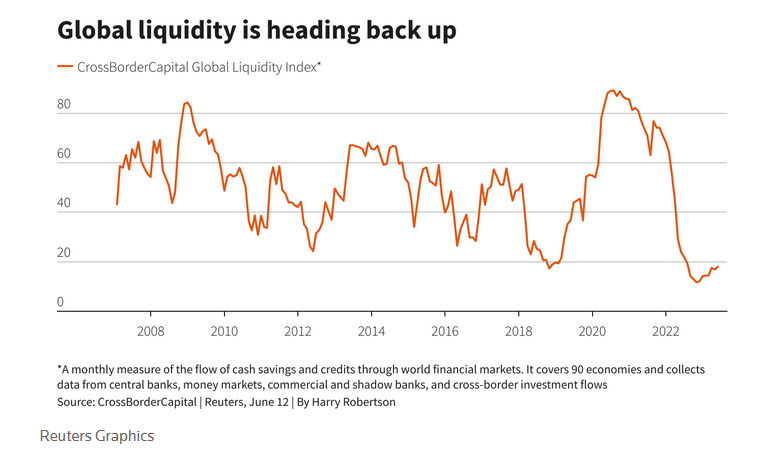
Further, according to CrossBorder Capital, global liquidity is once again on the rise. From Reuters, Tranquility reigns over markets still awash with cash, for now:
Total global liquidity, a measure of cash and credit in the world economy, has risen to almost $170 trillion in June, Crossborder calculates, from $158 trillion in October.
Global liquidity index, CrossBorder Capital (Reuters, Tranquility reigns over markets still awash with cash, for now)
And of course, all of such will be bullish for high growth tech and crypto.
But is there a case for long holders of the ARKK and SMTZF funds to be holding right now, seemingly so late in the business cycle?
As long as you are properly managing risk, by keeping these funds at a small percentage of your portfolio, like I do, and as long as you have a long investment time horizon, I will lay out the case that they are holds. Indeed I likely will be adding to both, if/when downside volatility comes back into play.
The Case for ARK/STMZF at This Point
With the yield curve long inverted , Econ PI mean of coordinates telling us the recession is on the doorstep, the NY Fed telling us the chance of recession is 70% , inflation still over target, the Fed determined to precipitate a recession via demand destruction to regain credibility and price stability, US liquidity possibly getting sucked into the Treasury after it stops feasting on money markets, the Fed’s Bank Term Funding Program continuing to tick up week after week, commercial real estate leases coming to their ends, blue chip economists saying ‘iceberg straight ahead’, the market locally overbought and in need of a correction, and there being 22% short interest in ARKK, what is the contrarian case to hold these funds long, through this potential storm?
Here are some reasons I plan on holding my ARKK position.
Market priced in a recession that was supposed to happen by now
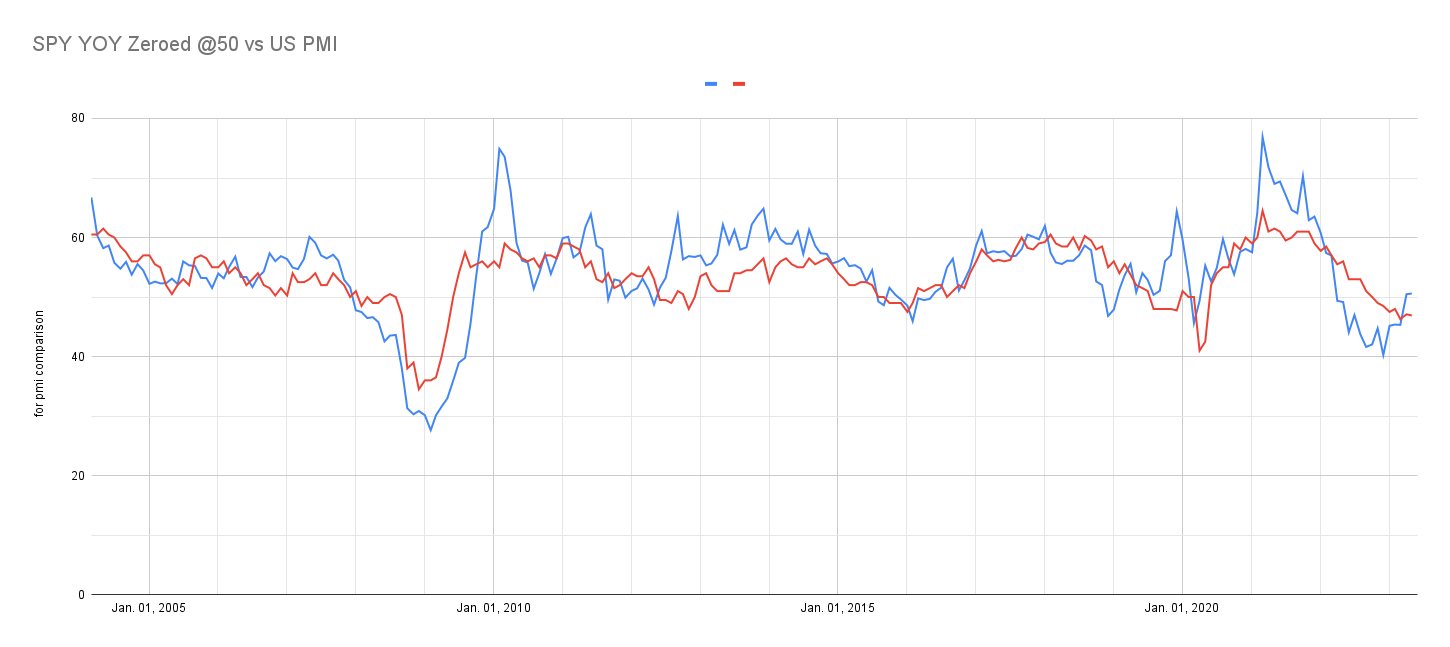
On October 12, 2022, the SPY hit a low of $356, representing an approximate 25% drawdown from the all-time high, and pricing in a PMI of 41, based on its year over year growth at that point, zeroed to a neutral index of 50. (S&P 500 YOY growth zeroed at 50, correlates with monthly US PMI prints, in the long term, regardless of how big or small manufacturing is or has been in the US, in terms of GDP growth contribution).
Blue line = SPDR S&P 500 ETF Trust YOY growth; where 50 = 0 growth; Red line = US PMI (TradingEconomics, SeekingAlpha, charting and calculations by Andrew Feazelle)
Though stocks usually don’t bottom until a recession starts, we did have a technical recession when looking at the two negative prints for Q1, and Q2, of 2022. More to the point, when the SPY priced in the PMI of 41, there is a chance that it had already fully priced in a recession, and was now looking forward several months to the point where something eventually breaks, and the Fed pivot begins, as it’s been conditioned to do.
Examining the last several modern era recessions, PMI bottomed approximately at or above the 41 level five out of the last nine times. Such lending evidence to the notion that the October bottom was all we’re going to get from our present situation. Or at least you could say it’s a 50/50 call, which then reemphasizes a “hold” positioning for our funds in question.
Incidentally it’s worth mentioning that the NASDAQ had priced in a 37 PMI, since we’re focusing on tech related funds in this article.
Further, because everyone and their uncle knows at some point the Fed will have to print, having just seen it just recently do so during the 2018 Taper Tantrum and the pandemic, it may be a bit harder now to get the S&P to price in a 30 or 35 PMI.
Currently the US PMI is coming off a March 2023 low of 46.3, and is currently at 46.9, having never made it down to 41.
| Historical US Recession Bottom Dates |
| US Manufacturing PMI's at Bottoms |
| Apple |
| 150 |
| 189 |
| 1.26 |
| 7.61 |
| Microsoft ( MSFT ) |
| 325 |
| 335 |
| 1.03 |
| 6.80 |
| Amazon |
| 137 |
| 129 |
| 0.94 |
| 3.15 |
| Nvidia |
| 300 |
| 411 |
| 1.37 |
| 2.83 |
| Google A |
| 154 |
| 120 |
| 0.78 |
| 1.92 |
| Tesla ( TSLA ) |
| 215 |
| 256 |
| 1.19 |
| 1.84 |
| Meta Platforms |
| 278 |
| 285 |
| 1.03 |
| 1.74 |
| Google C ( GOOG ) |
| 154 |
| 121 |
| 0.79 |
| 1.66 |
| Berkshire B ( BRK.B ) |
| 370 |
| 334 |
| 0.90 |
| 1.64 |
| United Healthcare ( UNH ) |
| 462 |
| 474 |
| 1.03 |
| 1.23 |
| Weighted Average, based on fund weight |
| 1.08 |
| Data From SlickCharts.com & Morningstar |
Market is not in a bubble
According to Yardeni, the forward P/E for the S&P 500 is 18.8 , as of 6/28/2023. And while that feels moderately overvalued compared to the FactSet 25 year average of 16.5 - this particular average respecting both the era of money printing, and that before, with more normal Fed Funds Rate numbers and legit recessions - it also feels more fairly valued with respect to the 5 and 10 year averages - those purely of the era of money printing, which as explained above is not over.
Further, part of the story of this elevated PE is from the rise of the mega cap tech stocks in the 2010’s, as evidenced by looking at the 10 year median PE of the SPDR S&P 500 ETF Trust ( SPY ), with its overweight mega tech component, compared to that of the Invesco S&P 500 Equal Weight ETF ( RSP ), 20.6 , and 19.1 respectively. These mega techs tend to naturally have higher PE’s, and because they are overweight in the index, they can pull up its PE.
| FactSet Forward PE Average (Duration) |
| FactSet Forward PE Average |
| Current Market Overvaluation % |
| 25 year |
| 16.5 |
| 14 |
| 20 year |
| 15.5 |
| 21 |
| 15 year |
| 15.5 |
| 21 |
| 10 year |
| 16.9 |
| 11 |
| 5 year |
| 18.6 |
| 1 |
| Average of all periods |
| 16.6 |
| 13.6 |
| Average with valuation factoring in 16% earnings recession for last half of 2023 |
| 16.6 |
| 35 |
| Average with valuation based on S&P 2024 earnings |
| 16.6 |
| 10 |
| Current Forward PE (6/28/23) |
| 18.8 |
| SPY 10 year median |
| 20.6 |
| RSP 10 year median |
| 19.1 |
| Data: Yardeni, FactSet, Gurufocus, Morgan Stanley |
Even with a 16% earnings decline, which is the average recessionary decline for the last 70 years, and what Morgan Stanley is projecting for the last half of 2023 , the market is not in a bubble in my view.
There is a significant probability we may be in a new bull market
Working in the framework that last year’s drawdown was a bear market pricing in a recession, and perhaps the money printing on the other side of such, we can run a multi-point test to tell us whether or not we are likely in a new bull market - the type that normally finds its start inside of a recession.
Multi-point test for the start of a new bull market out of a recession:
| Recessionary Bear Market Rallies on S&P |
| Gain % |
| Days |
| Points |
| 90% of common stocks above their 20 day moving average on NYSE |
| No, stocks have not reached 90% since before the bear market started ; the closest they’ve come is 88% intraday, on Jan16th, 2023 |
| 0 |
| 90% of common stocks above their 20 day moving average on NASDAQ |
| Yes, on March 27, 2023, NASDAQ 100 had 99% of stocks above the 20 day MA . |
| 1 |
| NYSE stocks advancing outnumber those declining at a 2:1 ratio for 10 days or more |
| Yes, the Zweig Breadth Thrust indicator was triggered in April of 2023 . This has happened 14 times since 1950, and in every case, the market has been higher 1 year later. |
| 1 |
| Data from barchart.com, info from Business Insider |
| Relief Rally Threshold |
| Does the current rally meet the threshold? |
| Points |
| Average relief rallies in recessionary bear markets 1968-2008 = 2.5 |
| No, only 2 relief rallies have occurred, not including the current rally |
| 0 |
| Average relief rallies in recessionary bear markets from 1929 to now = 4 |
| No, only 2 relief rallies have occurred, not including the current rally |
| 0 |
| Data from personal observation, and Dividend Sensei on Seeking Alpha |
The point system provides a 5 out of 8, or higher likelihood than not, that the 2022 bear was pricing in a recession and we are currently in a new bull market, coming out of it. This is the same point system that correctly told us, back in August 2022, that we were simply in a relief rally inside a bear market.
At the very least, we could say last year was an inflation driven non-recessionary bear market and we’ve started a new bull. Such implying, at least for now, we’ve aborted the final recessionary bear plunge, typically driven by an earnings recession.
It’s worth reemphasizing the historical importance of the Zweig Breadth Thrust Indicator in this point system. Let’s hear from Carson Group chief market strategist Ryan Detrick, on the April 2023 positive print of this technical indicator :
"It has only happened 14 other times since 1950, and the S&P 500 was higher a year later every single time," Detrick said, adding that both the average and the median forward one-year return was 23%. Meanwhile, the six-month forward average return after the Zweig Thrust Indicator triggered is 17%.
[During] only two instances since 2000 has the Zweig Thrust Indicator flashed and the S&P 500 went on to fall to a new low: in late 2015 and early 2004. However, while the S&P 500 did move lower in the short term, the index still moved significantly higher one year after the signal was triggered.
Pretty strong words, if the Fed weren’t actively trying to cool things down.
Long term returns of ARKK are adequate, while short term returns inside periods of Fed balance sheet expansion are dramatic
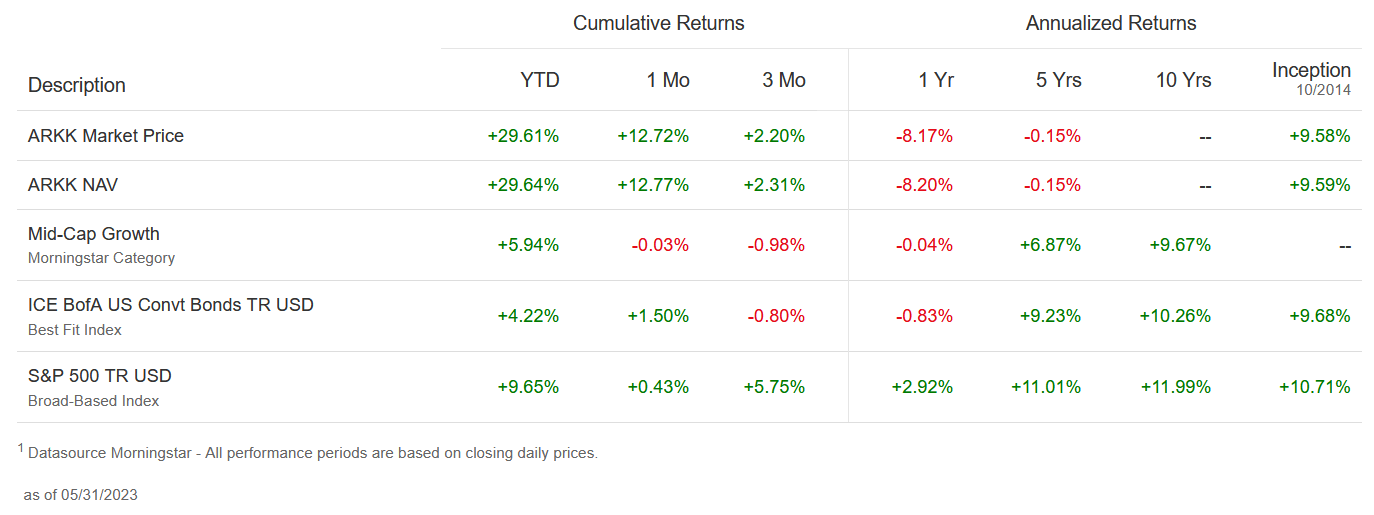
While ARKK’s long term return, since its October 2014 inception, is 9.58%, compared to the 10 year total return of the S&P of 11.99%...
ARKK long term return (Charles Schwab)
... its reactivity to the Fed balance sheet expansion is dramatic. Below are two examples.
The first is from August 2019 when the Fed balance sheet hit a local low, to several months later in February of 2020, when it hit a local high (right before going to the moon in response to the Covid lockdowns). The balance sheet grew at 11% but ARKK grew at 35%, or 3x the balance sheet.
| Aug, 28, 2019 |
| February 12, 2020 |
| Growth |
| Fed Balance Sheet |
| $3.76T |
| $4.18T |
| 11.2% |
| ARKK |
| $43.38 |
| $58.33 |
| 34.5% |
| Data: St. Louis Fed, Seeking Alpha |
From the start of the printing, in response to Covid, to the point in which inflation started to tick up anomalously (Feb 26, 2020 to March 17, 2021 based on weekly St. Louis Fed data), ARKK grew 1.6 times faster than the Fed balance sheet, despite going through the Covid panic correction, and a correction from getting spooked at that start of deleterious inflation a year later.
| February 26, 2020 |
| March 17, 2021 |
| Growth |
| Fed Balance Sheet |
| $4.16T |
| $7.69T |
| 84.9% |
| ARKK |
| $53.54 |
| $127.46 |
| 138.1% |
| Data: St. Louis Fed, Seeking Alpha |
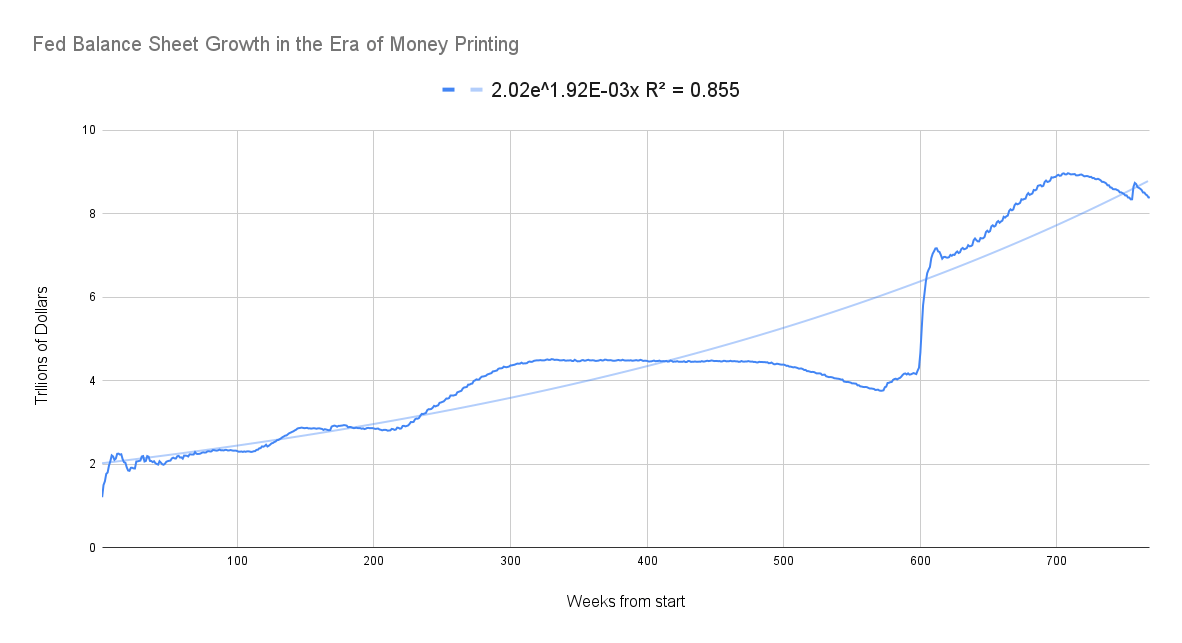
Considering the long term trend for the Fed’s balance sheet is 10.5% CAGR…
Fed Balance Sheet Growth 2008 to present (St. Louis Fed, author's trendline)
… this implies that ARKK’s price targets inside the next dramatic balance sheet expansion event, could be $52 to $59, $60 to $74.7, and $142 to $227 depending on if the balance sheet prices in 1, 2, or 3 years' worth of its growth, respectively, in a short period of time. The lower targets on these number sets are likely more realistic as they respect the last wave of high acceleration printing, during the pandemic, and shadow a similar style of acute printing in response to the 2008 financial collapse.
Long term returns for STMZF are stupendous, while short term returns inside Fed balance sheet expansion are adequate
At the start of July of 2013 Scottish Mortgage Investment Trust, PLC - SMT on the London Stock Exchange - was at £178, while it now stands at £668 or a CAGR of 14.1% beating the S&P return, even without factoring in the fund’s small dividend.
Running it through the same Fed balance sheet test as I did ARKK above, its growth multiple over the pandemic balance sheet expansion, up to the point inflation started to trend above average, and liquidity sensitive assets corrected, is 1.03.
Hence, if during the next recession everybody forgets the question, but they know the answer is more printing, STMZF’s targets are $9.67, $10.69, and $11.81 respectively, depending on if the Fed balance sheet expands to include 1, 2, or 3 years' worth of its trend.
Basically holding these funds long gives adequate, to very nice, long term appreciation, based on their history. You’re getting paid to wait for their holdings to start generating large cash flow growth in the coming years.
But adding to these during a downturn can eventually provide superior upside, during the obligatory and subsequent central bank balance sheet expansion, giving you the opportunity to take profits and rebalance.
| February 26, 2020 |
| March 17, 2021 |
| Growth |
| Fed Balance Sheet |
| $4.16T |
| $7.69T |
| 84.9% |
| ARKK |
| $53.54 |
| $127.46 |
| 138.1% |
| STMZF |
| $8.41 |
| $15.75 |
| 87.3% |
| S&P 500 Index |
| 3116 |
| 3974 |
| 27.5% |
| Data: St. Louis Fed, Seeking Alpha |
The Great Recession: Up and coming tech bottomed 3 & 1/2 months before the market, then everything went to the moon
This is just a reminder of the basic tenet of holding long: You don’t know when the market will bottom, nor do you know when your individual holding will bottom, with respect to recessionary bears.
Discounting the pandemic, the last legit recession was the 2007-09 Great Recession. Inside such, the market bottomed on March 9, 2009. It then ripped 6% higher the very next trading day, traded flat for a day, then ripped up another 4%. On March 17th it went up another 3%, and on the 18th, another 2%. After a few down days, on the 23rd, it ripped 7% upward, in just that one day. One month after the bottom, the market had shot up 27%; and six months after it had shot up 53%.
| Low |
| March 9, 2009 (market low) |
| April 9, 2009 (1 month after) |
| Sept 9, 2009 (6 months after) |
| S&P 500 |
| March 9, 2009; 676 |
| 676 |
| 856 (27%) |
| 1033 (53%) |
| AMZN |
| November 20, 2008; $1.75 |
| $3.02 (+72%) |
| $3.99 (128%) |
| $4.11 (134%) |
| GOOGL |
| November 24, 2008; $6.44 |
| $7.28 (13%) |
| $9.32 (22%) |
| $11.61 (80%) |
| Data: Seeking Alpha |
Up and coming tech at the time - Amazon ( AMZN ) and Alphabet ( GOOGL ) - actually bottomed several months before the market and were already up off of such by 72% and 13%,at the time the market hit its March 2009 low.
It is best not to try to time the market, but instead just hold long, and add to your positions when the bears, or valuations give you that opportunity.
ARKK versus STMZF
While I don’t recommend buying at this point, due to all of the headwinds previously mentioned, the market may eventually give us a chance to start building a position in the future, or adding to a held position. So which one of these funds looks best to put up to 0.5% of your portfolio into?
Most of us know about ARKK, but have not heard of STMZF, so let’s take a look:
Scottish Mortgage Investment Trust
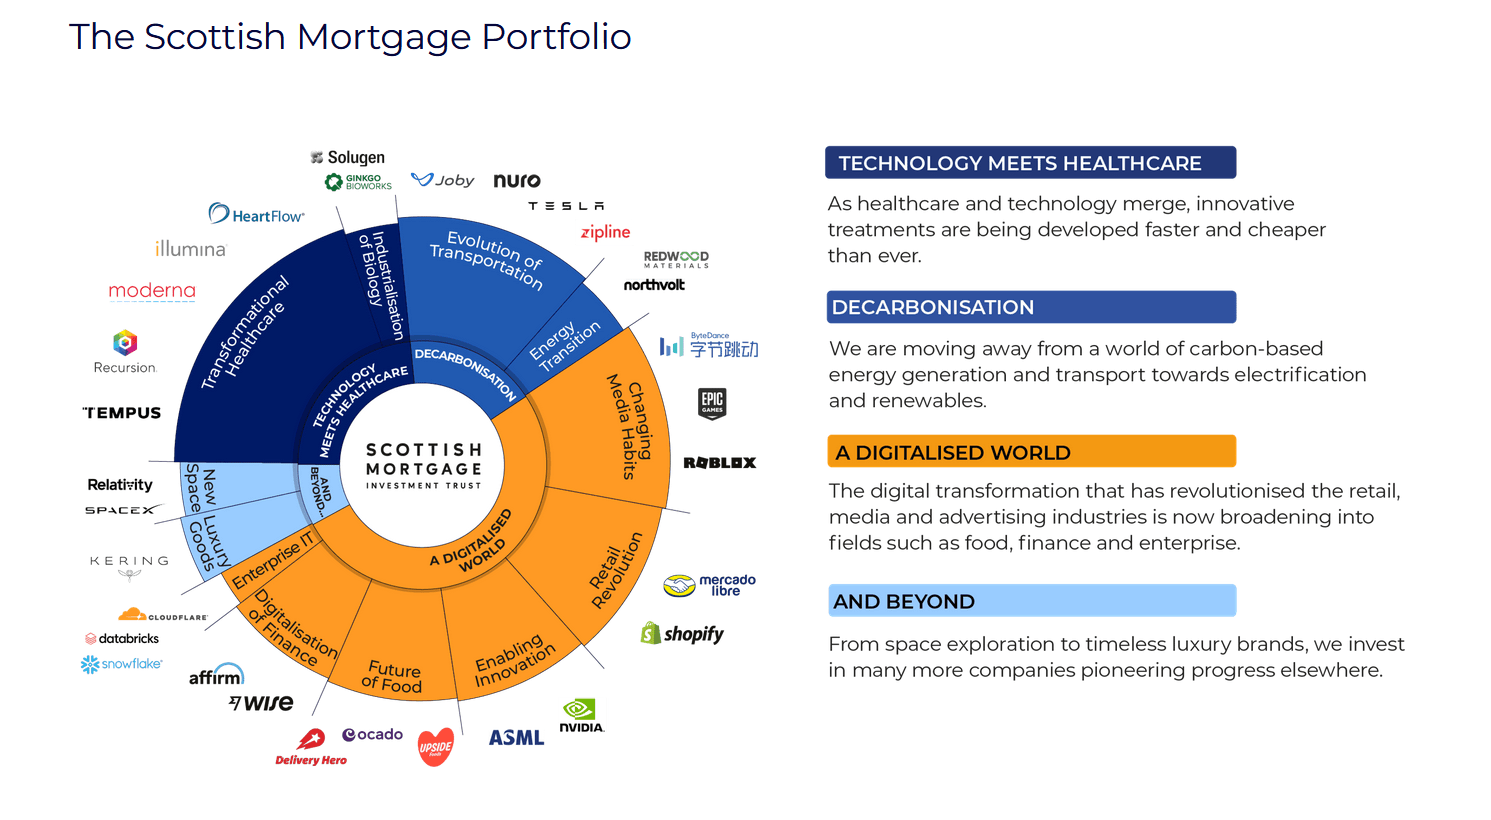
Scottish Mortgage Investment Trust (STMZF) is a legacy fund that’s been around since 1909, whose goal is to invest in high growth companies at the forefront of technological progress, and hold them long. I get the feeling the fund isn’t worried about minimizing tracking error by their statements in their annual report :
... if you are able to withstand the behavioral and institutional pressures that come with operating over far longer time horizons then you can dramatically reduce the number of people you are competing with. This in turn makes the possibility of edge and genuine difference to the market far greater.
We make our investment decisions by considering a company’s prospects over a decade and certainly no less than five years. We believe this is radically different to the average market participant. In doing so it aligns us with the fundamental progress of companies rather than the fashions of markets. After all, it takes many years for large market opportunities to be seized, for formidable competitive advantage to be recognised and for the vision of founders to come to fruition.
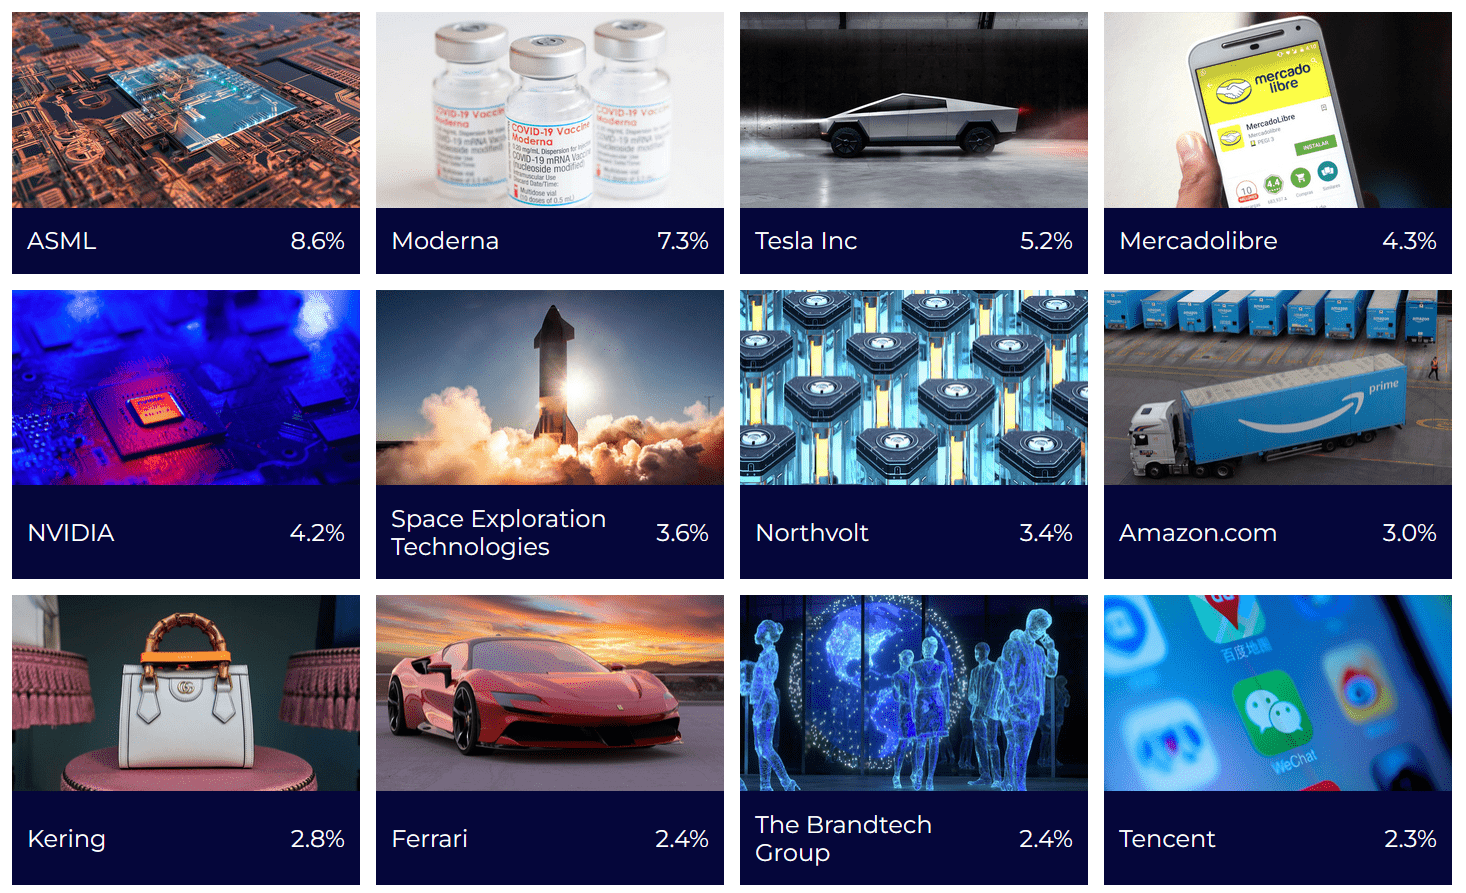
STMZF's Investment Themes (Scottish Mortgage Investment Trust website)
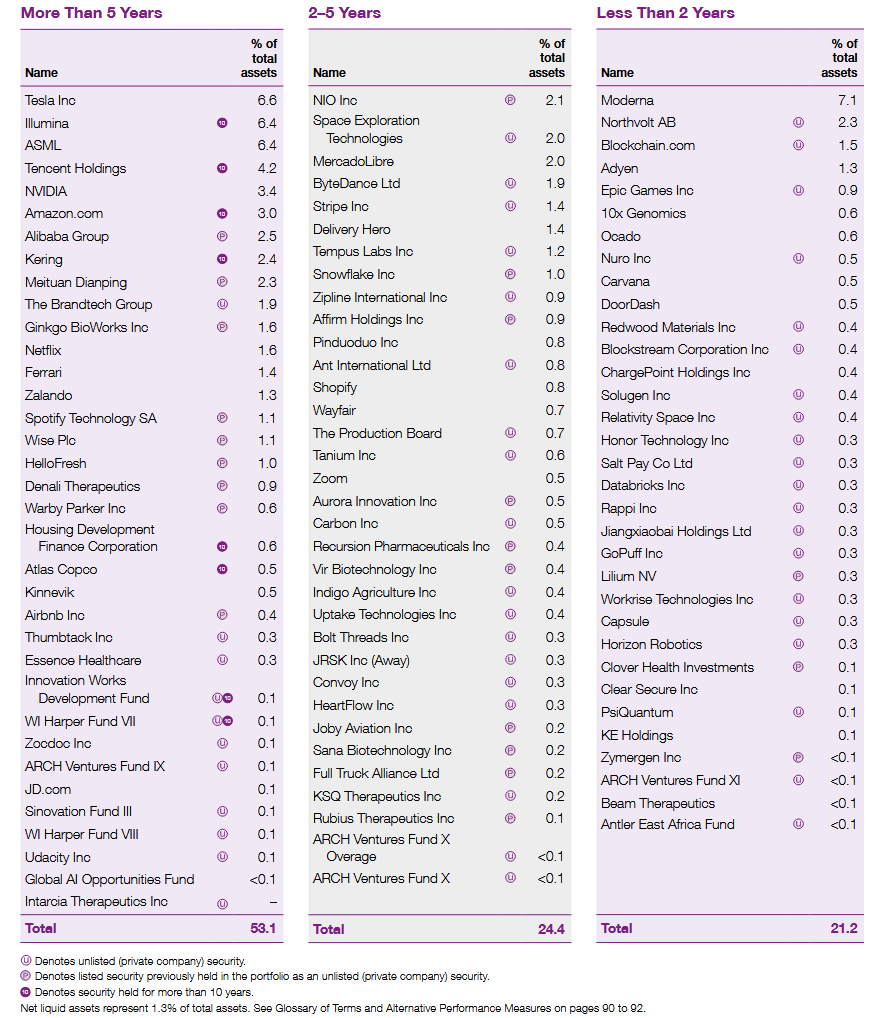
Indeed 53% of their portfolio are holdings they’ve held over 5 years, including Nvidia (NVDA), and ASML Holding NV (ASML). And they have several holdings that are over 10 years old, including Amazon (AMZN), Tesla (TSLA), and Illumina (ILMN).
They’re also holding long names you’d recognize, that they’ve held before such went public. Note all the holdings with a circled P beside their names. Also note all the private holdings, like Space X, the fund has. This signifies to me that they know how to do their research:
Scottish Mortgage Trust holdings by length of time held (Scottish Mortgage Investment Trust website)
When I last examined ARKK back in March of 2022, in my article ARKK is Starting to Sink Into Value Territory , it had only one unlisted holding at the time: Compugen Ltd. Today it has none.
STMZF further puts its money where its mouth is, regarding holding long, as their portfolio turnover is sub 20% most of the time:
Scottish Mortgage Trust turnover (SMT’s May 2022 Annual Report )
ARKK, on the other hand, has a turnover of 55% , significantly over the median ETF turnover of 31.98%, as printed on Seeking Alpha. It’s not that it doesn’t hold long, as it does strive to do so:
ARK evaluates whether each investment opportunity: (i) will have the growth potential to earn a premium over the market; (ii) will offer investment potential for a duration of at least three to five years; and (iii) is and will continue to be sufficiently investable. - ARK Investment Process
It is indeed holding most of the same big names since my Q1 of 2022 examination of it. But it has trimmed some of its smaller names, resulting in an overall contraction of all its holdings from over 40 in number, at that time last year, down to 30, likely in response to the higher interest rate environment.
But its turnover story likely has more to do with its rebalancing: ARRK tends to trim its winners and reallocate to its losers, as is evidenced by their premature NVDA sale back in January .
However, with structural inflation a real possibility these next several years, the recent tech advancement has been a tale of two markets: the haves, and the have-nots, where profitable big tech has rallied hard, and not-yet-profitable tech (that hasn’t convinced traders they’re part of AI) has not.
So ARKK’s more recent rebalancing to its have-nots is likely one of the reasons for its long term underperformance against STMZF, whose buy and hold strategy has left it with more mature tech names in its top holdings.
Higher portfolio turnover has not translated into higher long term rewards, when comparing ARKK to STMZF, and to Invesco S&P 500 Growth at a Reasonable Price ETF (SPGP), a fund with a similar turnover rate:
| ARKK - October 2014 inception to present (less dividend) (55% turnover) |
| 9.58% |
| STMZF - 10 year return (less dividend) |
| 14.1% |
| STMZF - Era of Money Printing (July 2008 to July 2023) (less dividend) |
| 12.4% |
| STMZF - 30 year return (less dividend) |
| 10% |
| SPGP - return since June 2011 inception (50% turnover) |
| 14.39%, or 15%-handle with dividend |
| Data captured July 3, 2023, Google Finance, Charles Schwab |
Further, we can take a look at how each fund has traded Tesla over the years to get a feel for why STMZF has likely outperformed ARKK.
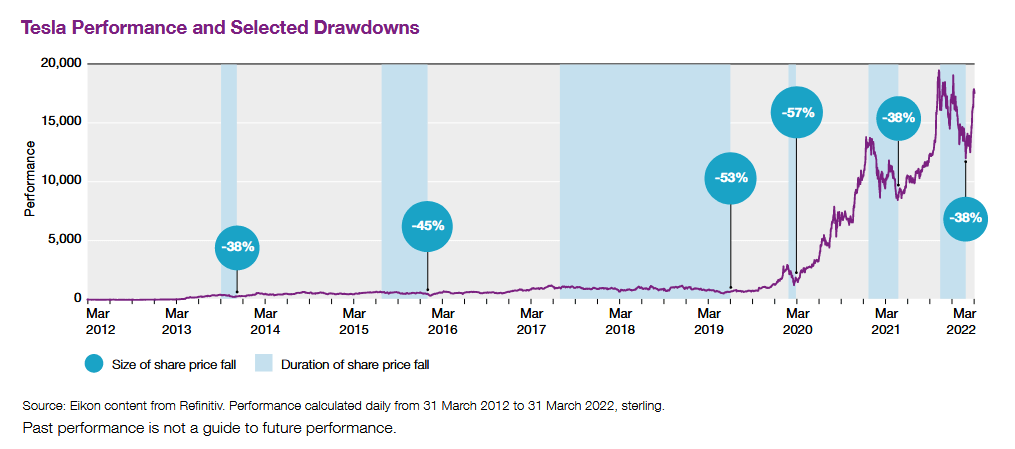
STMZF is willing to walk down the valleys to climb to the top of the mountain:
What makes long-term investing difficult is that progress is rarely a straight-line. Genuine long-term investing requires not just patience but the ability to endure periods of intense discomfort. We have experienced such discomfort often with our holdings.
Tesla was first purchased by Scottish Mortgage in January 2013. It experienced a fall of 40% that first year alone. During the course of our ownership, it has now fallen by 30% or more on seven occasions.
STMZF's Tesla returns from holding long (STMZF's annual report, 2022)
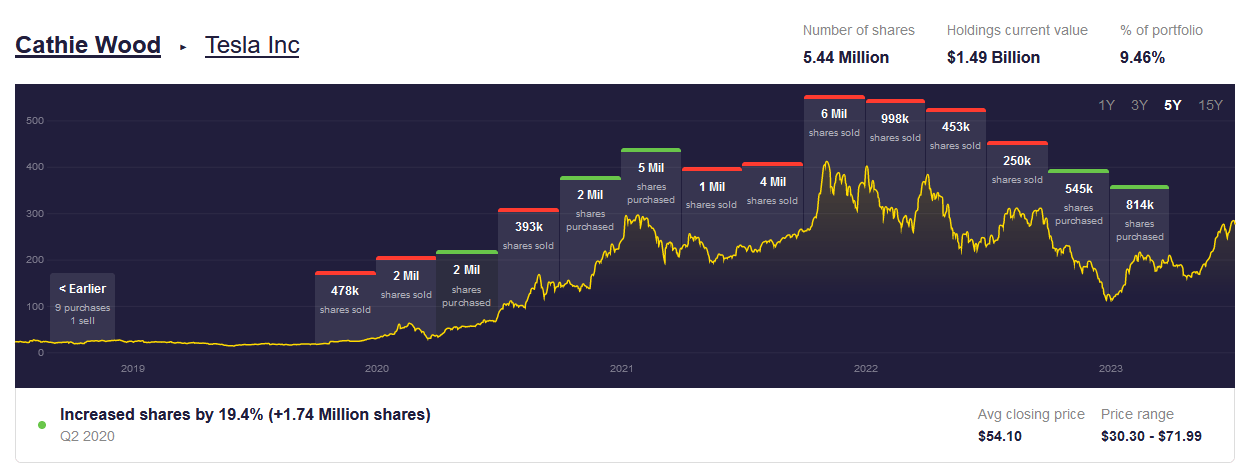
Cathy Wood, on the other hand, has traded in and out of Tesla 24 times since originally purchasing it, resulting in an overall gain of 218% . To be fair some of this trading was for a couple other ARK funds, as well as ARKK:
Cathy Wood's Tesla Trades for ARK funds (StockCircle.com )
But the point is, just buying and holding, and adding, is better than trying to trade in and out of Tesla.
Holdings
Here are STMZF's current top holdings:
STMZF Holdings (Scottish Mortgage Trust website)
STMZF Holdings (Scottish Mortgage Trust website)
STMZF holdings (Scottish Mortgage Trust website)
There is some minor overlap between STMZF’s top holdings and ARKK’s 30 holdings (STMZF does also hold Roblox ( RBLX ) at a 0.9% weighting, not shown above):
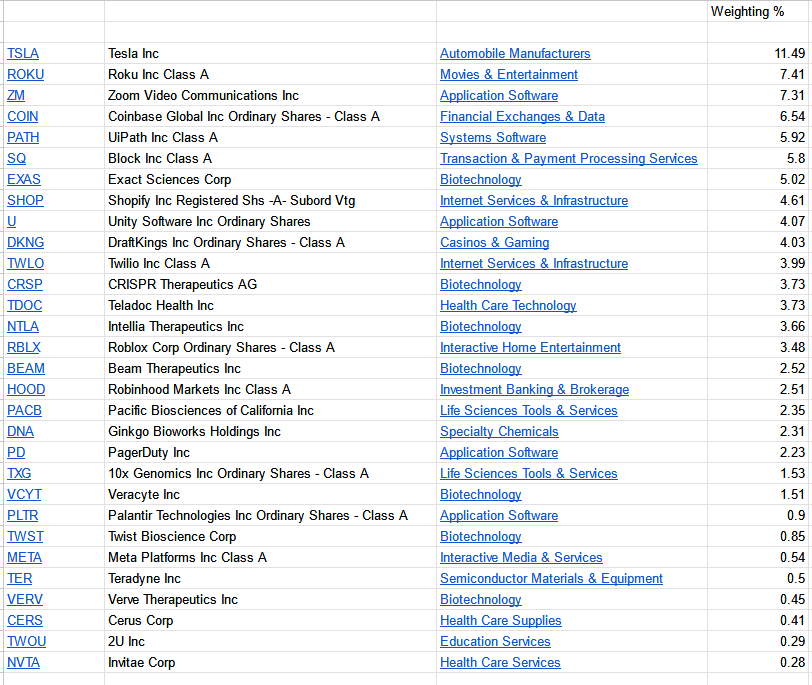
ARKK Holdings 7/4/23 (Charles Schwab)
... but owning both funds certainly gives you a broader exposure to innovative technology.
And what is notable here, as alluded to earlier, is that of STMZF’s top publicly traded holdings, there are significantly more that are mature enough to have analysts, or algorithms, assign them a 3-5 year earnings growth quantifications, compared to ARKK’s. Not a perfect metric to watch, at this point in the cycle, hence I won’t quantify such, but just more evidence of STMZF’s long approach.
However, it is possible that as ARKK matures over the next several years, that it may catch up to STMZF, with regard to more mature holdings. This is why I’m still holding my ARKK shares, instead of reallocating to STMZF.
Valuation
Examining the fair values of STMZF’s top publicly traded holdings, based on Morningstar’s calculated long term fair values, or other means of quick evaluation, such as the Lynch PEG = 1 at fair value, or price to sales compared to history, or sector, I calculated a weighted price to fair value of this basket at 0.91 on 7/6/23.
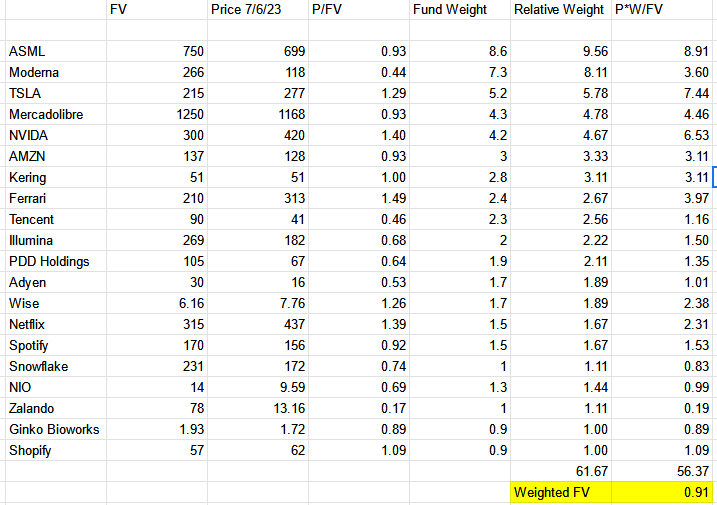
STMFZ's Top Public Holdings Valuation Calculation (Morningstar, Charles Schwab, author's weighting calculation)
If this held true across the fund then its fair value would presently be $9.10, based on the 7/6/23 closing price of $8.29.
Keep in mind there’s likely a lot of hidden value in the fund in their private investments. For example Starlink went from having 1M subscribers in December to having 1.5M five months later . That looks like a network growth story in the making.
Looking at ARKK’s holdings, and comparing the sum of their capitalizations against those set to fair value, I came up with a price to fair value of 0.8, and a fair value price for the fund at $56.4, on the 7/3/23 closing prices.
This is below my blended fair value of $71.50 , back in March of 2022. Alas, the higher interest rates have caused multiples contractions of ARKK’s holdings.
Back then, I recommended a 15% margin of safety ($60.77) to start a position, then add little by little into negative momentum, to account for this attrition of multiples. Using that strategy I was able to build a position with an average cost of $47.95.
Given that there is a recession at some point on the horizon, and that the price was $30 when the market had fully priced in a recession last year, I would let the price fall back into the upper $30’s range to start or add to a position, then dollar cost average down.
STMZF is a little more tricky in that it’s currently near the price it was at when the market had fully priced in a recession, so it may be warranted to wait until its local low in May of 2023 is breached before initiating a start of a position. That’s approximately 15% below its fair value, for a margin of safety.
Safety Scores
Considering we are likely near or at the final stage of the business cycle, and that borrowing costs are getting rolled higher, let’s take a look at STMZF and ARKK’s financial strength, as scored by Gurufocus. These score’s take into account things like debt to EBITDA, which is important in credit ratings, and weighted average cost of capital versus return on invested capital, which tells us how effectively a holding is using raised capital.
Example Financial Strength Score (GuruFocus)
The weighted average financial strength score of STMFZ’s top public holdings, based on their weightings in the fund, is 7.20…
STMZF GuruFocus Financial Strength Weighted Average Calculation (GuruFocus, author's weighting formula)
… while ARKK’s average weight is 6.2:
ARKK GuruFocus Financial Strength Weighted Average Calculation (GuruFocus, author's weighting formula)
It’s notable that when ARKK trimmed the fat over the last year on around a dozen holdings, its Guru Financial Strength score went from my Q1 2022 calculation of 5.52 to today's 6.18. This is confirmation that it sold some of its weaker hands, and is in a stronger position to weather the recession.
If STMZF’s Guru Financial Strength score of 7.2 held true for the entire fund, then it is in an excellent position to get through the end of the cycle as well, as it’s been doing for over 100 years, and multiple recessions, including the Great Depression.
GuruFocus Financial Strength scores for popular equities:
| McDonald's ( MCD ) |
| 4 |
| Lowe's ( LOW ) |
| 5 |
| Johnson & Johnson ( JNJ ) |
| 6 |
| Illinois Tool Works ( ITW ) |
| 6 |
| ARKK |
| 6.2 |
| STMZF (top public holdings) |
| 7.2 |
| Microsoft ( MSFT ) |
| 8 |
| Google ( GOOGL ) |
| 9 |
Conclusion
Though ARKK and STMZF have been severely beaten down from all-time highs and are currently under their fair values, they are holds at present, due to the recession related uncertainty.
However they are not sells, as there is a contrarian case to be made that we are in a new bull market, having already bottomed last year. Further when the recession and/or quantitative tightening eventually breaks some fundamental component of the economy, and the Fed is obligated to print, these funds typically do very well in periods of central balance sheet expansion.
STMZF is the historically superior fund, based on long term price appreciation, and long term strategy, more mature top holdings, as well as its potentially more sound financial strength. However ARKK is likely more undervalued at present, and historically has more explosive price appreciation in the presence of Fed balance sheet expansion.
There isn’t much overlap between the top holdings in these funds, so holding both gives you broader exposure to innovative technology on the horizon.
For further details see:
ARKK Vs. STMZF In The Age Of Money Printing