VNQ - Armada Hoffler: A Mixed Bag In More Ways Than One
2023-05-22 09:00:00 ET
Summary
- Armada Hoffler offers an attractive-looking yield and an impressive 3-year track record for dividend growth.
- AHH reported disappointing Q3 results recently and has significant debt challenges.
- This article examines the growth, balance sheet, dividend, and valuation metrics for this.
It is a well-known fact by now that the COVID pandemic, and the WFH (work from home) trend it spurred, have resulted in a nationwide glut of office space. On May 1, Charlie Munger even went so far as to warn of a potential crash , due in part to " a lot of troubled office buildings".
Armada Hoffler ( AHH ) has quite a bit of exposure to office buildings but is not primarily an Office REIT. Its exposure to other types of real estate has helped the company to escape the depth of woes suffered by similar-sized purer Office REITs, such as Empire State Realty ( ESRT ), American Assets Trust ( AAT ), and Paramount Group ( PGRE ).
Meet the company
Armada Hoffler
Founded in 1979 and headquartered in Virginia Beach, Armada Hoffler went public as a REIT in 2013. Ten years later, it is still a small-cap at $0.76 billion.
According to the annual report , the company's stabilized portfolio boasted 6 million rentable square feet. Occupancy stood at an impressive 97% occupancy through March 31, with leasing spreads north of 10% on a GAAP basis, even in its office segment, but under 5% on a cash basis. Its high-quality portfolio is concentrated in the Mid-Atlantic and Southeastern U.S., with a special concentration of 35 properties in the Greater Baltimore/Washington, D.C. area.
Geographic distribution of AHH assets (AHH annual report)
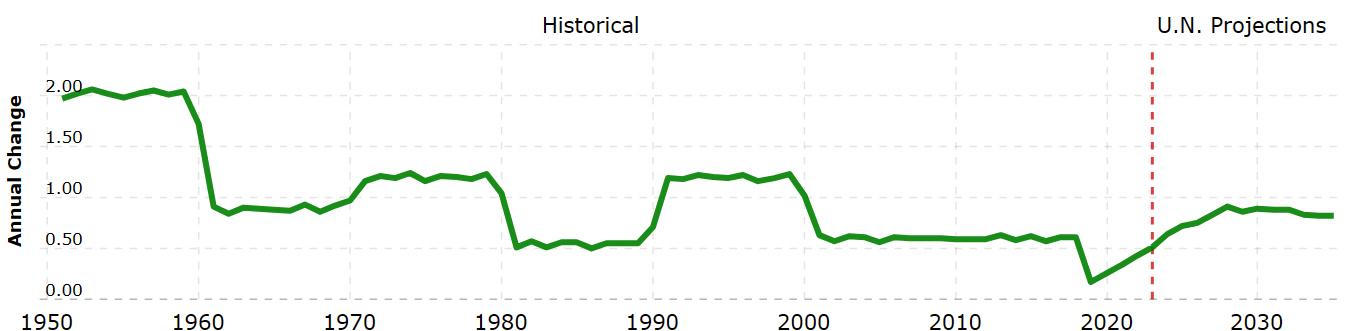
According to Macrotrends, despite a recent uptick, the population growth rate for Baltimore has been steadily declining for the past 70 years.
Population growth for Baltimore since 1950 (Macrotrends.com)
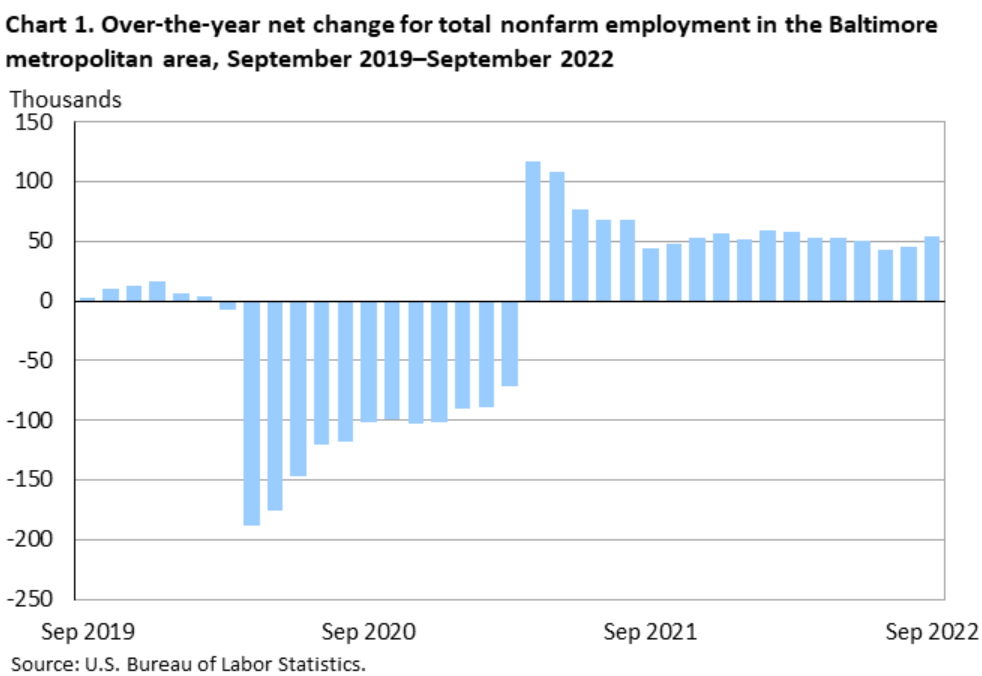
Employment growth in the Baltimore metro area, which lost about a million jobs during the pandemic, has leveled off at about 50,00 per month, according to the Bureau of Labor Statistics .
U.S. Bureau of Labor Statistics
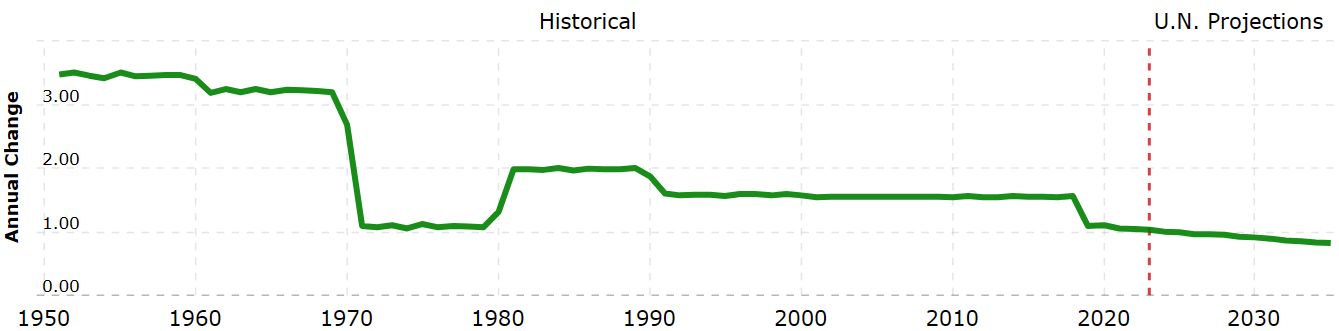
Similarly, Washington, D.C., which was growing by more than 3.0% per annum in 1950, has seen a steady decline in population growth, which now stands at about 1.0% and is expected to fall further.
Population growth for Baltimore since 1950 (Macrotrends)
Again according to the U.S. Bureau of Labor Statistics , D.C. employment growth, which suffered badly during the pandemic, rallied briefly in 2021 and has since resumed tailing off.
U.S. Bureau of Labor Statistics
Although not ghost towns by any means, Baltimore and Washington, D.C. are not exactly hot markets.
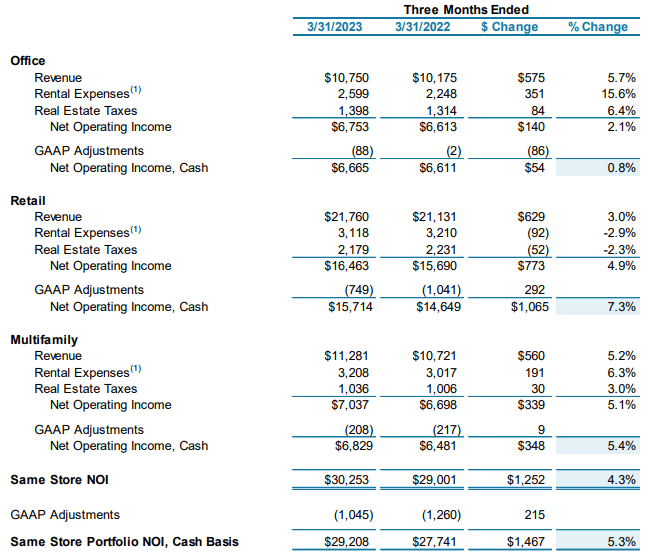
Although it has a large exposure to Office properties, AHH derives more of its NOI from its 38 Retail properties (44%) than from its 9 Office (34%) or 10 Multifamily (22%) assets. The Multifamily segment is expected to grow to 25% of NOI by the end of 2023.
Of the three segments, Retail showed the healthiest year-over-year growth this quarter in same-store NOI, at 7.3%. The Multifamily segment grew NOI at 5.4%, and the Office segment predictably brought up the rear, at 0.8%.
Same Store NOI by segment (AHH Q1 2023 earnings supplemental)
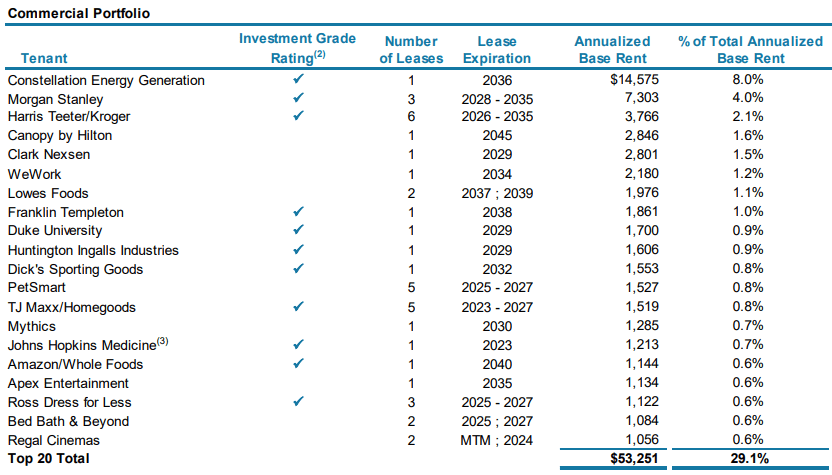
The company's tenant roster is not ideally diversified, since the top tenant, Constellation Energy Generation, accounts for 8.0% of ABR (annual base rent). However, concentration tails off quickly after Constellation, so that the top 20 AHH tenants together account for only 29.1% of ABR.
Top 20 AHH Tenants (AHH Q1 2023 earnings supplemental)
Quarterly results
Here are some highlights from Q1 results, reported May 9:
- FFO of $20.6 million, down (-25.4)% YoY (year-over-year).
- FFO per share of $0.23, down (-25.8)% YoY.
- Maintained full-year FFO guidance.
- Maintained 97% portfolio occupancy (98% retail, 97% office, 96% multifamily).
- Acquired The Interlock, a retail and entertainment center in Atlanta that includes 50,000 square feet of technology office space, for $100 million, financed mostly by fixed-rate loans and OP units, at a 6.5% going-in cap rate.
- Increased the dividend by 2.6%, to $0.195 per share, nearly restoring its pre-pandemic level of $0.22.
- A $60 million multifamily development in Belmont, N.C. is expected to stabilize in Q2 2023. It is 98% leased, and AHH owns an 85% stake.
- A $119 mixed-use facility in Roswell, Georgia, is expected to stabilize in Q4 2024. It is 100% owned by AHH, and 61% leased.
- A $264 million T. Rowe Price office complex in Baltimore is 93% leased and expected to stabilize in Q3 2024. AHH owns a 50% stake.
- A $225 million mixed-use facility in Baltimore is expected to stabilize also in Q3 2024. AHH owns a 90% stake.
- Morningstar has issued a BBB credit rating for the company with a stable outlook.
Growth metrics
Here are the 3-year growth figures for FFO (funds from operations), and TCFO (total cash from operations).
| Metric |
| 2019 |
| 2020 |
| 2021 |
| 2022 |
| 3-year CAGR |
| FFO (millions) |
| $80.0 |
| $83.0 |
| $85.4 |
| $106.6 |
| -- |
| FFO Growth % |
| -- |
| 3.8 |
| 2.9 |
| 24.8 |
| 10.0% |
| FFO per share |
| $1.10 |
| $1.10 |
| $1.07 |
| $1.22 |
| -- |
| FFO per share growth % |
| -- |
| 0.0 |
| (-2.7) |
| 14.0 |
| 3.5% |
| TCFO (millions) |
| $67.7 |
| $91.2 |
| $91.2 |
| $116.9 |
| -- |
| TCFO Growth % |
| -- |
| 34.7 |
| 0.0 |
| 28.2 |
| 20.0% |
Source: TD Ameritrade, Hoya Capital Income Builder, and author calculations
While FFO growth appears to be very healthy at 10.0%, FFO/share has grown at only a 3.5% clip. Thus, the gains in FFO appear to have been financed primarily by issuing new shares.
Meanwhile, here is how the stock price has done over the past 3 twelve-month periods, compared to the REIT average as represented by the Vanguard Real Estate ETF ( VNQ ).
| Metric |
| 2020 |
| 2021 |
| 2022 |
| 2023 |
| 3-yr CAGR |
| AHH share price May 16 |
| $7.07 |
| $13.08 |
| $13.06 |
| $11.04 |
| -- |
| AHH share price Gain % |
| -- |
| 85.0 |
| (-0.2) |
| (-15.5) |
| 16.0% |
| VNQ share price May 16 |
| $68.8 |
| $97.08 |
| $96.17 |
| $79.84 |
| -- |
| VNQ share price Gain % |
| -- |
| 41.1 |
| (-1.0) |
| (-17.0) |
| 5.1% |
Source: MarketWatch.com and author calculations
In each of the three trailing 12-month periods, AHH has outperformed the VNQ. However, the company's 3-year CAGR of 16.0% is almost entirely an artifact of its 2021 performance, coming out of the COVID abyss of May 2020.
Balance sheet metrics
Here are the key balance sheet metrics. AHH measures far worse than the average REIT for liquidity, debt ratio, and debt/EBITDA. It has a modest hole to dig out of.
| Company |
| Liquidity Ratio |
| Debt Ratio |
| Debt/EBITDA |
| Bond Rating |
| AHH |
| 1.40 |
| 50% |
| 8.1 |
| BBB |
Source: Hoya Capital Income Builder, TD Ameritrade, and author calculations
AHH was holding $33.8 million in cash as of March 31. The company's $1.11 billion in outstanding debt is held at a weighted average interest rate of 3.9% and average maturity of 4.4 years. Of that debt total, 21.0% is held at variable interest. That might not be such a bad thing, if indeed the Fed has decided to pause on rate increases. Otherwise, it spells trouble.
The company provides this helpful picture of their capital structure.
AHH Capital Structure (AHH Q1 2023 earnings supplemental)
Debt service coverage ratio is 2.8x, and fixed charge coverage ratio is 2.3x.
Chief financial officer Matthew Barnes-Smith had this to say on the quarterly earnings call :
As we continue to transition our balance sheet towards long-term fixed rate unsecured debt, we will maintain our liquidity and respectable financial metrics. . . We have no debt maturities in 2023 and the small amount of debt maturing in 2024 and 2025 will be paid off at maturity adding these assets to our unencumbered borrowing base. You would have noticed from our supplemental financial package that we are currently over hedged. This is due to several timing factors and will self-correct over the coming year as these derivatives expire.
Dividend metrics
Armada Hoffler's 3-year track record as a dividend payer is sensational. Currently yielding 6.95%, the company has grown its dividend by 21.0% over the past 3 years, resulting in an eye-popping Dividend Score of 12.31.
| Company |
| Div. Yield |
| 3-yr Div. Growth |
| Div. Score |
| Payout |
| Div. Safety |
| AHH |
| 6.95% |
| 21.0% |
| 12.31 |
| 60% |
| D+ |
Source: Hoya Capital Income Builder, TD Ameritrade, Seeking Alpha Premium
Dividend Score projects the Yield three years from now, on shares bought today, assuming the Dividend Growth rate remains unchanged. However, the company's debt problems jeopardize the quarterly distributions so much that Seeking Alpha Premium assigns a Dividend Safety grade of D+.
Valuation metrics
AHH is selling at a Price/FFO well below the REIT average, and a discount to NAV that should also be slightly attractive to value investors.
| Company |
| Div. Score |
| Price/FFO '23 |
| Premium to NAV |
| AHH |
| 12.31 |
| 9.2 |
| (-22.6)% |
Source: Hoya Capital Income Builder, TD Ameritrade, and author calculations
What could go wrong?
There is a risk that the Fed will continue raising interest rates, which could cramp Armada Hoffler's cash flow by increasing the interest expense on its fairly large variable interest rate debt. And of course, it's also possible that Charlie Munger is right, and the sky really is falling.
Investor's bottom line
Armada Hoffler is a strong little company that has returned to healthy growth, despite its extensive exposure to office properties. Its Price/FFO and yield are attractive to value investors, and its dividend growth track record is impressive to growth investors. However, its indebtedness creates mitigating challenges and risks. As a growth investor, I rate the company Tempting (in other words, Hold plus).
This puts me in step with the Seeking Alpha Quant Ratings, but out of step with the Wall Street analysts covering the firm, and my fellow Seeking Alpha contributors, who consider AHH a Buy.
Seeking Alpha Premium
Three of the five Wall Street analysts covering the firm rate AHH a Strong Buy, with the other two a Hold and a Sell. The average price target is $14.13, implying 28% upside.
TipRanks rates AHH on the high side of Neutral. The Street and Zacks rate it a Hold, and Ford Equity Research a Sell.
However, as always, the opinion that matters most is yours.
For further details see:
Armada Hoffler: A Mixed Bag, In More Ways Than One