ARW - Arrow Electronics: Compounding Well In Situ Across FY'23 So Far Initiate Buy
2023-09-06 02:41:41 ET
Summary
- Arrow Electronics is potentially undervalued and offers compelling value for investors in my view.
- ARW has more capital invested per share than its current market value per share, quite a rare phenomenon.
- Each turn of invested capital generates around $4 in sales, and the company has a strong ability to generate economic earnings for shareholders.
- Net-net, initiate buy.
Investment briefing
There is compelling value to be unlocked in buying the equity stock of Arrow Electronics (ARW) in our informed opinion. Based on the raft of economic factors discussed here today, I advocate ARW suits the long account based on several factors:
- ARW sells with more in capital invested per share than its current market value per share;
- Each turn of invested capital produces ~$4 in sales, and the capital it's deployed into operations returned ~$25/share in trailing post-tax income in Q2 (above net income);
- The market may not have reflected this earnings power into its current market value.
Based on the culmination of factors discussed here today, short-term machinations in the company's end-markets (especially the cyclicality of order volumes and its backlog) do not appear a meaningful drag on future business performance, or hinder its ability to generate economic earnings for shareholders. Net-net, I initiate ARW as a buy at an initial objective of $155/share.
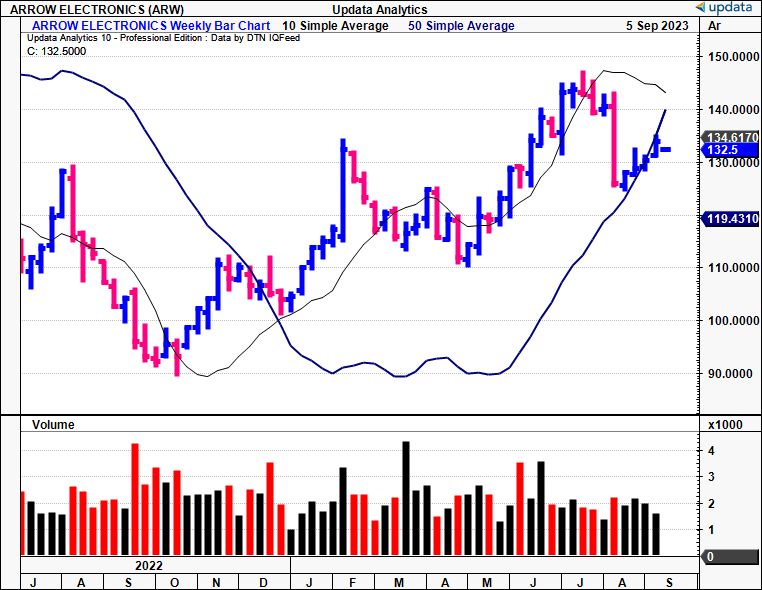
Figure 1. ARW weekly price evolution, 2022-date
Risks to investment thesis
It is critical that investors recognize, in full, the following set of risks that could potentially impact the thesis:
- ARW's core markets are cyclical and subject to competitive change. This could result in ARW having to allocate an outsized portion of resources to match this competition, with no guarantees of success.
- The company is amid an inventory correction and this may have an impact on its operating cash flows going forward.
- We shouldn't ignore the macro-level risks either, namely, the inflation/rates axis and the corresponding impacts to capital flows.
- Related to (3), should ARW fail to catch a bid, this could impact the propensity of it pushing towards the price targets outlined here today.
Investors must realize these risks before proceeding to any investment decisions.
Critical facts to investment debate
Brief overview of operations
ARW is a global provider of electronic components and enterprise computing solutions for industrial and commercial users. It provides services, solutions, and tools that aid suppliers in distributing their technologies onto the market.
ARW operates through two business segments:
-
Global components: ARW distributes electronic components to original equipment manufacturers ("OEMs") and contract manufacturers ("CMs"). In Q1 FY'23, ~78% of the company's sales came from this segment.
-
Enterprise computing solutions: This segment focuses on enterprise computing solutions ("ECS"), and is service based. It contributed to ~22% of ARW's Q2 top-line.
Collectively, these segments offer a broad array of technological solutions in the value chain. The company started way back in 1935 and thus has demonstrated its ability to withstand numerous market cycles and still remain a profitable entity.
Q2 FY'23 insights
1. Breakdown of the P&L
ARW put up r evenues of $8.5Bn for Q2 , a 10% YoY decline. The contraction was underscored by reduced volumes in global semiconductor markets and overall business cyclicality. It pulled this to core EBITDA of $448mm, down from $581mm last year, and earnings of $4.17/share, also down 25% YoY. More on profitability a bit later.
The divisional breakdown is as follows:
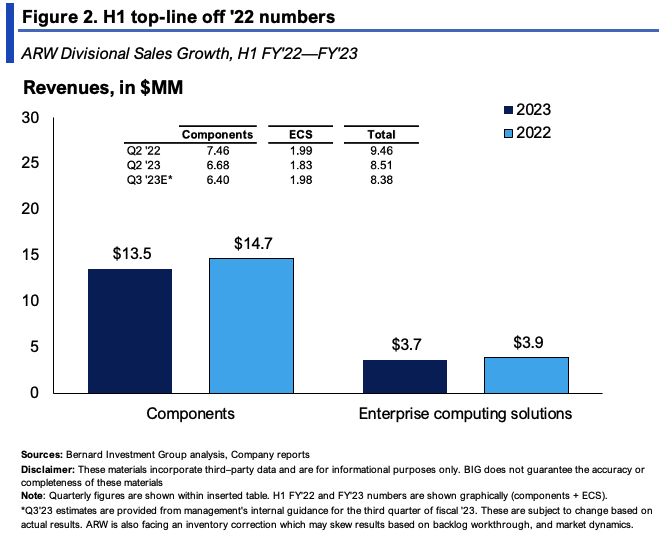
- In its global components segment, as expected, it booked of $6.7Bn, down by 10% YoY. Still, demand-dynamics in its EMEA markets saw substantial YoY growth, growing 18% to $2.15Bn. It pulled this to gross of 12.5%, a 60bps compression last year. Despite the headwinds, management mentioned that global lead times are falling, and that inventory remains relatively well matched with demand.
- ECS sales were clipped at $1.8Bn, aligning with projected figures buts still down 8% YoY. Critically, the ongoing shift of customers from software + cloud solutions over to IT solutions influenced this trend. Nonetheless, it spoke of strength in cybersecurity offerings in Europe through its ArroSphere platform. Divisional highlights are observed in Figure 2.
Moving down the P&L, evidence of ARW's cost reduction efforts were reflected in adj. OpEx of $656mm, down both sequentially and YoY. The company maintained profitability on this and clipped adj. operating income of $410mm. Specifically, components came in with an operating margin of 5.8%, while ECS pulled to 4.8%.
2. Working capital density and operating cash flow
One of the conflicting points for mine is the working capital density ARW requires to maintain its operations. You're looking at NWC of ~$7.5Bn ($135/share) from its Q2 accounts-ahead of its current market cap of $7.45Bn ($133/share) as I write. There is potential value in this because the market may not be reflecting the growth its NWC work-through (I'm thinking receivables and inventories here) could provide to earnings and free cash flow. The hurdle for ARW will be to move these inventories out the door in spite of the underlying market headwinds.
But ARW is projecting sales between $7.78Bn-$8.38Bn for Q3, which is a sequential decline. Global component sales are forecast to put up ~$6Bn-$6.4Bn, down 7% from Q2. Critically, the decrease is due to its high inventory levels across the customer base (thereby slowing order volume and aggregate demand) plus the ongoing sluggishness in the APAC market (China, primarily). Collectively, these two points may prove to be a headwind to ARW working through its backlog.
This is quite important here given ARW's sales are booked on an order-by-order basis instead of long-term sales contracts. Hence, it needs order volumes to be high in order to book sales growth-these aren't folded into pre-arranged agreements.
A further breakdown on Q2 NWC:
- Accounts receivable rose to $11Bn, which led to an increase in days of sales outstanding from 111 in the first quarter to 118.
- Accounts payable remained stable at $9Bn, but days of payables increased from 104 in the previous quarter to 111.
- Most critically, inventories (recorded at book value) decreased by ~$75mm to ~$5.5Bn, but inventory turns remained constant at 5.5x. More on this below.
Consequently, the cash conversion cycle remained almost unchanged in the second quarter and stood at 74 days. Hence, it is turning its NWC to cash every 2.5 months or so. On this, it booked an OCF outflow of $127mm thanks to the growth in receivables, now realizing $97mm in net OCF for the YTD.
The points on inventory backlog cannot be overstated. Per the CEO on the call:
Having said that, we recognize we operate in a cyclical industry, and we're currently managing through an inventory correction. While I can't say for certain how long this will last, I can tell you that we've experienced these cycles before, and fully understand what it takes to navigate them. We've always been a resilient business and see times like these as opportunities to strengthen the company for the future. To that end, we remain focused on our strategic priorities for accretive growth and exercising prudent cost management and working capital discipline." - Sean Kerins, Arrow Electronics CEO
The 'inventory correction' in question is based on two critical issues:
- Significant demand reductions from customers/end-markets in semiconductor components;
- Write-offs from delinquent inventories on hand.
Typically, these corrections span 2-3 quarters. This is important for ARW, considering its backlog and NWC density. Although it has worked through some backlog, it remains "multiples bigger than it was pre-pandemic-multiples". And ~66% is considered to be useable, but >25% is categorized as delinquent. Consequently, an unhealthy combination of demand pullbacks and delinquent inventories are two critical factors I'd be watching with ARW going forward.
Question is-what's the solution here?
First, ARW's lead times have improved, as mentioned earlier. These are lead times from suppliers, implying it is getting raw materials quicker after ordering. That means ARW is better positioned for changes in demand, can reduce the amount of inventory held, whilst lowering carry costs.
Secondly, pricing and margin stability in the mass market-ARW's primary focus-is more consistent over time than the larger end of the market, which primarily consists of the OEM majors.
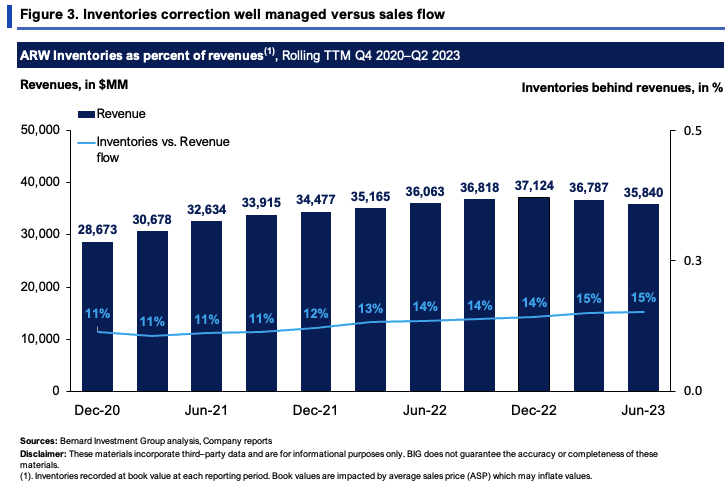
Third, as a function of sales flow, ARW has kept its inventory levels in check. Figure 3 outlines the company's inventories at book value versus revenues on a rolling TTM basis. Absolute values are shown for each, rather than changes each period. The company has maintained this dynamic within a 4 percentage point band, with inventories to sales rising from 11% in 2020 to 15% last quarter, even with the sequential downsides at the top line. This is good form moving forward.
Economic growth levers
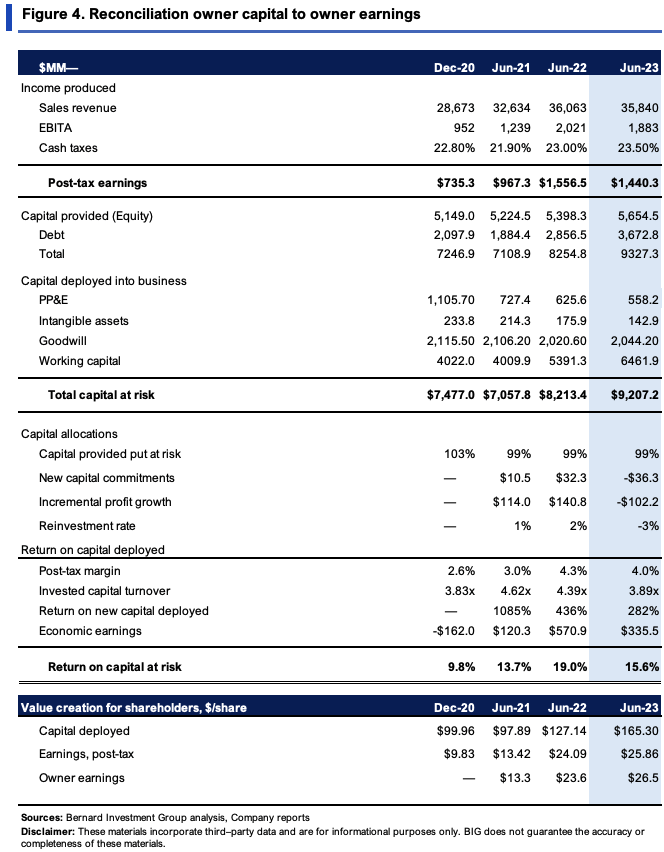
A more thoughtful analysis of how ARW is producing economic value is required for prospective investors. Such a view is presented in Figure 4. It shows how much the company has invested, and at what rates of return since 2020 on a rolling TTM basis. It portrays what amount of earnings after tax is produced on these investments (earnings considered net operating profit after tax here).
Critically, $9.2Bn in capital produces $1.44Bn in post-tax earnings as I write, a shade off the $1.55Bn produced on $8.2Bn last year. However, growth has been persistent since 2020. In investment terms, you're looking at $165/share in capital producing $25.86/share in after-tax earnings, a 15.6% return on investment. It was 19% last year, and 13.7% in Q2 2021.
If long-term market returns are around 12%, you're looking at ARW creating value for its shareholders at these rates of return. As such, the economic earnings produced on its capital commitments have ranged from $120-$570mm in Q2 2021-'23.
The value is driven by tremendous turnover of capital, tallying 3.9x in Q2, and above 4x in earlier periods. This squares off with the economics of the business, in that profit per unit is low (post-margins are in the low single-digits) but because ARW moves so much inventory out the door, each $1 of its investments-including working capital-brings back ~$4 in sales. These are attractive economic characteristics in my view.
Note: Working capital calculations exclude cash here. Inclusive of cash, NWC comes to around $7.5Bn. (BIG Insights)
Valuation and conclusion
ARW sells at mouthwatering multiples of 8.2x forward earnings and 7.3x forward EBIT. Looking at earnings yield as a function of pre-tax income, you've got ARW offering 13.7% forward yield on these figures-tremendous value if you ask me based on what's been discussed on its economic drivers.
It also has $165.30 of capital invested per share-roughly 24% ahead of its current stock price as I write. ARW is, therefore, trading at a discount to the capital it has invested on a per-share basis, quite a rare phenomenon in my experience.
The question is why. Why has the market priced ARW so low, and what says this is even justified. Figure 5 looks through an enterprise value lens. It strips out the cash and adds in the debt recorded on the balance sheet, getting you to $11.44Bn in EV. Still, this is just a 1.24x premium. We typically use the ratio of ROIC/hurdle rate as a kind of 'no growth' proxy to see what growth is or isn't priced into a company's current market value, by comparing it to the EV/IC ratio. Here, the hurdle rate is 12%, as mentioned, reflecting long-term market returns. At this calculus, the ROIC/12% ratio is 1.3x-telling me that only ~95% of ARW's earnings power is priced into its current market values. To me this seems undervalued, and supports a buy rating.
Added to that-the stock trades at an EV/EBIT of 7.3x, as mentioned, reducing to 5.2x after-tax. It produced 15-16% return on the capital deployed into the business. So, if the post-tax earnings are $25.86/share, should these grow by 15.5%, you're looking at $29.87/share going forward (25.86x1.155 = 29.87). Presuming the same 5.2x multiple, this gets you to $155/share in implied market value. I am therefore looking to this as the initial price objective.
BIG Insights
Net-net, ARW's operations are highly sensitive to changes in market dynamics and we've seen this in its H1 FY'23 numbers. What's more important in my eyes, is how the company is creating value for shareholders in spite of these challenges. Critically, the company has more in invested capital per share than it does in market value as I write. This capital is also very productive, spinning off 15-16% returns last period (TTM values). Secondly, it would appear the market hasn't fully priced in the forward earnings power on these economics. Inventory turns and invested capital turns are both high-5.5x and 3.9x, respectively-illustrating where the value is derived. On these figures, plus the fact ARW sells at 13.7% forward pre-tax yield (19% after-tax) supports a buy rating in my view. Initiate buy at $155/share.
For further details see:
Arrow Electronics: Compounding Well In Situ Across FY'23 So Far, Initiate Buy