PBPB - Artko Capital Q4 2022 Partner Letter
Summary
- Artko Capital invests in small/micro cap companies and special situations within a concentrated portfolio.
- For the fourth calendar quarter of 2022, an average partnership interest in Artko Capital LP was up 6.7% net of fees.
- For the calendar year of 2022, an average partnership interest in Artko Capital LP was down 33.9% net of fees.
- We expect at least one morepotentially double-digit market draw down in 2023.
Dear Partner,
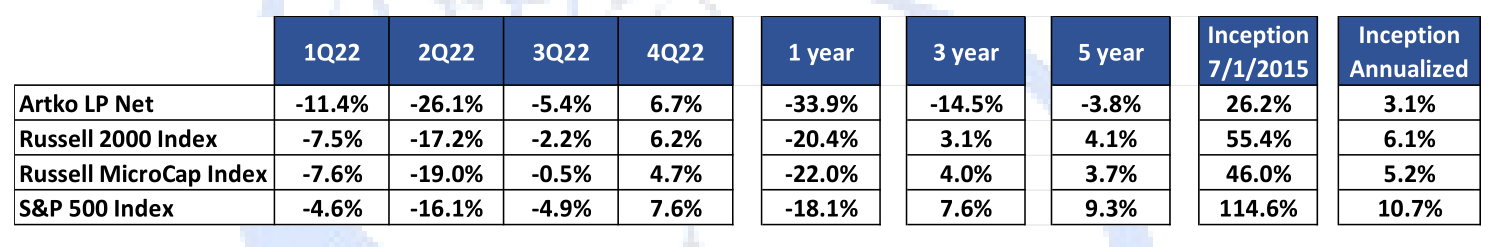
For the fourth calendar quarter of 2022, an average partnership interest in Artko Capital LP was up 6.7% net of fees. At the same time, investments in the most comparable market indexes—Russell 2000, Russell Microcap, and the S&P 500—were up 6.2%, 4.7%, and 7.6% respectively. For the calendar year of 2022, an average partnership interest in Artko Capital LP was down 33.9% net of fees. At the same time, investments in the most comparable market indexes—Russell 2000, Russell Microcap, and the S&P 500— were down 20.4%, 22.0%, and 18.1% respectively. Our results this year came from Currency Exchange International ( CURN ), while losses in GAIA and Polished.com warrants ( POL.WS ), as well as a broad portfolio pullback detracted from the overall performance. We share our outlook and full portfolio review for 2022 in the sections below.
On the coming end of “weirdness”
“No, no! Sentence first—verdict afterwards!” – Queen of Hearts, Alice in Wonderland
We are going to depart a little from the usual way we discuss our annual results because while over the 12 months of 2022 our portfolio’s performance was negative 34%, in the first month and a half of 2023 our performance is up close to 27%. This is not to deflect from the disappointment of 2022 but more to point out that in 2022 our portfolio was up and down 20% twice and this is our third trip in less than a year in the 20%+ category. We had written to you a year ago that part of our expectation was as the economy transitioned from one with nearly costless capital to one with capital costs above 5%, the transition would result in substantial volatility in our portfolio before the semblance of rationality returns to the markets and company stock prices converge to their fundamental values. In January 2023 our portfolio was up 23%, the highest monthly return we have had in almost 8 years of existence, which is saying something considering we have been in business during the tumultuous events of Grexit, Brexit as well as Covid and its recovery. While we are encouraged by the strong start to 2023, with at least a part of this uptick finally beginning to be driven by individual company fundamentals, which we are excited to share with you, we do not believe we are out of the volatility woods just yet and expect at least one more potentially double-digit market draw down in 2023.
We believe there is too much false hope placed in some sort of interest rate pause/decline and that recessionary headwinds are mostly blowing over. More caution is needed. However, despite our funds’ bear logo, we are far from being market and economy bears. Our belief is that things are not as simple as lower inflation and economic slowdown equaling a dovish Federal Reserve which immediately begins lowering rates. As we have written in the past, the naïve, and quite embarrassing, belief by the Federal Reserve that the recent bout of inflation was only “transitory” has shown itself to be untrue. High inflation has never been easy to put away and while the substantial interest rate hikes and the clearing out of the supply chains have slowed down goods inflation substantially, the services part of the economy which represents close to 80%, has yet to moderate its velocity to “safer” levels, coming in at 7.2% in the latest January CPI reading. While certain sectors of the economy have shown a recessionary-like slowdown, other parts continued to grow substantially, with the January payroll number coming in at a red hot 500,000+. All of this paints a pretty muddy and uncertain economic picture and we strongly believe that a previously dovish and embarrassed Federal Reserve that desperately needs to restore its credibility is unlikely to stop its rate increases in the near future, let alone revert back to a looser money policy. We expect rates in 2023 to finish higher than 6%, to stay at those levels for many quarters, and would be surprised if inflation slipped to low single digits before year-end. That is the bad economic news where we believe we are more hawkish than the market which would result in more volatility.
On the other hand, we are more positive on economic growth, and at least from a general definition perspective, are likely to avoid an outright recession, or at worst have a mild 2001-like recession, with a contraction measured in tens of basis points instead of hundreds. We are also quite bullish on the market in general. Our experience tells us that the markets have mostly digested the possibility of an economic slowdown and are still substantially below their 2021 peaks, with Russell 2000 still more than 20% below its November 2021 high. Since markets tend to be forward-looking, perversely any recessionary news is likely to be met with a positive reaction as it would mean we are close to the beginning of a new cycle, with a more rational monetary policy. As we have discussed in the past, this is the time when small cap value stocks tend to shine the most with opportunities to grow their earnings at much faster rates than their large cap brethren and we have already begun to see some decoupling from market-related stock price moves to more fundamental ones. It should be noted that going back to the 1970s the average small cap draw down from last high to new high lasts an average of 2 years and returns 70%+ off the bottom and 23% off the last high - most recently last recorded in early November 2021.
The last three years have been both maddening and frustrating as things that have mattered and worked during times of rationality, such as clean balance sheets, high returns on capital, profitability or incentivized management have been replaced by “substantial opportunities” in digital pictures of monkeys and “real estate” in virtual worlds. The one upside to the carnage of 2022 is that these fads seem to have finally imploded, and with a higher cost of capital market participants are starting to pay attention to things that matter: fundamentals. Those are the things that matter most to us, and while the price performance of our portfolio from late 2021 to late 2022 has been dismal, the growth in fundamentals has been anything but as we saw a median revenue growth rate of 20%. We probably devoted more room in this letter than we would like to macro and markets but returns obviously matter and it is important to share our views of where we believe we are positioned in the upcoming year.
We have had one significant fundamentals-based detraction in the portfolio from our position in the warrants of Polished.com which cost us over 6% in negative alpha in 2022, but one where we believe 2023 could see a substantial reversal which we discuss below. The rest of our portfolio showed good to great growth in revenues and profitability and is likely to weather any economic slowdown in the intermediate term with only mild effects.
To share some portfolio statistics for eight companies which represent approximately 97% of our portfolio:
- Our median/average market cap is a $120mm/$235mm. These numbers include our investment in The Shyft Group ( SHYF ), that has grown from $280mm to $1.1 billion during our holding period, and excluding this success story both our median and average are at a $102mm. These numbers compare to $225mm/$797mm for the Russell Microcap Index, our closest comparable index, and represent our continued commitment to offer you an investment product in securities that for the most part are unable to be included in an index due to their size or liquidity constraints.
- Our median/average portfolio’s net cash balance is 4.5%/12.3% of the market cap representing our commitment to strong balance sheets.
- Our median/average insider holding is 23.1%/26.5% at over $20mm of what we call insider-value at-risk, which we believe is an important metric where we feel we are co-invested along side our management teams and have shared incentives and risk tolerances.
- Our median growth expectations for our companies EBITDA/Cash flows for the next 3 years are at 75%/81% and our median valuations for 2023 EV/EBITDA and Price to Cash Flows are at 8.1x/7.5x for 2023 which move to 5.1x/5.8x for 2024.
As you can see here and below our portfolio continued to show great growth in its fundamental metrics through economic uncertainty and particular one-off challenges/investments. As we mentioned earlier, we have started to see sprouts of individual company performances beginning to decouple from the volatility of the markets, an encouraging sign which gives us good confidence for the rest of 2023. Additionally, while the last three years have seen a departure from our usual transaction-based exits, we are also starting to see “non-bubble” M&A activity back in the capital markets. We have not seen substantial reasons to exit our positions as most of our theses are still playing out, however, we look forward to recycling our expected gains into new opportunities on our growing watchlist. As our opening quote shows the market has carried out the sentences on our holdings before any reading of the verdicts, but as the verdicts continue to come in we anticipate those sentences to be “reversed on appeal”.
Portfolio Review
Currency Exchange International ( CURN ) – 23% of Portfolio; $8.08 cost basis/$19.30 current price
CURN continued to be our best performer in 2022 notching up a ~56% return in the face of volatile underperforming markets, and up another 18% in 2023. Last year we wrote to you about our forward estimates for this company:
“ We believe by 2024-2025 time period, with the return of the Banknote revenues to higher than pre Covid levels of $40-45mm and continued growth in Payments revenues to $15mm to $25mm, the company can achieve a revenue run rate of between $60mm to $70mm. While we don’t expect the cost base to stay at $30mm, as we mentioned this is a substantial operating leverage opportunity and we expect this $60mm market cap/$10mm Enterprise Value company to generate $15-$20mm in Free Cash Flow within the next 24 to 36 months”
We are excited to share with you, that while we expected these results a few years out the company was able to achieve 117% revenue growth in 2022 to $66mm, which is close to 60% over its 2019, pre-Covid, peak. How did we get there? The biggest surprise for us came in the strong performance of its Banknotes segment growing 136% to $53.9mm. In the past, this was a sleepy segment, managing non-airport-based 30+ foreign exchange kiosks in the US and Canada and generating $42mm in revenue in 2019. With the Covid-related North American bankruptcy exit of its biggest competitor, TravelX, CURN was able to slowly take over airport locations as a franchisor, i.e. no capital commitments; helped by the return of travel as well as general inflation both in exchange spread and average transaction size. We believe these dynamics as well as a near monopoly in North America, and room for branch expansion will continue to fuel double-digit growth for the retail portion of the Banknotes segment in the intermediate future.
The other portion of the Banknotes segment is the wholesale portion which was mostly nonexistent in 2019. However, in the last two years, the company has been approved by the Federal Reserve under its Foreign Bank International Cash Services (FBICS) program, after a lengthy due diligence process, and is now one of two companies in the US that can provide international banks with US currency. In other words, if you are say UBS and you need $25mm of US currency CURN will happily provide this service. This business likely provided mid-single digit millions in revenue in 2022, up from zero in 2019, and we believe can reach tens of millions of dollars in revenue in the intermediate future. The more interesting question one has to ask is if CURN is balance sheet constrained i.e., will it need more capital to grow this business? While there are transactions in the $50mm to $100mm size, which requires a bigger balance sheet than CURN currently has, those are few and far between and most ticket sizes are in the low tens of millions. In other words, CURN can continue to grow this segment without substantial capital additions other than natural working capital growth.
In the Payments segment, also nonexistent in 2019, the company grew 61% to $12.5mm as it continued to grow its Canadian and US existing relationships. The company’s proprietary software CXIFX helped grow transaction volumes by 38% and transaction amount by 47% in 2022, with more profitable transactions in the last year driving revenue growth ahead of volume.
One of the things we have talked about substantially in our letters in the past is our fondness for finding a business with substantial operating leverage, i.e. where revenue growth is substantially ahead of expense growth. CURN is a prime example of this strategy as it grew its revenues by $35mm in 2022, while expenses grew by only $17mm resulting in a 50%+ contribution margin and ~ $19mm in operating profit. Pretty remarkable that this company has been able to achieve these numbers two years ahead of our original projections. So where do we go from here? We believe that in the intermediate future, the company can continue to grow revenues at 20%+ growth rates with the resulting growth in profits at 30%+. This is a well-run company, with a well-respected and incentivized founder CEO, a new experienced CFO, and a $100mm+ market cap which should earn over $25mm in operating income in 2023. More recently CURN’s direct, private equity owned competitor, Moneycorp was put up for sale by its ownership with asking multiples at 12-13x EBITDA (note, we are using operating income as our valuation basis). If this transaction is successful we expect this $120mm market cap company, with approximately $40mm in excess cash (and over $80mm in total cash), to re-rate in the $40 to $50 per share range. However, we continue to monitor the company’s capital allocation plans as we believe its conservatism and lack of a clear plan, other than potential acquisitions, may hinder its near-term stock price appreciation. To that end, we have engaged in substantial friendly discussions with management on the company’s capital allocation plans and shareholder communication.
Research Solutions ( RSSS ) – 15% of Portfolio; $1.80 cost basis/$2.32 current price
Our investment in Research Solutions, originally at sub $1.00 in 2017, though with substantial additions over the years, our cost basis has drifted higher, was down 22% in 2022, up 21% in 2023, and down about 5% since year-end 2021. While the stock swings were volatile the results continued to be steady and on forecast. The provider of information services for the scientific industry, not unlike Bloomberg is for finance and Lexus Nexus is for law, grew its 2022 revenues by 7.9% and what we believe to be the more important metric, its gross profit, over 20%. This is not by accident and is something we are very excited about.
As a reminder, Research Solutions has a legacy Transactions business, the sale of scientific articles to over 1,200 customers, including 70% of the top 25 pharma companies. This business has been a steady $26mm to $27mm revenue generator for as long as we’ve been shareholders and with its 23%-24% gross margins has been a consistent provider of $6.0 to $6.5mm in gross profit. There have been concerns that this business has been cannibalized by the Platforms segment and a few worrisome negative revenue growth quarters were offset by 6.9% and 5.4% growth in the final quarters of 2022. The two main points about this business are that it has been a nice source of funding for growth of Platforms and that its large revenue base’s 0-1% growth rate has masked the growth of the more important segment.
Platforms, a SaaS solution to the scientific research community, which has an average price of $11,100 grew its revenues 32.5% to $7.8mm (and Annual Recurring Revenues i.e. ARR to $8.8mm) which as we can see, despite an impressive growth rate, is dwarfed by its Transactions counterpart. However, in a complete flip of the margins, Platforms gross margins are 88% and its gross profit, at $6.9mm is now bigger than Transactions and represents 55% of total Gross Profit of over $13mm. This was due to a 22% growth in subscriptions to 790 and a 5% increase in average sales price. The company had a busy year in 2022, including revamping its sales and marketing teams which we expect big things from in 2023. While we had hoped the market would take notice of this company earlier we believe the combination of higher growing Platforms revenues beginning to be a bigger part of the company’s revenue base (growing 10.7% combined in the 4 th calendar quarter of 2022) and crossing the somewhat arbitrary but important $10mm ARR mark in 2023 will finally put this $70mm market cap gem on the radar of more managers.
The company has close to $12mm in cash on its balance sheet and is currently in the process of looking for complimentary acquisitions. In the fall of 2022, the company acquired approximately 400 active customers from FIZ Karlsruhe's AutoDoc for a de minimis price which we expect will finally boost Transactions’ revenue growth and present substantial Platforms cross-selling opportunities. With private market valuations on the decline, we expect a meaningful Platforms ARR boosting transaction in 2023 which should assist the CEO’s goal of $20mm ARR in 24 months. We have not seen any reason to change our price targets as our near-term price target for the company is close to $5.00 with a three-year price target at $10.00+ as the company ARR continues to expand and it begins to generate double-digit millions operating profitability which tend to have 20-30x comparable multiples among comparable companies.
Acorn Energy ( ACFN ) – 8% of Portfolio; $0.30 cost basis/$0.32 current price
Acorn’s price performance, down 45% in 2022, and down another 9% in 2023, has certainly been disappointing but not out of the realm of normality of the nanocap world, where even $10,000 worth of volume can push the price of this $13mm market cap company up or down 15%. 2022 was a transitionary year for the company whose main business is providing monitoring services for back up electrical generators in the United States. This is a nice, very high margin, recurring revenue business with a nice $4mm base at close to 90% gross margins. The other half of the $8mm+ cash revenues is the sale of hardware, which results in an increase in the monitoring revenue base.
On the one hand 2022 was a disappointing year in that the sunsetting of 3G technology by major telecom carriers has resulted in low single digit decline of the Monitoring segment revenue, which usually grows at close to 20%, as customers just chose not to go through the hassle of installing new hardware. We believe that this is a unique, one time, occurrence which has passed starting in the 4 th quarter of 2022 and with high teens growth rates in Hardware not abating despite a domestic industrial slowdown we are confident that the company will revert back to its 20% growth in 2023 from approximately 5% cash revenue growth in 2022.
On the other hand, 2022 saw a signing of a transformational agreement with CPower Energy Management to use Acorn’s Omnimetrix software in the customer’s backup generators as a source of energy by power companies in times of peak demand. This deal should allow the customer, dealer, CPower, and Omnimetrix to share in both the standby and energy usage payments by the power companies. While this isn’t an overnight magic bullet, we believe over time this deal should double to triple the Average Revenue Per Unit (ARPU) Omnimetrix receives from its 30,000+ customers from $100+ to potentially as much as $300 and should drive an increase in hardware sales as this obviously makes owning a backup generator as a lucrative proposition for any future customer. Aside from 2022, the company has been a consistent 20% CAGR revenue grower and we believe, much like the Research Solutions Platforms segment, once the company passes the $10mm revenue mark it should be on the radar of more managers. The Omnimetrix CPower opportunity can drive the company’s Monitoring revenue base to $12mm and hardware to $10mm within 3 to 5 years where the company may be able to generate over $10mm of stable growing Free Cash Flow and have a market cap of $100mm to $200mm from $13mm today. While the company has had consistent growth and achieved profitability since we have owned it, the stock price has been disappointing. We have engaged management in serious discussions about steps the company can take to boost its stock price, including encouraging a potential transaction that would better reflect its fundamental value.
Gaia ( GAIA ) – 4% of Portfolio; $6.50 cost basis/$3.00 current price
Gaia was our most significant Core Portfolio underperformer for 2022, down 70% in 2022, up 30% in 2023, and down 64% since the end of 2021. To say that this was a disappointment would be an understatement especially since we consider the company to be in good financial shape. While the growth has slowed down significantly in 2022, to around 7% for trailing twelve months revenues to $83mm, the company was able to maintain its profitability at over 20% EBITDA margins. 2022 was a tough year for most streaming services with Netflix falling 55% around the same period as most investors questioned the sustainability of streaming content models and the massive content spend by Gaia’s competitors. We believe Gaia has settled into a more mature growth stage at ~800,000 subscribers with a focus on the growth of profitable, low disconnect subscribers and has shifted its focus more on cheap content acquisition through the wreckage of streaming start-up failures in 2022.
While we expected 2022 to be a low growth year, nevertheless we are still very disappointed in the stock performance and the slowdown in fundamentals, leading us to begin to question management’s commitment to shareholder value creation. We have held this company’s stock for almost eight years and while it is still a profitable investment given our realized gains in the past we are monitoring this investment with clear eyes and potentially taking the realized losses and deploying the capital elsewhere in 2023.
HireQuest ( HQI ) – 21% of Portfolio; $5.50 cost basis/$22.50 current price
HireQuest continues to be one of our more consistent winners in the portfolio. While the stock was down 20% in 2022, mostly via a rough, negative 12% December 2022, the stock is up over 40% in 2023 and is up 12% since year-end 2021. The company continued to fire on all cylinders in 2022 with revenues up 73% for the trailing twelve months that ended on September 30 th , 2022, and 67% for nine months of 2022. More importantly its Franchise Royalties, which account for most of its profit, increased almost 40% for those nine months with 32% organic growth. During that same period, gross profit grew by 50% and EBITDA over 87% continuing to show the operating leverage inherent in its business model.
As a reminder Hirequest, a now $300mm market cap company, is a consolidator in the staffing industry, acquiring $34mm worth of businesses in 2021 and $15mm in the first nine months of 2022. Led by its impressive CEO Rick Hermans, the company buys owned locations, sells them via franchise agreements to the branch managers, and collects an approximately 6% franchise fee of the subsequent revenues. This model has been incredibly successful due to providing the right entrepreneurial incentives to hereto salaried branch managers that now have an opportunity to earn six-figure incomes. Though of course a 3.4% unemployment rate and a tight labor market surely help drive system-wide sales to a $500mm run rate. This is why we believe in November 2022 when the company announced a $13.5mm dollar acquisition of MRINetwork, the third-largest executive recruiting network in the world, the market mistook it as another small tuck-in acquisition. At first glance, the target company generated $1.9mm in EBITDA so a 6.5x multiple seemed like a normal run-of-the-mill price which should contribute to 2023 earnings. However, what is hidden behind the $1.9mm EBITDA number is that MRINetwork has 232 office locations and a close to $300mm systemwide sales run rate or less than a 1% operating margin. If the past is anything to go by, this acquisition can generate up to $18mm in 100% gross profit revenue in 2023, on top of the current $30mm franchise royalty run rate. We are salivating at the potential for this acquisition’s profitability as we expect a substantial marginal contribution to our pre-acquisition operating income/EBITDA estimates of $22mm/$29mm in 2023.
As we mentioned earlier, while we are contrarians on the path of inflation and interest rates, we are also contrarians on the path of economic growth in the United States and believe that the resilience of the domestic economy can continue to produce low unemployment rates, relative to historical averages, for at least a few more years. As such we expect continued strong organic growth and acquisition opportunities to grow the company’s EBITDA to over $50mm toward the end of 2024 where an 8x to 10x multiple, which we believe is appropriate given the franchise economics of this business model should result in a near term price target of $36.00. Of course we intend to continue holding this investment, other than risk management adjustments, until Rick Hermans eventually sells the company.
Shyft Group ( SHYF ) – 9.0% of Portfolio; $9.50 cost basis/$32.00 current price
Shyft Group was down 50% in 2022, up 30% in 2023, and down 30% since year-end 2021. Our investment in Shyft Group (formerly Spartan Motors) while disappointing on the stock performance in 2022, is still one of our most impressive fundamental stories that we’ve invested in. Despite the gloom and doom of the never arriving recession, the company grew its revenues by 14% to over $1 billion for the trailing twelve months that ended September 30 th , 2022 as well as its last reported backlog to ~$1.1b, a 23% growth rate. These are impressive numbers for sure, however, for 2022 the company announced a $30mm Research and Development investment into the development of an electric vehicle commercial truck, BlueArc. This one-time investment brought down reported EBITDA numbers from $95mm in 2021 to a likely $75mm number in 2022 (of course on an apples-to-apples basis it is a $105mm number, if those costs were to be capitalized) and the short term results-oriented market was not a fan.
We are not complaining as the BlueArc truck is incredible. Unlike many of its electrical vehicle start-up competitors that have little to no experience in manufacturing and just have pretty renderings to hype up their stock, Shyft Group has extensive experience in building and scaling prototypes having built dozens of new models over the years and in September 2022 announced a substantial 2,000 truck order which they expect will be close to 3,000 by 2025. The company’s Fleet Vehicle and Services segment whose average truck body order is around $30,000 to $40,000 per, expects that each Blue Arc truck will bring in over 4x those amounts at over $150,000. In other words, they expect this to be a $500mm revenue contributor at 12% margins within a few years. While most companies with such bluster can and should be taken with a grain of salt, our long experience with Shyft Group and its management team has shown them to be anything but boastful and they tend to err on the conservative side of their estimates.
We continue to look past the short term, especially with this company, which has proven to be a consistent grower through short-term economic challenges. We expect its sales growth, excluding the BlueArc segment, to trend in the 15-20% range on the back of continued demand for last-mile delivery vehicles driven by growth in e-commerce. Including the Blue Arc segment and additional tuck-in acquisitions should lead the Shyft Group to generate over $2 billion in revenues and close to $250mm in EBITDA by 2025-2026. We do not expect this company to stay public forever and at those levels is where we expect the company’s impressive CEO Daryl Adams to sell the company at its historical trading averages of 10x EBITDA or around $75 per share.
Northern Technologies ( NTIC ) – 6% of Portfolio; $8.80 cost basis/$13.00 current price
Northern Technologies was down 13% in 2022, and flat in 2023 thus far. This is our most cyclical investment and we’ve made a small reduction to our holdings in 2022. However, the specialty chemical manufacturer of rust prevention and bioplastic chemicals with a global network of joint ventures was able to grow its revenues by over 32% in 2022 and 13% on an organic basis. These headline numbers are somewhat misleading as the company’s worldwide system revenues only had ~1% growth in 2022, mostly due to the China Covid-related lockdowns, and a big part of the difference was reclassifying the India joint venture as a consolidated company segment.
The company tends to be on an offset reporting its fiscal year, which ends in August, versus a calendar year so more recently it reported its 1 st fiscal quarter results ended November 30 th , 2022, which showed stable demand across its Zerust industrial products, with substantial growth in its Zerust Oil & Gas products and NaturTec bioplastics product line for a 10% topline revenue growth. The China joint venture revenues were down 10% resulting in a similar reduction in overall joint venture income. We continue to view NTIC as an opportunity to invest in a stable, long-term Zerust business, with substantial optionality on the growth of the bioplastics NatureTec product line which has an $18mm-20mm revenue run rate, which was nonexistent a few years ago. This is not unlike our thesis for Research Solutions and Currency Exchange International where a stable legacy business with good growth underpins a high-growth new product segment that is under appreciated by the markets. We expect NTIC, at a ~$120mm market cap ($13 per share) and ~$100mm Enterprise Value ($11 per share) to generate over $15mm in operating income/$1.50 per share in EPS by year-end 2024, while growing through temporary economic headwinds which subdue system-wide revenue growth to low double digits versus the 20%+ longer-term expectations we have for the company. We have a near-term expectation of a $20 per share price target, which we continue to reassess on an ongoing basis.
Potbelly ( PBPB ) – 8% of Portfolio; $3.70 cost basis/$7.60 current price
Potbelly was flat in 2022 staying around the $5.60 price for most of the year, however, as the company pre-announced its 4 th quarter 2022 results ahead of guidance in early January, the stock has surged close to 40% in 2023. Our investment in PBPB was originally a post-Covid recovery special situation with a substantial opportunity to change its business model from one of managing 400 specialty sandwich shop locations to one managing 2000+ franchises as the company hired a former Wendy’s COO, Robert Wright, to execute on the strategy.
We are pretty excited to report that our thesis so far is playing out just as we had hoped. For 2022 the company’s same-store sales are expected to come in at 18.5%, ahead of the 16-18% range provided by the company a year ago. Additionally, shop-level margins are expected to be 10.4%, ahead of the 10% forecasted range. The overall 2022 revenues should be above $450mm or 54% higher than year-end 2020 showing a substantial rebound from the uncertain times during the pandemic. While 20% growth rates will be harder to come by going forward we believe with the franchising strategy discussed in the next paragraph, inflation sticking around for longer than expected and growth in volume should result in high single-digit/low double-digit revenue growth for the next few years, as well as hitting the 16% shop level margins goal, resulting in $50mm in EBITDA by year-end 2024/mid-2025 and using comparable teens multiples can result in a $20+ price target. This does not take into account the substantial optionality on the success of the re-franchising strategy.
The company currently has 429 locations including 45 franchises or about 10%. The near-term goal is for the current base to be at 25% franchised meaning there are approximately 60 currently owned locations that can be sold to franchisees at what we believe can be $500k to $1.5mm per location resulting $30mm to $90mm in cash inflow to this $215mm market cap company. Additionally, the company has a goal to grow to 2,000 shops, growing franchised locations at about 10% per year. To that end, the company has signed Shop Development Area Agreements for 51 future locations (which may take up to 7 years to open) in 2022. We believe this pillar of the company’s strategy to be the most important one, and the key to our thesis as we believe it may add $10 to $50 more per share to the value of the company in addition to its ongoing business valuation. So far the strategy continues to be on track and we’re excited to be along for the ride.
Polished.com 6/26 $2.25 Warrants (POL-WS) – 3.5% of Portfolio; $0.42 cost basis/$0.10 current price
On the one hand, this investment has been a disaster, of the kind we try to avoid. In 2022 the company hasn’t been able to publish its financial statements due to what can only be called shenanigans by its founder and now former CEO, Albert Fouerti, where he charged the company over $800,000 in personal expenses. In his dismissal and at the conclusion of the investigation he agreed to reimburse the company $3.7mm for the expenses and the cost of the investigation. Sadly, while this doesn’t look great, these are typical inexperienced behaviors of microcap management teams that frankly do not know how to transition from private to public company executives. This is not unlike the situation with our former holding USA Technologies (USAT), now Cantaloupe ( CTLP ), where its CEO ran the company like a personal fiefdom with a pliant CFO and board, which resulted in his firing, financial statement restatements and an eventual activist battle resulting in a new management team and board. A good business ran by inexperienced management. As a fun reminder, the USAT CEO Stephen Herbert, prior to his firing, once chased your portfolio manager down the hall of a conference to scream about embarrassing him on a public webcast when we asked about an unnecessary and dilutive secondary offering.
To add insult to injury while the company has communicated the investigation findings, hiring of the new auditor, and even broad strokes of its subdued financial guidance, it has refused to provide its net cash position, resulting in consistent worries by the market about its debt levels. For what its worth, we estimate that the company likely has $40mm in cash and a $100mm term loan, or approximately $60mm in net debt today. Of course this number can be off by $10mm to $20mm. And so in 2022 the stock dropped from around $1.50 trading levels to a low of $0.50, and the warrants dropped to around $0.10 costing us 600 to 700 basis points in performance.
This all seems bad. And yet despite the disappointment, we are actually a bit excited. In late January 2023, the company seems to have gotten the message from its ((very)) angry shareholders: sell the company.
While the shareholders approved a new board, they refused to approve an increase in issuable shares from 200mm to 250mm, where there are currently 105mm outstanding and 92mm warrants, which count against the cap. The intention of the vote was to allow the board to issue more options to attract new management, while the shareholders sent a message that it is time for Polished.com to end its short-lived run as a publicly traded company. So the company announced that after receiving “multiple expressions of interest” it has hired the Jeffreys investment bank to help manage the process. Positive news in a sea of disappointment and distrust.
Of course, everything is not as easy or as simply predictable as a sale of a company with unpublished financials amid an economic slowdown with a strained consumer. What is POL worth today? What are our warrants worth? This is an e-commerce company that can generate $500mm to $600mm in revenue and $30mm to $50mm in profitability, providing its working capital levels are no longer underfunded. This can result in offers of $200mm to $600mm, where possibly up to $100mm would go toward paying back the term loan. What happens with the warrants that have 3.5 years left and a $2.25 strike price if the offer is below the strike price?
These are all questions we’ve spent the last few weeks trying to answer. We’ve come away positive with at least one portion of the situation: our warrant holder rights. Much like our US Ecology warrants which were bought out by Republic Management in 2022, the POL warrants in any fundamental transaction are required to be converted into the warrants for the equity of the new owner. This is great and easy if the acquirer is a public company and this is a strategic acquisition for someone fetching a higher price, but it is likely to be a private equity company. In fact, we wouldn’t be surprised if the former CEO comes back with a private equity backing to buy the company back. This would obviously be a concern. However, since the warrants are unlikely to be converted into new equity, they will have to be bought out, even if the final sale price is below exercise price. The next concern that comes: at what value? While the company’s filings on the warrant agent agreement tend to be poorly written at best, it seems likely that they would be bought out at “fair value” which tend to have varying ranges due to the volatility input into the Black Sholes formula. We have a strong concern that that is the part where there may big differences between the warrant holders assessment of fair value and the company’s acquirer. So in the end we believe that these warrants maybe worth as little as $0.40, around our new cost average as we’ve added some more recently, but up from $0.10 today, to well over $2.00 if the business is in good shape. The real downside is of course that they stay at the $0.10 level for a long time if no deal is consummated, and we lose a little on liquidation, another realistic risk. For what it is worth, we have communicated our concerns and reminded management of warrant holder rights in a private letter. We are mostly excited that the end of this saga is near and look forward to updating you soon.
Portfolio Sales
In 2022 we’ve exited our position in US Ecology warrants due to a buyout and sold our leftover de minimis holdings of Flotek and Societal CDMO. We anticipate some sales in 2023.
Partnership Updates
We welcomed two new partners to the partnership this year and lost two bringing our total to 43 at the end of December. As we are not having an in-person partnership event in 2022 we will end up having a virtual portfolio update presentation in summer of 2023. Please be on the lookout for an invitation in your email inboxes sometime in the next few months. Despite the current economic challenges, we are excited about the continued growth in partners and recovery in assets under management and, as always, are thankful for your business.
Next Fund Opening
Our next partnership openings will be March 1 and April 1, 2023. Please reach out for updated offering documents and presentations at info@artkocapital.com or 415.531.2699.
Legal DisclosureThe Partnership’s performance is based on operations during a period of general market growth and extraordinary market volatility during part of the period, and is not necessarily indicative of results the Partnership may achieve in the future. In addition, the results are based on the periods as a whole, but results for individual months or quarters within each period have been more favorable or less favorable than the average, as the case may be. The foregoing data have been prepared by the General Partner and have not been compiled, reviewed or audited by an independent accountant and non-year end results are subject to adjustment. The results portrayed are for an investor since inception in the Partnership and the results reflect the reinvestment of dividends and other earnings and the deduction of costs, the management fees charged to the Partnership and a pro forma reduction of the General Partner’s special profit allocation, if applicable. The General Partner believes that the comparison of Partnership performance to any single market index is inappropriate. The Partnership’s portfolio may contain options and other derivative securities, fixed income investments, may include short sales of securities and margin trading and is not as diversified as the indices, shown. The Standard & Poor's 500 Index contains 500 industrial, transportation, utility and financial companies and is generally representative of the large capitalization US stock market. The Russell 2000 Index is comprised of the smallest 2000 companies in the Russell 3000 Index and is generally representative of the small capitalization U.S. stock market. The Russell Microcap Index is comprised of the smallest 1,000 securities in the Russell 2000 Index plus the next 1,000 securities (traded on national exchanges). The Russell Microcap is generally representative of the microcap segment of the U.S. stock market. All of the indices are unmanaged, market weighted and reflect the reinvestment of dividends. Due to the differences among the Partnership’s portfolio and the performance of the equity market indices shown above, however, the General Partner cautions potential investors that no such index is directly comparable to the investment strategy of the Partnership. While the General Partner believes that to date the Partnership has been managed with an investment philosophy and methodology similar to that described in the Partnership’s Offering Circular and to that which will be used to manage the Partnership in the future, future investments will be made under different economic conditions and in different securities. Further, the performance discussed herein does not reflect the General Partner’s performance in all different economic cycles. It should not be assumed that investors will experience returns in the future, if any, comparable to those discussed above. The information given above is historic and should not be taken as any indication of future performance. It should not be assumed that recommendations made in the future will be profitable, or will equal, the performance of the securities discussed in this material. Upon request, the General Partner will provide to you a list of all the recommendations made by it within the past year. This document is not intended as and does not constitute an offer to sell any securities to any person or a solicitation of any person of any offer to purchase any securities. Such an offer or solicitation can only be made by the confidential Offering Circular of the Partnership. This information omits most of the information material to a decision whether to invest in the Partnership. No person should rely on any information in this document, but should rely exclusively on the Offering Circular in considering whether to invest in the Partnership. |
Editor's Note: The summary bullets for this article were chosen by Seeking Alpha editors.
For further details see:
Artko Capital Q4 2022 Partner Letter