SND - As Depletion Catches Up To U.S. Shale Here Are 3 Things To Consider Before Buying Oil Stocks
2023-07-06 18:50:29 ET
Summary
- There is increasing evidence that the Permian Basin may peak soon; peak productivity per foot drilled may already be behind us.
- Analysts aren't paying enough attention to the paradigm shift that will ensue once this realization becomes mainstream.
- Although industry insiders will likely still make a lot of money in shale, most retail investors may want to consider repositioning their energy portfolio toward offshore and services plays.
Is the U.S. shale boom finally over?
Betting on 'peak shale' is a risky proposition because production has defied expectations before and the shale industry has proven it can do more with less after the 2014 bust. However, shale remains a finite resource so it is not illogical that at some point the productivity gains would reverse.
Well-level data may offer a clue
While it is probably accepted that more mature basins like the Bakken and Eagle Ford have already peaked, much hope is put into continued growth from the Permian. Yet, new and more granular well-level data suggests that even Permian productivity may have already rolled over, especially if normalized for lateral well length.
For example, just last week the research shop of Goehring & Rozencwajg (G&R) released a note that supports the 'peak Permian' thesis , based on analysis of well-level data from NoviLabs (formerly, ShaleProfile):
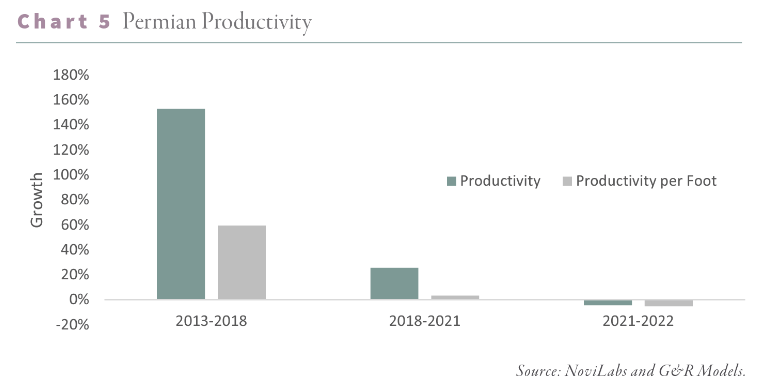
Based upon our original work back in 2018, we concluded the Permian would roll over once operators drilled most of their best Tier 1 locations. Before peaking, per-well productivity would fall as operators drilled lower-quality inventory. This is what has happened. For the first time, productivity per lateral foot registered a 6% year-on-year decline in the Permian. According to our models, this proves the industry has drilled its best wells; basin-wide production decline is likely not far behind. With the Eagle Ford and Bakken unable to grow over the last eighteen months, once the Permian rolls over, the shale revolution will shift from growth to decline, and Hubbert’s Peak will reemerge with a vengeance.
Yet analysts aren't paying attention
'Peak Permian' would be such a game changer for the industry that I am puzzled why Wall Street analysts don't pay more attention to the possibility. If you survey a sample of E&P earnings calls, you'll notice most questions target near-term events such as next year's capex, working capital or whatnot. The elephant in the room, shale producers' remaining inventory runway, is rarely questioned.
So with this article I hope to accomplish two goals. First, I will discuss some data from G&R and other sources on the peak Permian/peak shale arguments. Then, I will try and offer some second-order thinking into what all this means for the energy space and address three key investment strategy takeaways.
Well productivity may have already peaked
The G&R charts suggest declining productivity since last year:
After the stellar 2013-2018, when shale had to adapt to lower prices, the 2018-2021 years showed slowing productivity growth which, if normalized for lateral length (productivity per foot drilled) is basically zero. For 2021-2022, both the absolute and normalized productivity measures are down.
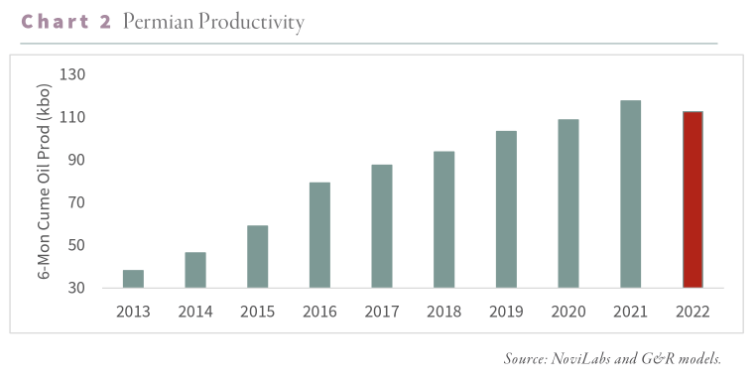
The productivity peak may have been in 2021:
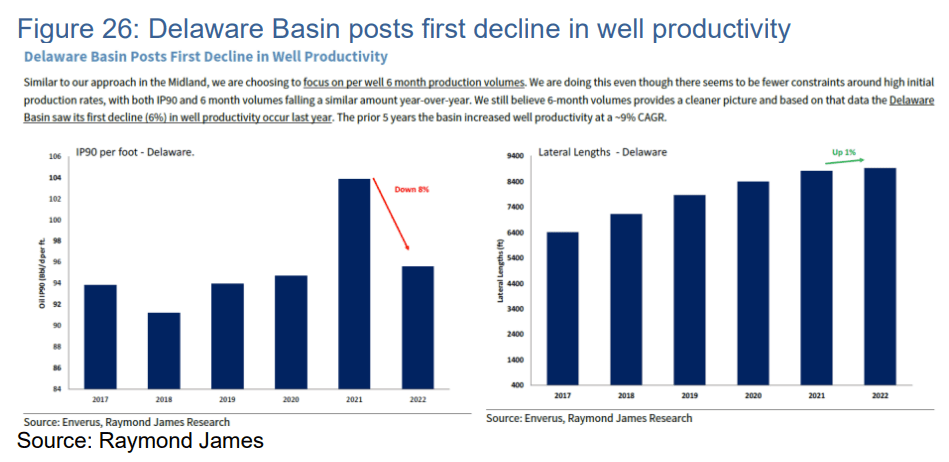
Other observers have reached similar conclusions. The Energy Tidbits newsletter discusses a study by Raymond James that concluded productivity per foot in the Delaware part of the Permian peaked in 2021:
Production trails productivity
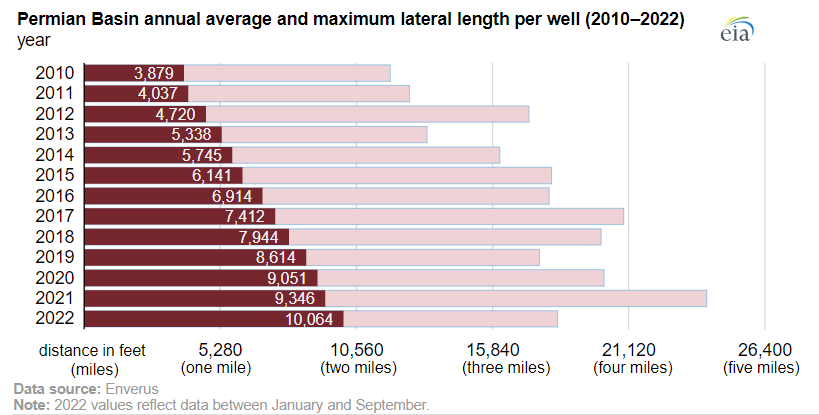
Total production can grow even with declining well productivity but you need to drill more wells which costs more. Well productivity itself can also grow with declining normalized productivity per foot. However, you need to keep drilling longer laterals which also costs more. Right now, the industry is doing precisely that :
E&P companies aren't necessarily increasing the number of wells, but wells are getting longer while production stays flat or at best grows modestly.
In investor presentations, increasing lateral length is presented as a positive; but is it? If you buy into the G&R or Raymond James studies, it may be just a manifestation of diminishing marginal returns. If productivity per foot has already rolled over, it is only a matter of time until total productivity follows, and, once that happens, total production from the basin is bound to peak too.
What if the 2013-2018 growth boom was just due to prioritizing top-tier inventory?
A valuable concept I learned from my statistics teacher is 'self-selection bias.' This happens when you look at a sample of data and make an inference about the entire population, thinking that your sample is representative. However, in the economics world the sample is frequently the result of someone else's strategic, profit-maximizing choices and isn't really representative. This can drive the wrong conclusions.
In this case, the self-selection may have been E&P operators prioritizing their best inventory to survive the lean years. Analysts assume that the wells drilled in any given year are a random sample of all drilling inventory available and record productivity gains year-on-year. These shale productivity gains have then been attributed to technology advancements and operational efficiencies. But if operators started cannibalizing their best locations, these productivity gains may have been illusory.
G&R think that 2/3 of the gains are attributable to inventory selection:
Instead of improved drilling techniques, we concluded that two-thirds of the improved productivity between 2013-2018 came from favoring the best drilling locations. In 2013, 22% of Midland wells were Tier 1. By 2018, Tier 1 represented 50% of all wells. Since a Tier 1 well is nearly twice as productive as a Tier 2 well, the migration from lower to higher quality areas drove a massive amount of the improved well productivity.
If inventory selection and not technology was behind the 2013-2018 boom, things are quite bad because productivity will reverse by design. When you pick up the low-hanging fruit first, you are bound to end up with high-hanging fruit only.
The EIA's Drilling Productivity Report also shows decreasing productivity in all three oil basins.
The Bakken:
EIA
Eagle Ford:
EIA
The Permian:
EIA
It is now widely accepted that the apparent productivity spike in 2020-2021 was also due to companies cannibalizing their DUC (drilled but uncompleted) well inventory. Completing an already drilled well is cheaper, so operators maintained production using their DUCs while deferring new drilling. Think of it as a manufacturing company depleting all of its raw materials inventory while holding off on procuring more. Temporarily, the manufacturer will increase its profits, but once it runs out of raw materials it has to procure more or shut down the business.
The Dallas Fed has shown that the DUC problem is worse in the Permian than elsewhere:
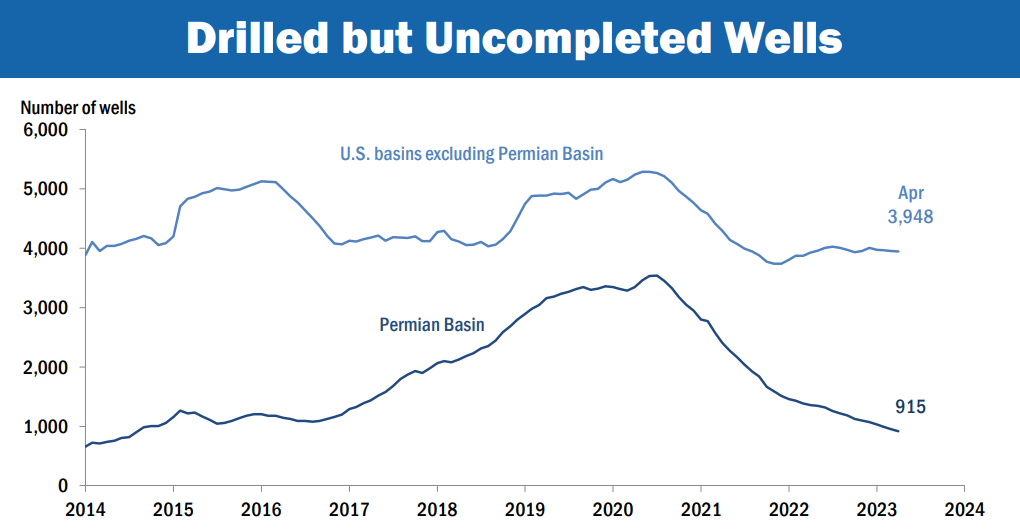
The Energy Tidbits newsletter wonders how the Permian can sustain its production with such a low work-in-progress inventory of DUCs:
We have trouble seeing how the math works for sustained Permian oil growth in the 2020s based on the level of DUCs and oil rigs. Note that the EIA made significant upward revisions to the recent month’s Permian DUCs that basically reversed the surprise significant downward revisions in the May DPR. However, that still doesn’t make any real difference to the overall math problem. Permian DUCs are at the roughly the same levels as Aug/Sept 2014. Yet Permian rigs are 61% of Aug/Sept 2014, and production is 3.44 times higher than Aug/Sept 2014.
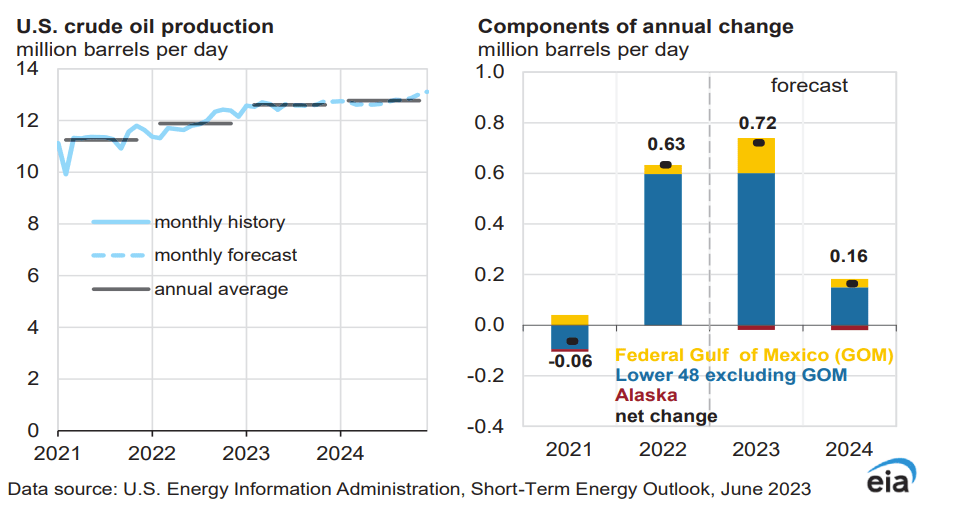
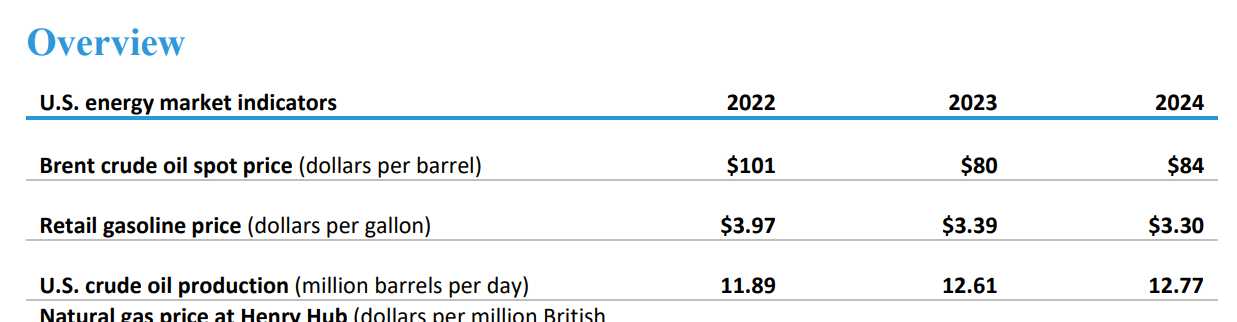
Paradoxically, while the EIA's own data shows the "math problem" Energy Tidbits is trying to wrap its head around, the government agency is confident U.S. production will rise to 12.77 million bbl/d (just a notch below the November 2019 high) with most growth coming precisely out of the Permian:
In the EIA's own words:
The changing response to crude oil prices by U.S. producers may reflect a combination of the use of capital to increase dividends and repurchase shares instead of investing in new production, the effects of tighter labor markets and higher costs, and increased pressure on oilfield supply chains. Despite this shift from the historical price response, we still expect U.S. crude oil production to continue growing to record levels, driven primarily by production growth in the Permian Basin.
I will let you make your own conclusions here. My guess is the EIA may have a giant general equilibrium model of the economy that solves for oil supply as an endogenous variable but probably doesn't do full justice to the physical constraints that can limit production.
Costs have likely bottomed
The G&R study and the others cited focus on the physical aspect of the peak (how many barrels can you get out), but if you also consider the cost aspect of the shale venture, I would argue we are well past the cost per unit bottom. Some inferences to this effect can be made using readily available data in the public space that doesn't require an expensive Enverus or NoviLabs subscription.
In particular, I reviewed the 2021-2022 capex and production plus 2023 guidance for 10 well-known large U.S. independent oil-focused producers. The 10 companies in the group include Apache ( APA ), Conoco ( COP ), Devon ( DVN ), Diamondback ( FANG ), EOG Resources ( EOG ), Hess ( HES ), Marathon Oil ( MRO ), Occidental ( OXY ), Ovintiv ( OVV ) and Pioneer ( PXD ). Together, this peer group turns out almost 4 million oil barrels per day, which is about 1/3 of total U.S. production and 4% of the global supply.
Flat capex isn't enough for flat production
I find that while the past couple of years the group has grown production by 4-5% (a lot of it through acquisitions), capex has increased by 47% from 2021 to 2022 and is expected to increase by another 24% in 2023. The capex per boe went up on average 40% in 2022 and is expected to go up another 18% this year:
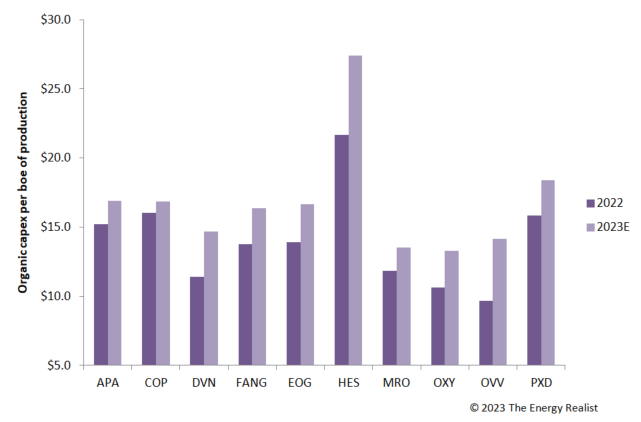
This comparison is admittedly a crude method and there are exceptions that make sense. For example, Hess is transforming itself from a shale company into an offshore producer in Guyana. So when Hess adds capex in 2023, that may contribute to barrels produced in 2027 and my simple ratio wouldn't capture this. However, for most of the group, U.S. shale is the bulk of their production and the capex-to-production cycle is much shorter. So it does indeed appear that shale operators must run faster to stay in the same place.
But what about services inflation?
The argument you often see on Seeking Alpha and elsewhere from oil bears is that the higher capex numbers more so reflect oilfield services cost inflation (higher prices for drilling rigs, frac fleets, drill pipe and others) but aren't really indicative of an increase in the physical volume of work done. Rising services cost is part of the equation, but as a whole the statement isn't true.
IHS, now S&P Commodity Insights, finds that services costs are expected to increase by 10% from 2022 to 2023. Given capex increases of 20% and up, the implication is that at best half of the capex increase can be explained away by inflation. Logically, the other half then is driven by the need to do more on the oilfield to get out the same number of barrels. These efforts wouldn't be necessary if productivity were still on the rise.
So when will shale peak?
The Eagle Ford likely peaked in 2015:
NoviLabs
From NoviLabs:
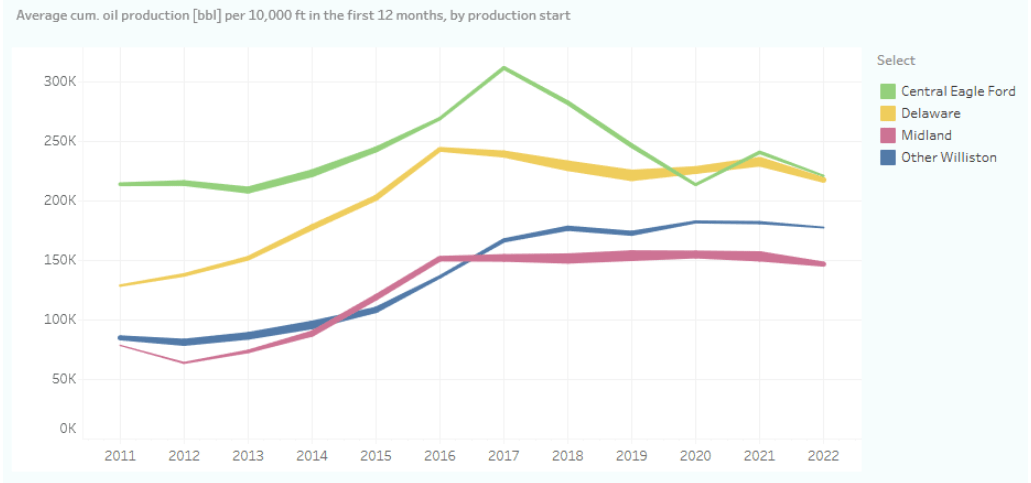
On a normalized basis (by lateral foot instead of by well) the Eagle Ford has seen the steepest decline in well productivity in recent years, and average well performance is now almost back where it was 10 years ago, despite a strong increase in proppant loadings (bottom chart) during that period.
Yikes.
The Bakken/North Dakota likely peaked in 2019:
NoviLabs
The Permian is still growing and is above its pre-pandemic peak:
NoviLabs
However, as discussed already, productivity has likely already rolled over. Here is another Novi Labs chart to this point:
G&R think the Permian peak may occur within the next 12 months although when exactly is not as relevant once the writing is on the wall:
Whether the Permian peaks next month or nine months from now is subject to more variability than any analyst can confidently predict. However, we know that geological depletion is clearly taking place and will likely get worse. Year-on-year growth in the Permian appears to have peaked at 656,000 b/d in February and is already down to 480,000 b/d year-on-year in May. While the data may be lumpy, we expect this slowdown to continue and believe we may not see any year-on-year growth by the end of next year.
The peak also depends on the demand side. If oil were to go to $300, producers could probably temporarily achieve higher production at whatever cost. So the key point isn't the peak's exact timing, but rather the fact that productivity has rolled over and the cost curve has started rising.
So what does it all mean?
Whether the nominal Permian peak is indeed in the next 12 months or later is less relevant. The productivity rollover and the reversal in the cost trend already places us in a new paradigm and I think investors need to consider three factors.
#1 More capex spent on oilfield services
Again, this is just math. If wells per foot are less productive, you need to drill more wells or longer laterals. Either way, it is going to cost more, and higher E&P costs mean more revenue for oilfield services companies ( OIH ).
One services company I track, Oil States International ( OIS ), referred to this as the rising "completion intensity" of U.S. shale in its investment materials:
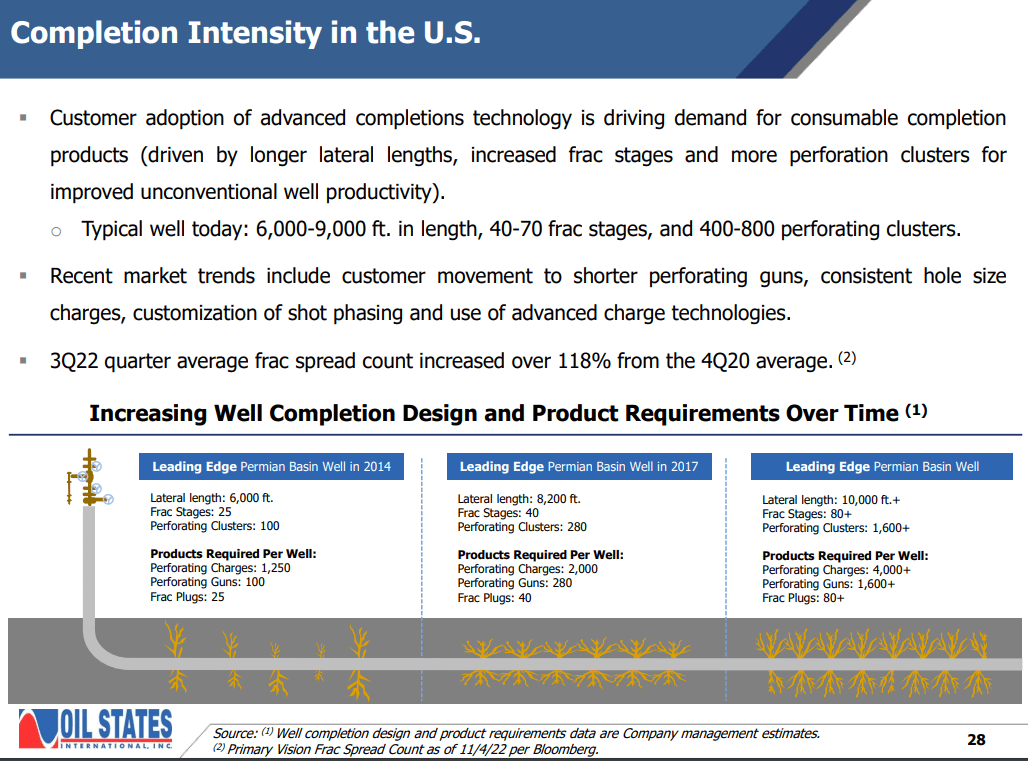
So with the shale cost curve on the rise again, you likely want to own some services companies. Here are some that I believe may do well:
Nabors Industries ( NBR ), provider of high-spec land drilling rigs;
ProPetro ( PUMP ), a completions company that offers fracking services;
Liberty Energy ( LBRT ), a competitor of ProPetro;
Smart Sand ( SND ), a supplier of frac sand.
The key features I look out for in the onshore services space are high-quality, modern equipment and relationships with the majors and large independent operators.
#2 Offshore becomes more attractive
The simplest and safest way to play 'Peak Permian' is just to focus on the offshore sector. This way you don't have to worry about the bargaining dynamics between shale operators and service providers. Less shale oil means more offshore drilling and this thesis is as straightforward as it gets. The icing on the cake is that capital offshore assets such as drilling rigs are currently in short supply and new assets can't be produced quickly due to shipyard backlogs. This puts additional premium on the companies that have functional assets, even if they aren't the newest.
Some of my picks here include:
Transocean ( RIG ), which now focuses solely on deepwater drilling;
Borr Drilling ( BORR ), which specializes in high-end shallow water jack-up rigs;
Schlumberger ( SLB ), the largest oilfield services company which is 50% exposed to offshore.
Offshore drilling prospects also have lower breakeven costs:
Diamond Offshore Presentation
While stock prices in this sector have gone up a lot, the recessionary pressure still allows good opportunities to jump on the offshore train.
#3 Differentiation and more alpha opportunities within shale
This is perhaps the most counter-intuitive implication of 'Peak Permian.' The average well is declining but there is a considerable spread in inventory quality around the average. So as the average drops, the few companies that still have decent inventory left will command a huge premium and their stock price may actually appreciate. As Warren Buffett said, only when the tide's gone, you see who's been swimming naked.
I think by now most people who pay attention to the industry realize that the average private operator is in much worse shape than the average public company. That is why private companies are more likely to drop rigs:
Evercore; WSJ
Within the public operators, there is also differentiation. By most accounts, Pioneer has the longest inventory runway and perhaps that's why Exxon ( XOM ) is rumored to have considered acquiring them:
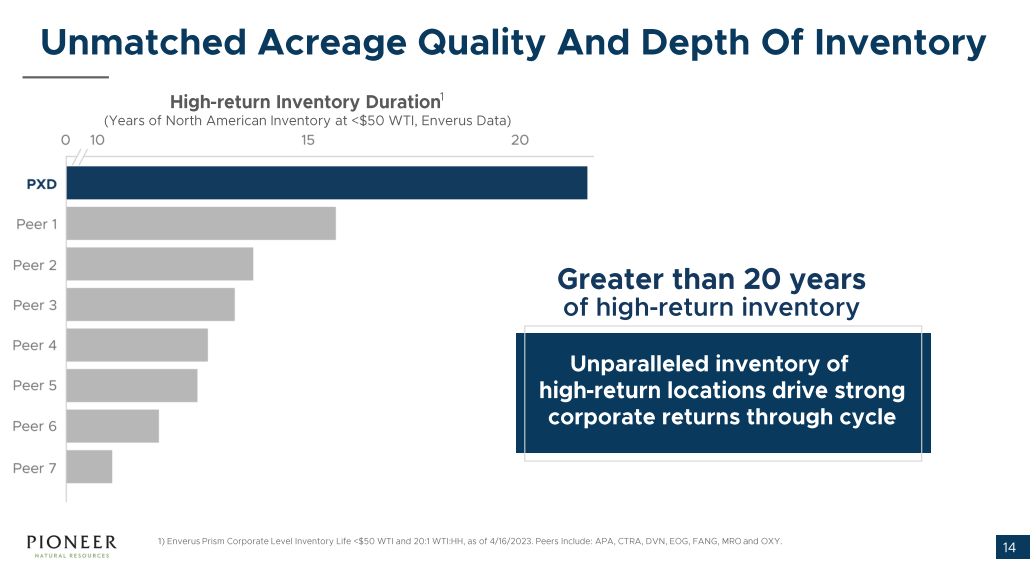
However, the market isn't that stupid and Pioneer costs more too. By my calculation, Pioneer's enterprise value is about $78,000 per flowing barrel of estimated 2023 production. On the other end of the spectrum you can get Ovintiv for EV/boe/d of $28,000. Ovintiv is "cheap" but is it?
A corollary of the new paradigm is also the jump in M&A activity. Supposedly, all shale acquisitions are 'accretive' and create synergies. But maybe operators are just getting desperate about running out of inventory. Even the WSJ identified the driver behind the recent wave of deals:
The shale industry has shifted from the rapid growth it pursued for more than a decade to a mature business underpinned by fiscal restraint and hefty investor payouts. But shale companies are contenting with dwindling drilling locations. Drilling for new oil discoveries has fallen out of favor with investors, leaving many companies with few options other than to acquire rivals to extend their runway.
From this perspective, an acquisition may even signal that the acquirer doesn't have confidence in its own inventory.
Lastly, the declining Permian productivity should ultimately boost oil prices. The 5 million bbl/d figure, equal to one half Saudi Arabia, can't be replaced by offshore overnight and maybe ever. So when headline production starts to disappoint, prices will have to rise to incentivize Permian operators to squeeze out the last drop of oil. Some high-cost producers that are still around then may see significant boost to their stock prices due the operating leverage effect. The challenge is that it's really hard to identify these future winners from the outside and assess the true quality of their inventory from public data. I still own a couple shale stocks, but they aren't my strongest convictions any longer.
Bottom line
When all is said and done, Hubbert, whose peak oil predictions were cast aside during the shale revolution, may end up having the last laugh. 'Peak Permian' will be a paradigm change for the energy industry and investors should position to ride the new trends. Although industry insiders will still make a lot of money in shale, for most retail investors the easier path may be to prioritize offshore and services.
For further details see:
As Depletion Catches Up To U.S. Shale, Here Are 3 Things To Consider Before Buying Oil Stocks