ISCF - Asset Class Mean Reversion: 2024 Review And Outlook
2024-01-15 01:06:19 ET
Summary
- Mean reversion has been observed in various asset classes since 2019, with opportunities for attractive returns in U.S. value, international, emerging markets, natural resources, MLPs, and gold.
- The large-cap growth sector has defied mean reversion, driven by the "Magnificent Seven."
- Foreign and emerging markets equities have continued to underperform the U.S., but there are signs of potential reversals in international value, international small cap, and emerging markets small cap.
- Valuation, historical cycles, and sentiment provide clues to what's ahead.
Since 2019, I’ve been tracking various asset classes, looking for mean reversion effects and associated investment opportunities. We’ll begin here by looking back at key findings from my 2019 Seeking Alpha editors’ pick Mean Reversion + Valuation = Portfolio Opportunities . Then we’ll explore how things have played out since, clues to future performance, and my top picks. Last January I provided an update with Asset Class Mean Reversion: Review and Outlook . Here’s the 2024 edition.
Some Asset Classes Looked Destitute in 2019 and Poised for Mean Reversion
These were key takeaways from my December 2019 article:
- U.S. equities are near their highest levels in history, based on valuation metrics. This suggests meager returns of 4-5% per year over the next decade.
- However, based on reversion to the mean and attractive valuations, there are several attractive asset classes.
- U.S. value, international, emerging markets, natural resources, MLPs and gold present opportunities.
- These assets have the potential for returns in a Base Case scenario ranging from 5.5% per year to 11.6% per year.
- History has shown that it can take years or even decades for a reversal. Only patient and bold investors may reap the rewards.
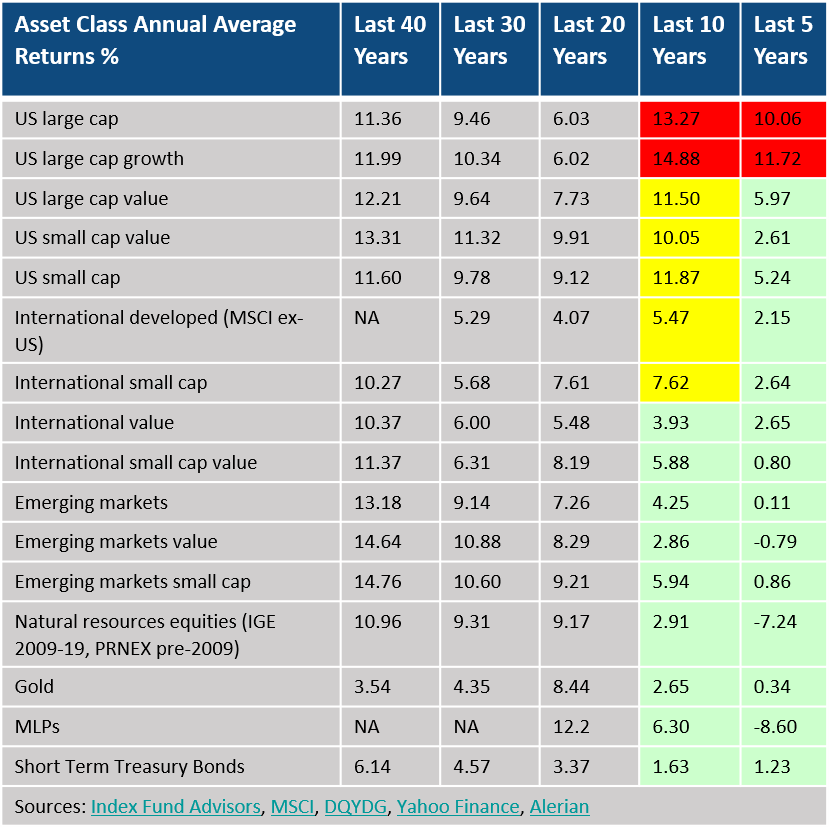
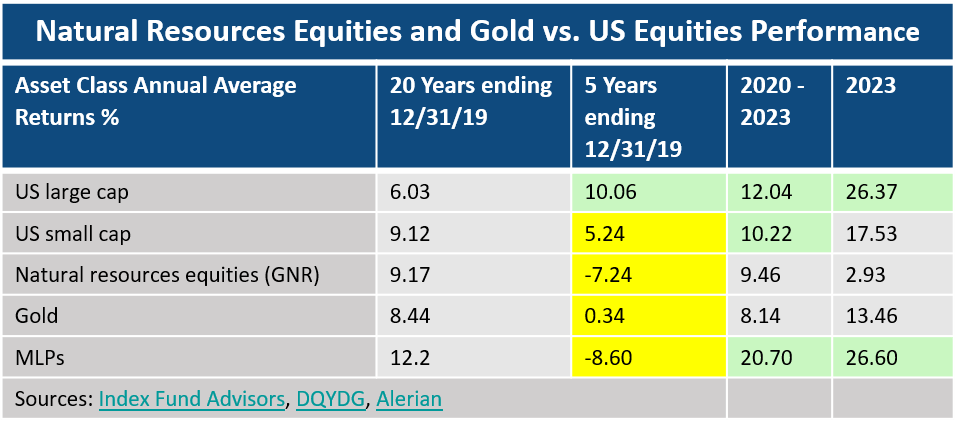
The table below shows data from that article.
Asset class annual returns (Index Fund Advisors, MSCI, DQYDG, Yahoo Finance, Alerian)
U.S. large cap (S&P 500) and large cap growth sectors had strong returns (highlighted in red) for the five and ten-year periods ending in 2019. During that time, they outperformed their 20 and 30-year averages. In contrast, the green highlighted cells depict returns for assets that were well below their longer-term averages. Those were poised for mean reversion. Those in yellow depict ten-year average returns that were in line with their longer-term averages but had underperformed over the previous five years. Similarly, it was reasonable to expect a reversal for that group. We also raised the question of whether U.S. large caps and large growth might cool off given their strength at the time.
Here is an excerpt:
Will the recent sub-par Performance persist? If so, for how long? ... Reversion to the mean often involves the pendulum swinging to the other side of the mean. Those assets that have outperformed swing below their long-term mean returns. Recent underperformers swing to return levels greater than the mean.”
Performance from 2020-2023
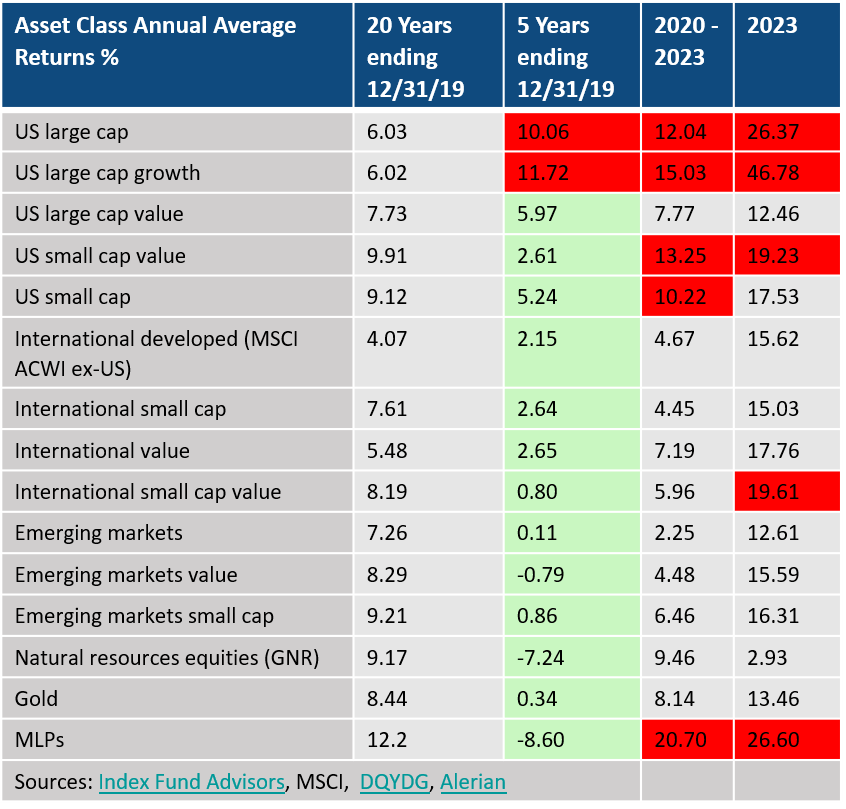
Now let’s see what happened:
Asset class annual returns (Index Fund Advisors, MSCI, DQYDG, Alerian)
Mean Reversion Came into Play for Nearly Every Asset Class
The data show mean reversion in play for almost all categories. Every asset class highlighted in green had better performance from 2020-2023 versus the previous five years.
Those in red were particularly hot performers. U.S. small caps and small cap value had double digit gains from 2020-2023. MLPs came roaring back, gaining almost 21% per year versus annual declines of 9% during the five years ending 2019. Natural resources equities also experienced a major reversal with a 16-percentage point swing in annualized returns but cooled in 2023. Gold went from moving sideways during the five years ending 2019 to annualized gains of 8% during 2020-2023.
Large Caps Defied Mean Reversion, Driven by the Magnificent Seven
The exception to mean reversion was U.S. large cap and large cap growth. The popular FAANGS, now expanded and rebranded as the “Magnificent Seven,” surged. According to Forbes , that group accounted for roughly 60% of the S&P 500’s gains in 2023, leading large cap growth to a gain of 47%.
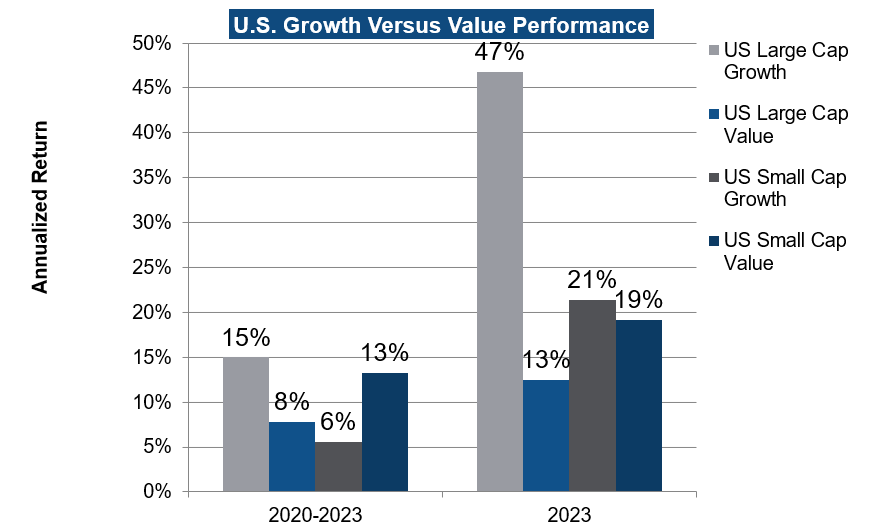
As a result, U.S. large cap growth stocks trounced other sectors last year and over the past four years. Th sector gained 15% per year from 2020-2023. However, investors rode a wild roller coaster with a decline of 33% in 2022 followed by a gain of 47% last year.
U.S. large value stocks gained 13% per year. Small growth and small value lagged large caps also, gaining 6% and 13% per year, respectively. But small growth showed signs of a breakout, gaining 21% last year.
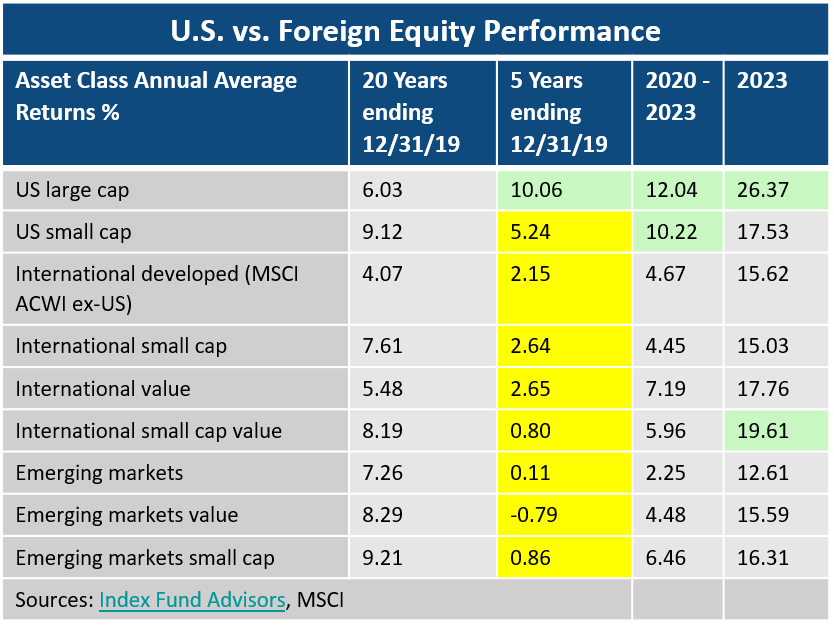
Foreign and Emerging Markets Equities Continued to Languish Versus the U.S.
All the foreign and emerging markets sectors had sub-par returns during the five years ending 2019. Annual returns ranged from -0.79% for EM value to a high of 2.65% for international value.
Index Fund Advisors, MSCI, author
Although they improved over the last four years, all international and EM sectors continued to lag their U.S. counterparts. European economic and war woes and a strong dollar weighed on international developed markets. China’s weak stock market dragged down emerging markets. A strong dollar also put downward pressure on foreign equities.
International value showed signs of life, gaining 7.2% per year over four years and 17.8% last year. International small cap value was notable, gaining nearly 20% last year. Emerging markets small cap gained a solid 16.3% last year, close to its U.S. small cap counterpart, up 17.5%.
Natural Resources Equities Made a 180-Degree Turn, Led by MLPs
Index Fund Advisors, DQYDG, Alerian
In May 2020, the 12-month trailing inflation rate was 0.2%. Natural resources were beaten up and unloved. Their trailing five-year annualized return was -7.2%. In June 2020, my Natural Resources Equities: Preparing for Reflation and a Dollar Decline stated:
There is considerable risk of inflation and dollar debasement in the long term. Commodity equity funds have demonstrated their ability to thrive in such environments. Historically, they have demonstrated portfolio diversification benefits. Right now, sentiment, record low historical valuations, and the strong catalyst of fiscal and monetary stimulus make them an interesting long-term vehicle.”
The following month I wrote Load Up GUNR To Defend Against Reflation and a Dollar Decline :
In my last article, I discussed natural resources equities’ effectiveness in protecting against reflation and a dollar decline. In addition, the sector now presents a sweetener of low historical valuations. Even if we don’t see a reversal in relative valuations, a measured position can provide important portfolio diversification.”
Since that time FlexShares Morningstar Global Upstream Natural Resources Index Fund ETF ( GUNR ) has gained 62%. In 2023 an oil price decline of 10% pressured the sector, resulting in a return of only 3% for the diversified S&P Natural Resources ETF (GNR). GUNR declined 2.5%.
MLPs led all sectors with annualized gains of nearly 21% over the past four years. The sector epitomized mean reversion after losing money for the previous five years. The rally continued in 2023, with the index up 27%.
All in all, natural resources, MLPs and gold provided solid returns and excellent diversification for investors who were willing to invest counter to the conventional wisdom and negative sentiment of late 2019.
Reversion to the Golden Mean
In the 2019 article I wrote:
Gold is up about 14% so far in 2019. However, it has returned only 0.3% per year over the past five years and 2.6% per year over the past ten years. Over the past 50 years, it has returned 7.2% per year… I believe investors should allocate 5-15% of their portfolio to gold, either in the form of physical bullion, gold-backed ETFs or some combination of the two.”
Since that time, gold has returned a solid 8.1% per year. Not bad if you were investing in it as an insurance policy. And it was a good portfolio diversifier in 2022. It ended the year essentially unchanged, preserving capital and beating the S&P by more than 17 percentage points. The metal gained 13.5% in 2023.
Outlook for Mean Reversion Assets
Now let’s look ahead. We will consider historical cycles, valuations and sentiment effects.
Mean Reversion Runs Through Long Cycles
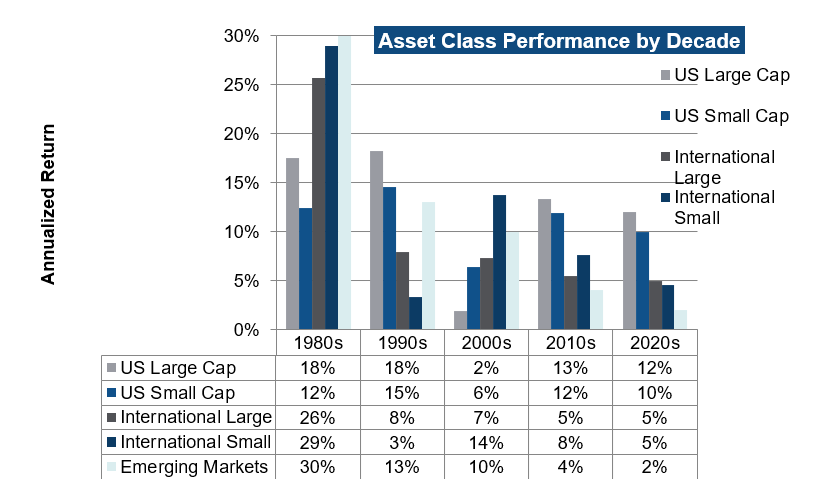
History teaches us that asset classes run through long cycles. The chart below provides an example, comparing U.S. versus foreign equities and how they’ve changed leadership since the 1980’s.
After the strength of U.S. large and small caps during the 1980’s and 1990’s, those sectors languished. International small caps and emerging markets took the lead in the 2000s. Since the early 2010s, following the Great Financial Crisis, the U.S. took the con again.
We will explore similar waves of diverging performance among other asset classes below. But what drives these cycles of relative strength and weakness? I suggest we focus on two primary factors: valuations and sentiment.
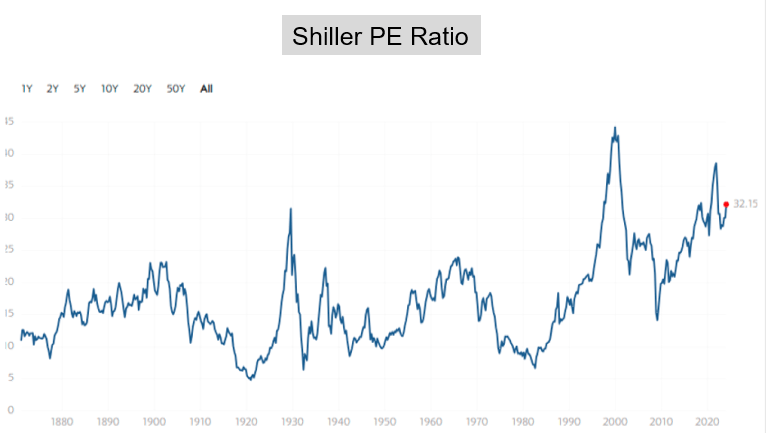
The U.S. Market Remains Expensive by Historical Standards
Let’s begin with a look at the U.S. market. A look at S&P 500 CAPE (the Shiller P/E Ratio) shows it continues to sit at an historically high level of 32. Per Shiller’s research cited in The Best Market Indicator Over the Past 34 Years , this level was associated with 10-year forward average annual real returns of only 1% per year.
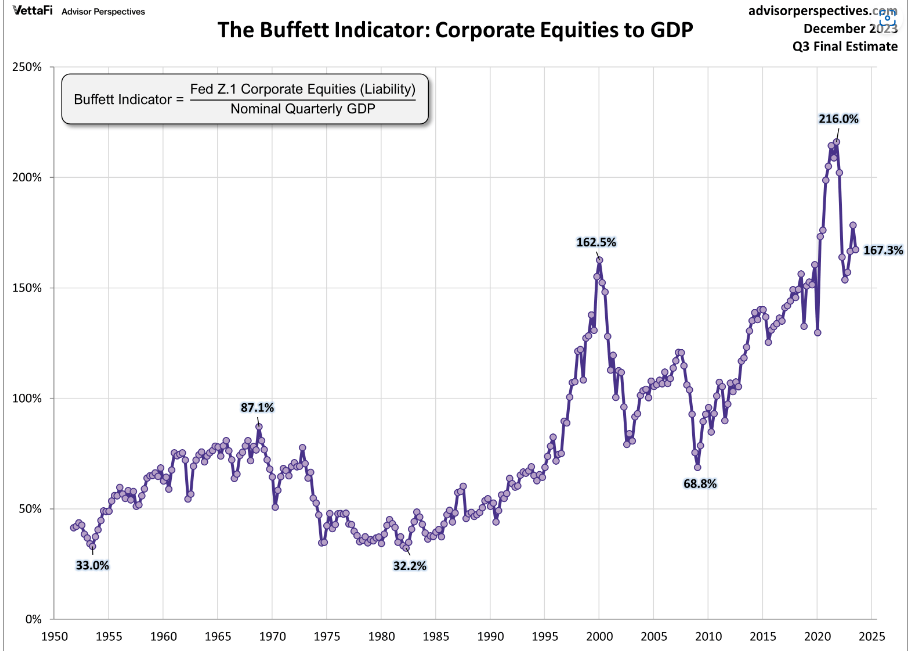
The Buffet indicator also shows an elevated level. Like CAPE, the selloff of 2022 brought it down considerably from the 2021 post-pandemic P/E.
These long-term valuation metrics cast doubt on the ability of U.S. large caps to continue their strong performance over the next ten years.
Relative Valuations Remain Favorable for Mean Reversion Assets
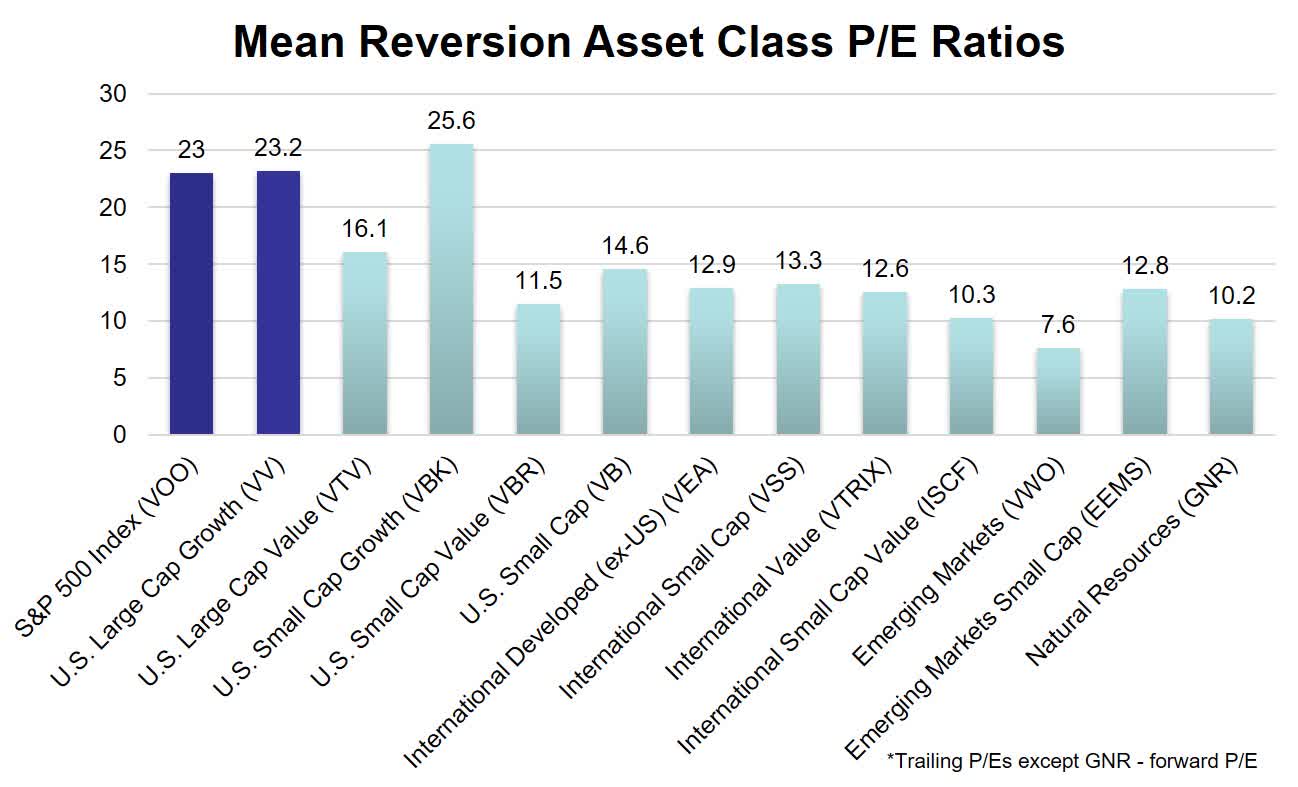
The chart below shows P/E ratios for various equity sectors.
Vanguard, BlackRock, SSGA, author
The S&P 500 (VOO), U.S. large cap growth ( VV ) and small cap growth ( VBK ) standout as most pricey. Emerging markets are very cheap at 7.6X earnings. U.S. ( VBR ) and international small cap value ( ISCF ) look enticing at only 11.5X and 10.3X earnings, respectively.
Value Stocks Are Cheap Compared to Growth
Large cap growth stocks trade at 23X earnings and large value at only 16X, a discount of 30%. Similarly, small cap growth trades at a P/E of 26X versus small cap value at only 12X.
The chart below shows the relative performance of growth versus value since 1978. Growth has trounced value since the 2009 bottom after the Great Financial Crisis.
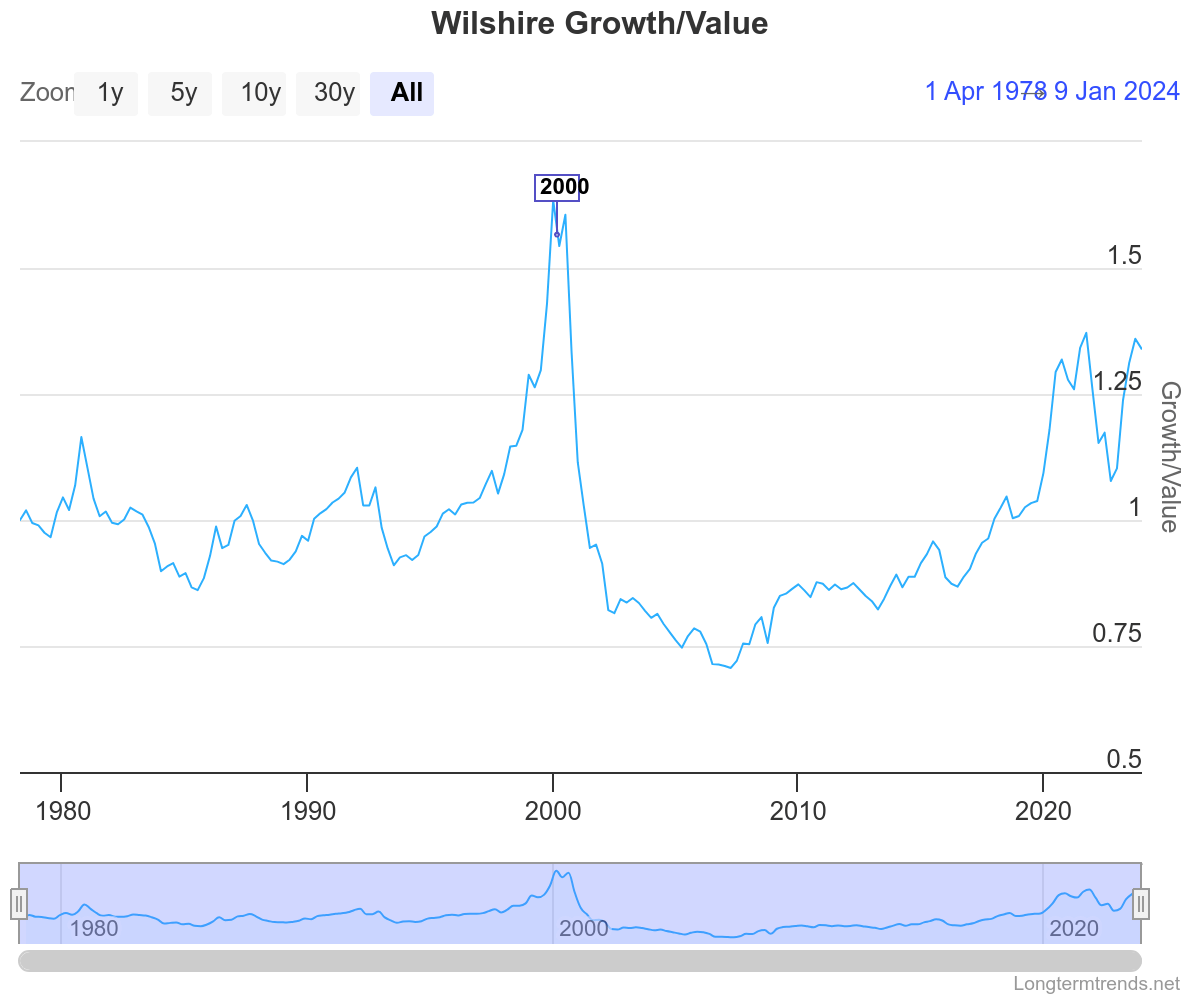
The underperformance of growth versus value during the 2022 bear market removed much of the excess. However, 2023 brought it back to nearly its highest disparity since 1999 - the peak of the dotcom bubble. On cue, from 2000-2009 value stocks gained 4.4% per year while growth declined 0.96% per year.
Similarly, in 1999 U.S. small caps, U.S. small cap value and emerging market equities had low relative valuations. Enter mean reversion again: those sectors gained 5.7%, 9.1% and 9.5% per year respectively over the following decade, handily beating the S&P. At some point, valuations matter.
My preferred value picks are:
- U.S. large cap value – VTV
- U.S. small cap value – SLYV
- Emerging markets small cap value - DGS
Foreign Equities Have Been Underperforming the U.S. for Almost 13 Years. A Reversal Seems Long Overdue.
The chart below shows the relative performance of U.S. and International equities since 1975. The outperformance cycle for U.S. vs. international stocks has lasted an average of eight years. We’re currently almost 13 years into the cycle of U.S. outperformance.
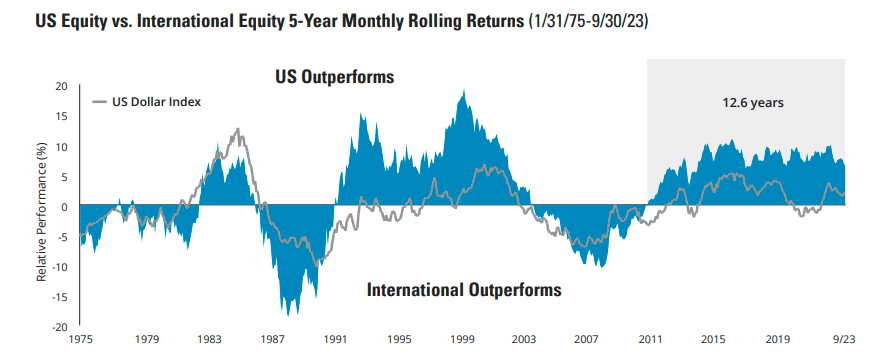
P/E ratios of foreign equities range from 7.6 for emerging markets to 13.3 for international small caps. That compares to 23 for the S&P 500. The strength of the dollar over the past decade has also contributed to this. I’ve talked about the long-term outlook for the dollar in several other pieces such as What the World’s Top Investors Are Buying and Selling . There I shared some of Ray Dalio’s thinking:
The current monetary policy regime is in its last stage, or MP3 as he terms it. This precedes a debt resetting process. History shows this has happened many times to other countries, including major countries nearing the end of their reign as the world's greatest power. The situation is most often resolved via inflation and currency debasement. It also results in the loss of world reserve currency status.”
In summary, the extended period of prolonged U.S. equity outperformance, relative valuations and the outlook for the dollar suggest a reversal for international and emerging markets equities may be due before too long.
My top foreign equity picks are:
- Emerging markets small cap value – DGS
- International developed markets – VEA
- International small cap – ISCF
You may also wish to look at The Contrarian’s All-Weather Retirement Portfolio – Top Picks By Asset Class for more details.
Natural Resources Equities and Gold Appear to be in the Early Innings of a Bull Market
Natural resources equities and gold have turned around since my 2019 article. I believe they still have room to run. The diversified S&P Global Natural Resources index, represented by the GNR ETF, has a modest P/E of only 10.2. I believe the favorable macro factors noted in my 2020 article are still in play for the coming years. As noted above, my preferred holding is GUNR.
MLPs have reasonable valuations, strong cash flow and high yields of 6-10% depending on which vehicle you choose. The Alerian MLP ETF ( AMLP ) has a trailing 12-month yield of 7.7%. I own the Global X MLP & Energy Infrastructure ETF (MLPX).
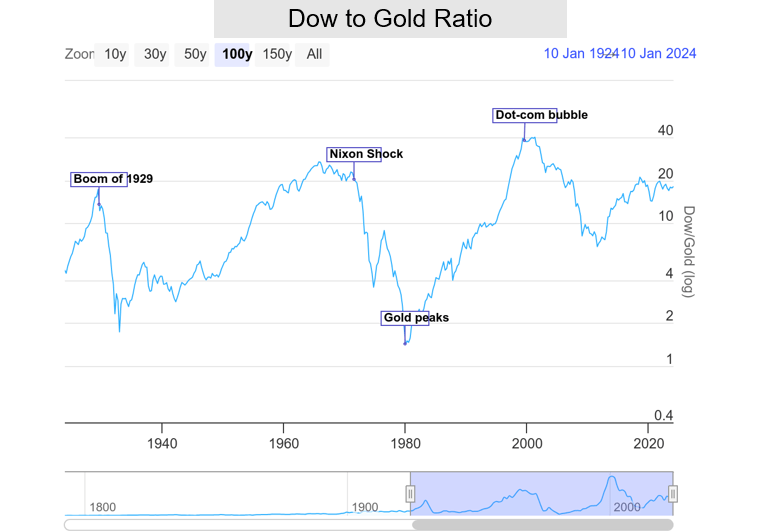
The Dow To Gold Ratio is Near Peaks Reached in 1929 and 1971, But Below the Dot-Com Bubble High
The gold to Dow 100-year chart provides a long-term cycle perspective. U.S. large cap stocks represented by the Dow are close to the secular peaks of 1929 and 1971 relative to gold. However, we are currently at only half the level of the dot-com bubble peak. So stocks could still push higher on a relative basis.
Gold’s breakout last month boosted sentiment, inevitably setting it up for what looks like a near-term consolidation that is underway. I’ve written several articles about gold, most recently SA Editors’ pick, Where is Gold Going? Watch Sentiment Not Fundamentals . I also discussed the long-term possibilities for gold based on its relationship to the money supply in The Case For $5,000 Gold . Finally, the long-term technicals are firmly bullish according to Elliott Wave Theory. Check out Avi Gilburt’s analysis on SA for more details.
U.S. Stock Market Bullish Sentiment Is Elevated - But Be Cautious Betting on these Indicators
Now let’s turn to sentiment. I’ve written two articles on SA about this: The Best Market Indicator Over the Last 34 Years and The Best Market Indicator Over the Past 36 Years Just Flashed a Bearish Signal
The latest Investors Intelligence reading shows the bull/bear ratio is at 3.07. This level has often been associated with major market tops. But in my articles, I also cautioned that it is an imperfect and crude timing tool.
For example, the indicator also reached three in August 2023 when the S&P was trading at 4576. As of this writing it stands at 4783, up 4.5%. Short-term traders would have been punished for betting on it. The indicator also missed the dotcom bubble bursting and never exceeded three. And during 2003-2005, it bounced above and below three, yet the market gained each of those years.
The AAII investor sentiment survey is another useful contrarian indicator - at the extremes. It shows investor sentiment towards equities over the coming six months. Current readings show 48.6% bullish, 27.2% neutral, and 24.2% bearish. That’s a bullish reading compared to historical averages of 37.5%, 31.5% and 31% respectively. The one year bullish high of 52.9% was reached in late December 2023. Bullish sentiment remains above the historical average for the 10 th consecutive week. This suggests the market may be due for a correction.
However, the AAII members only study, Investor Sentiment as a Contrarian Indicator only considers subsequent market returns when the gauge is more than two standard deviations above the mean, or 61.4%. We haven’t reached that level so there is more room for the bulls to run.
In summary, sentiment suggests a market decline ahead. If that happens, it’s reasonable to expect large caps and large growth would lead on the way down. Value sectors may provide shelter on a relative basis. For example, in 2022 the S&P dropped 18% while U.S. large cap value lost 5.8%. However, an extreme bear market will likely crater all equity classes. And the sentiment indicators are imperfect timing tools.
Risks
Large cap growth returned to dominance last year and has been remarkably resilient for years. That trend may persist. While asset classes that were out favor before 2019 have come to life in recent years, they may continue to underperform the major U.S. indices. History shows that sectors such as international and EM equities can continue to languish for years or even decades.
All-weather portfolio adherents know that tactical shifts in and out of asset classes can be hazardous to their investment health. Just when you think a sector has taken over leadership, it can suddenly reverse course.
Conclusion
Mean reversion was once again demonstrated in recent years, albeit the U.S. large cap growth sector continued to dominate. As I outlined in my all-weather portfolio article series, for years I have held and will continue to hold positions in some of the previously out of favor sectors. The length of recent cycles, relative valuations, diversification benefits and sentiment all bode well for several mean reversion assets. Those factors should provide comfort to patient investors who carry a measured allocation as part of an all-weather portfolio.
I look forward to your comments.
For further details see:
Asset Class Mean Reversion: 2024 Review And Outlook