ATRC - AtriCure: Core Growth Markets Expanding But Could Be Well Priced In
2023-08-29 22:32:23 ET
Summary
- AtriCure stock has been heavily sold off following its Q2 numbers, despite strong performance and a revised full-year outlook.
- The company has seen growth across all segments, with around 20% growth and profits posted at the adj. EBITDA line.
- Valuations aren't supportive in my view, but investors should closely monitor the company in H2 nonetheless.
- Net-net, reiterate hold.
Investment Summary
AtriCure, Inc. (ATRC) had caught a reasonable bid since the last publication in December '22. But the rally was short-lived, and the stock's been heavily sold off following its Q2 numbers. This was surprising if I'm being honest, because the print was reasonably strong in my eyes. Around 20% growth across all segments, profits posted at the adj. EBITDA line, and a revised full-year outlook.
The broad healthcare basket has taken a hit in H2 this year and it wouldn't be unreasonable to expect ATRC falls within this bundle of companies. Further, current multiples aren't suggestive of a large mispricing, and the major catalysts are fundamentally driven at this point. Despite the multiple positives outlined here today, the question remains if most of the 'good news' as it were had already been priced in prior to the selloff. I remain neutral on ATRC for now on valuation grounds, but am watching the name very closely in H2. I would encourage investors to do the same. Net-net, reiterate hold.
Figure 1.
Critical points to investment debate
As a reminder, ATRC is in the surgical business for atrial fibrillation ("AF") and left atrial appendage ("LAA"). Its products are used during both open-heart and minimally invasive procedures. Most are used in conjunction with the procedure to ensure a safe outcome for patients. It reports revenues from the U.S. and internationally, across its ablation, pain management and appendage management segments. A full run down of the moving parts of ATRC's investment prospects is noted below.
Insights from Q2 FY'22 earnings
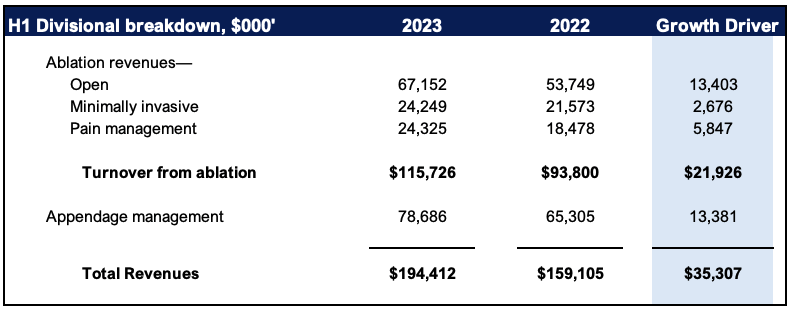
ATRC put up Q2 revenues of $100.9mm, up 19.4% YoY, and a c.8% sequential growth pattern on Q1. U.S. sales were $84.9mm, also an increase of 19.1% from last year. International sales up ~20% as well. Such is the momentum this YTD, management has increased FY'23 projections. It now looks to $392mm-$395mm in revenues, calling for 19%-20% growth at the top line. It has booked $194.4mm in sales so far in '23, around 49% of the projected clip. It must produce another $200.6mm to get to its upper end of guidance. Notably, it also foresees a slowdown in Q3 sales (due to standard seasonality), and thus in my view the bulk of growth in H2 will be biased towards Q4.
It pulled the $100mm to gross of 76.4%, a 130 bps decompression from Q2 last year. Manufacturing efficiencies underscored the marginal gains which is a potential strong point for the higher sales growth projected for '23.
Divisional highlights
- On the revenue front, ATRC is driving the bulk of its sales momentum in its open ablation business. Available ablation product sales pushed to $27mm, marking a 22.3% YoY growth. Adopting the EnCompass clamp in existing and new accounts fueled this growth. Looking at YTD sales, open ablation has been the major revenue driver, pulling in $13.4mm at the top line, with ablation sales up nearly $22mm from H1 last year, making up 62% of overall turnover.
- Minimally invasive ablation sales totalled $11.4mm, up 12% YoY, underscored by the EPi-Sense system's sales growth. Domestic appendage management product sales clipped $33.9mm, a 17.7% YoY growth schedule.
Figure 2.
- Q2 also marked 12 months since the commercial launch of ATRC's EnCompass clamp. Two points are relevant here. First is that management reports the EnCompass additions has lifted ablation volumes to a new average. Second, the uplift from pricing has gradually diminished. It will thus be question of demand for EnCompass sales moving forward in my view. It comes to a point where ATRC could price itself out of the market should it continue increasing the price point. Hence you'd be looking to management's language on volumes to indicate demand moving forward. I'd prefer to see this as well given the fact any company can just raise prices to book more turnover. Raising demand is a different story altogether.
- Finally, the firm's pain management sales reached $12.6mm, up 23.3% YoY. Minimal contribution was observed from ATRC's sternotomy procedures in the U.S., which could be a risk going forward.
- It's also worth noting that the appendage management business is up $13.4mm from H1 FY'22-H1 FY'23, booking $78.6mm for the YTD.
Profitability relative to asset growth
The firm posted its first adj. profit below the gross level in Q2 as well, posting quarterly adj. EBITDA of $8mm. We've still got a ways to go before the sales mentioned earlier fall to the bottom line, but the company is indeed on its way there.
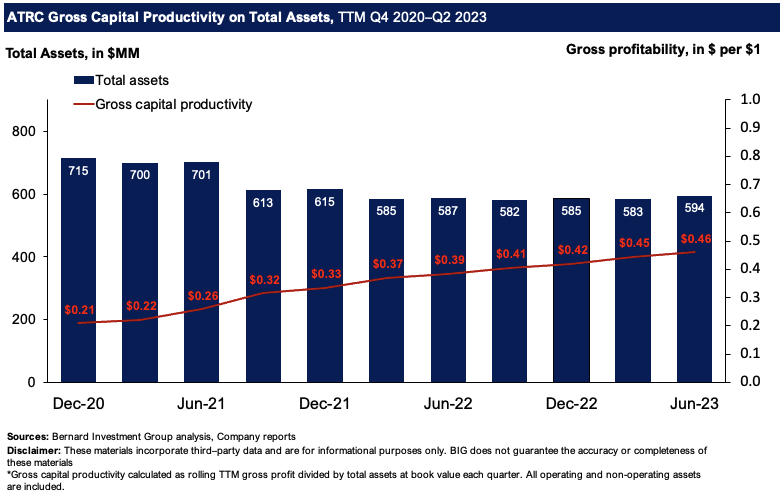
Scaling profitability by asset growth is a cleaner measure that benchmarks a company's income against the assets that produce it (Novy-Marx 2013) . ATRC has evidenced attractive productivity in this regard. Figure 3 depicts the company's gross profits scaled by asset growth on a rolling TTM basis since 2020. The TTM gross from each period is taken as the quotient of total assets over this period. All core and non-core assets are included, at book value on each filing.
Gross capital productivity is up from $0.21 on the dollar in 2020 to $0.46 for every $1 in assets by Q2 FY'23. This is a 119% incremental gain over the period, whereas it has actually decreased asset intensity ~17% in the same time. Hence, it shows that 1) the lighter asset base is contributing more in gross profitability, and 2) gross profitability is stretching higher in linear fashion. These are attractive economics, that demonstrate the firm's gross earnings power moving forward. Its NWC requirements are ranging between $11-$16mm on a rolling TTM basis since 2021, mostly driven by inventory purchases.
Management are eyeing 74-75% gross for FY'23, and I'd call for at least $600mm in gross asset value. On management's yearend projections, this implies the firm will return $0.49 in gross per $1 in assets at the upper ends of range (49% gross return on assets), another 650bps from H1. This is a potential bullish point in my estimation. Figure 3.
Market-generated data
There is mixed sentiment in ATRC's equity stock at present and we observe this clearly in two ways.
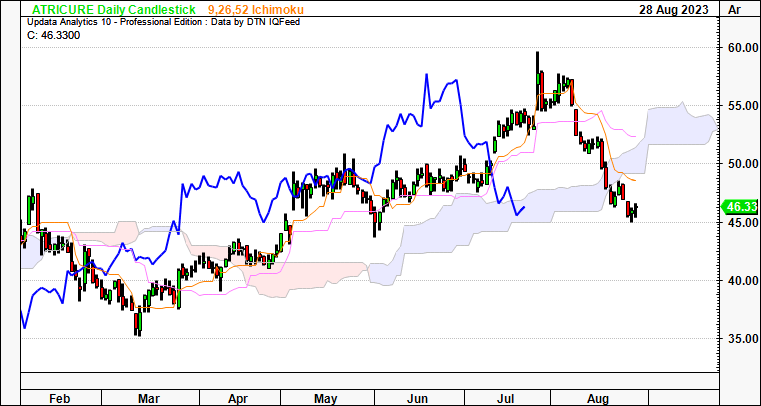
One, price structure of the firm's equity has rolled over since the release of its Q2 numbers. I'd also point out that broad healthcare has been heavily sold off leading into H2 FY'23. There's a high likelihood this spilled over to ATRC as well. On the cloud chart in Figure 4 and 5, we see what this means for the longer-term trends. Figure 4 outlines the daily chart, and looks to the weeks ahead. The price line has broken the cloud base, with the lagging line not far off. It is crucial for ATRC to catch a bid at these levels to see it rate higher once again. I'd be looking to a move to $51-$52.00 by end of September as evidence it can sell higher once more.
Figure 4.
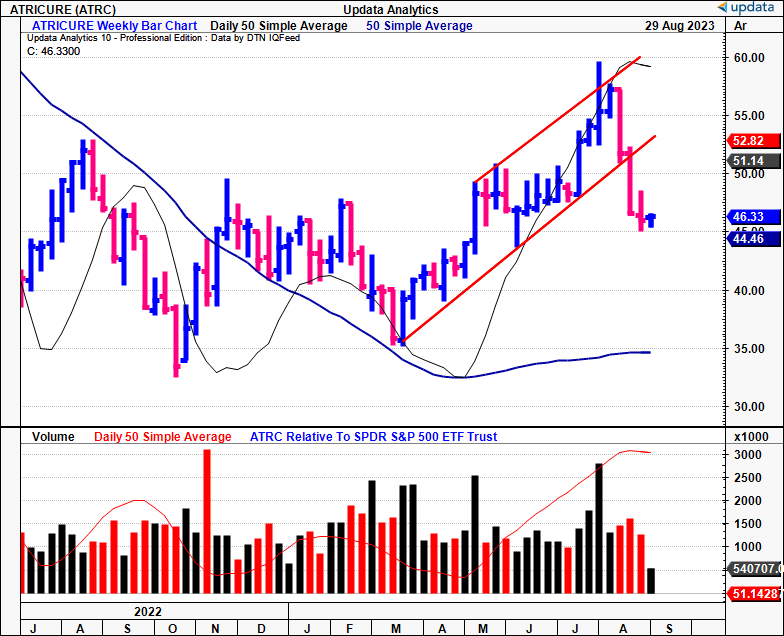
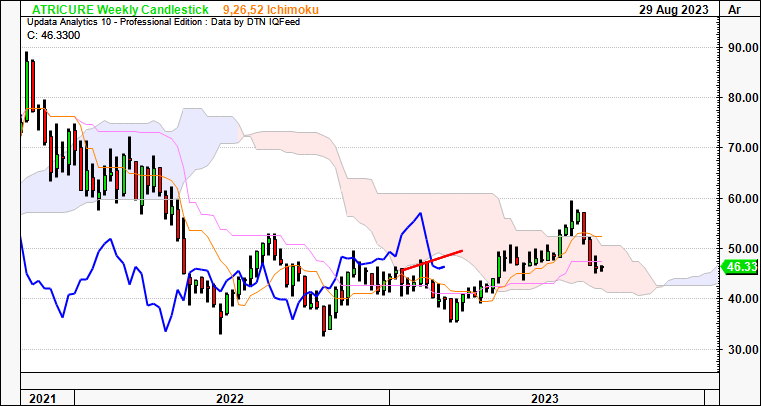
Two, the weekly chart below looks out to the coming months and shows almost the same symptomatology. The lagging line broke the cloud this month with the sharp selloff and again, needs to curl off these lows to ATRC sell at previous highs. This could potentially be the case even if it trades sideways for the next month or so. The cloud is descending, and one of the turning lines is testing the cloud as we speak (you see this in orange). Hence, I'm not convinced either side of the account at present based on the current price structure. To me this is a neutral setup.
Figure 5.
Three, despite the price action, Wall Street analysts have revised their revenue and earnings targets higher 7 times over the past 3 months. Say what you will about The Street's targets, but an entire substrata of the market's populous do in fact utilize these objectives in their security modelling/analysis/projections. It stands to reason this represents at least in part the view of this subset. Consensus now calls for ~20% YoY growth in FY'23 to $393mm, and another 14-15% next year to $450mm, both numbers having been revised higher in recent months, as mentioned. If the analysts are correct, ARTC could be a $500mm company (by sales) by F'25.
Alas, the market-generated data is balanced and has both negative and positive inflection points.
Valuation and conclusion
The stock sells at 5.5x forward sales , a 42% premium to the sector, but is ~30% below the company's 5-year average of 7.86x forward. It also trades at 4.7x book value, a premium that suggest the market is valuing its net asset highly. But a more thoughtful approach to ATRC's valuation is required here. So far there's been positives observed in its asset recycling and the gross profit rotated back on its asset base. Taking it a step further, focus on the capital deployed into ATRC's operations is meaningful. Consider the following from Figure 6:
- ATRC has $513mm put at risk into core operating assets, shown as invested capital ("IC"). This includes all cash on hand ($127mm), as I believe the firm will draw on these as it continues growing.
- It's market value, as I write, is $2.18Bn, on an enterprise value of $2.13Bn. Hence, the market value added ("MVA") is $1.66Bn ($2,180-513.7 = $1,666).
- More critically, the ratio of EV to invested capital it 4.15, that is, ATRC trades at 4.15x EV/IC.
The last point is telling as it suggests investors expect the company to produce higher earnings (likely pre-tax) for every $1 put to work in the business. Equity holders are the residual claim holders of a firm's capital. In that case, this is a good sign for shareholders in my view, as it shows the market values ATRC's operating capital very highly, including its inventories and finished goods.
However, at 5.5x forward, using management's FY'23 sales estimates of $395mm, I get to $2.19Bn in market value, of $46/share, roughly in line with the current market marginal upside on the current market value. Despite the calculus listed to far, I remain neutral on valuation grounds.
Figure 6.
BIG Insights
In short, there are multiple facets to the debate that point to ATRC performing well on fundamental value creation. In my view, the firm's ablation business is the standout, and the gross productivity produced on its asset base are attractive at $0.46 for every $1 tied up in both core and non-core assets. The market values the firm's invested capital highly, placing a 4.15x multiple at the time of writing. To me this suggests investors expect high growth off the capital deployed into the business, and there's good reason to suspect this as well. However, starting price matters, and the stock sells at 5.5x forward sales, getting you to $46/share in implied value using management's FY'23 sales estimates. To me, this could suggest a good portion of the forward growth is priced in. So while I'm turning more constructive on ATRC, given the lack of reported profits after-tax, combined with current multiples, I remain on the sidelines for now. But I'm watching the name in H2 very closely, as mentioned. I'd urge you to do the same.
For further details see:
AtriCure: Core Growth Markets Expanding, But Could Be Well Priced In