SWAV - August MDA Breakout Stocks Week 31 - 2023: High-Frequency Gainers To Give You An Edge
2023-07-31 14:43:42 ET
Summary
- Two new Breakout Stocks for Week 31 curated by the MDA model for 10% short-term upside and additional model selections.
- This week two of four picks gained over 10% in less than a week with peak gains in CLLS +16.8% AUTL+15.5% but the portfolio failed to hold gains.
- The streak of weekly picks gaining over 10% in less than a week has increased to 255 out of 322 trading weeks (79.2%) not including multiple gainers or warning signals.
- I'm sharing many more proprietary gauges and prior selections this week to help you start the month of August well-prepared.
Introduction
The Weekly Breakout Forecast continues my doctoral research analysis on MDA breakout selections over more than eight years. This high frequency breakout subset of the different portfolios I regularly analyze has now reached 320 weeks of public selections as part of this ongoing live forward-testing research. The frequency of 10%-plus returns in a week is averaging over 4x the broad market averages in the past 5-plus years.
In 2017, the sample size began with 12 stocks, then eight stocks in 2018, and at members' request since 2020, I now generate only four selections each week. In addition, two Dow 30 picks are provided using the MDA methodology, but I highly recommend the monthly Growth & Dividend mega cap breakout portfolios if you're looking for larger-cap selections beyond only 30 Dow stocks.
As long term investors know , you can compound $10,000 into $1 million with 10% annual returns in less than 50 years. This model serves to increase the rate of 10% breakouts into 52 weekly intervals instead of years.
2023 Performance of the MDA Algorithm
Deviating briefly from the one-week measurements and evaluating the weekly picks for ongoing top performers provides the current returns of stocks leading the S&P 500 this year from their selection week. While these picks are intended for very short-term gains, we can see that strong gainers continue from nearly every prior week this year. Stocks like MLTX and RIOT are well on their way to joining the V&M Multibagger list.
| Week |
| Symbol |
| 1 Week Peak Original Gain |
| Current Price |
| Current Gains |
| Week 28 |
| ( SMCI ) |
| 19.17% |
| 334.5 |
| 29.91% |
| Week 27 |
| ( TTI ) |
| 9.09% |
| 4.38 |
| 28.45% |
| Week 27 |
| ( RIG ) |
| 20.62% |
| 8.55 |
| 31.54% |
| Week 26 |
| ( GENI ) |
| 4.46% |
| 7.6 |
| 25.62% |
| Week 25 |
| ( EDU ) |
| 0.21% |
| 56.11 |
| 31.84% |
| Week 23 |
| ( FTCI ) |
| 1.72% |
| 3.68 |
| 26.46% |
| Week 22 |
| ( INTR ) |
| 22.53% |
| 3.76 |
| 48.62% |
| Week 22 |
| ( MLTX ) |
| 5.39% |
| 61.26 |
| 113.08% |
| Week 22 |
| ( NE ) |
| 2.15% |
| 51.91 |
| 29.65% |
| Week 22 |
| ( PDD ) |
| 7.23% |
| 89.35 |
| 32.57% |
| Week 21 |
| ( PUMP ) |
| 4.56% |
| 10.04 |
| 34.58% |
| Week 20 |
| ( FLNC ) |
| 8.97% |
| 27.33 |
| 20.24% |
| Week 19 |
| ( COIN ) |
| 14.41% |
| 94.76 |
| 70.06% |
| Week 16 |
| ( DO ) |
| 2.44% |
| 15.44 |
| 25.73% |
| Week 16 |
| ( IMCR ) |
| 16.50% |
| 65.78 |
| 23.60% |
| Week 15 |
| ( TCMD ) |
| 6.46% |
| 23.01 |
| 30.29% |
| Week 14 |
| ( ELF ) |
| 3.02% |
| 115.94 |
| 42.29% |
| Week 12 |
| ( NVDA ) |
| 6.31% |
| 467.5 |
| 80.14% |
| Week 12 |
| ( RIOT ) |
| 31.00% |
| 18.38 |
| 147.71% |
| Week 11 |
| ( ON ) |
| 0.42% |
| 105.09 |
| 27.54% |
| Week 10 |
| ( EDU ) |
| 3.99% |
| 56.11 |
| 26.43% |
| Week 9 |
| ( EPM ) |
| 4.77% |
| 9.23 |
| 42.00% |
| Week 8 |
| ( SWAV ) |
| 5.53% |
| 262.94 |
| 26.42% |
| Week 5 |
| ( RIVN ) |
| 12.82% |
| 26.94 |
| 37.59% |
| Week 3 |
| ( GOTU ) |
| 10.56% |
| 4.42 |
| 22.78% |
| Week 2 |
| ( VYGR ) |
| 66.10% |
| 9.08 |
| 39.91% |
| Week 1 |
| ( DCGO ) |
| 7.21% |
| 8.75 |
| 23.76% |
As long-term readers know, this model generates high frequency breakouts with the current distribution of peak weekly gains year-to-date. Members have shared many strategies that I have published in our community library to help you enhance your returns.
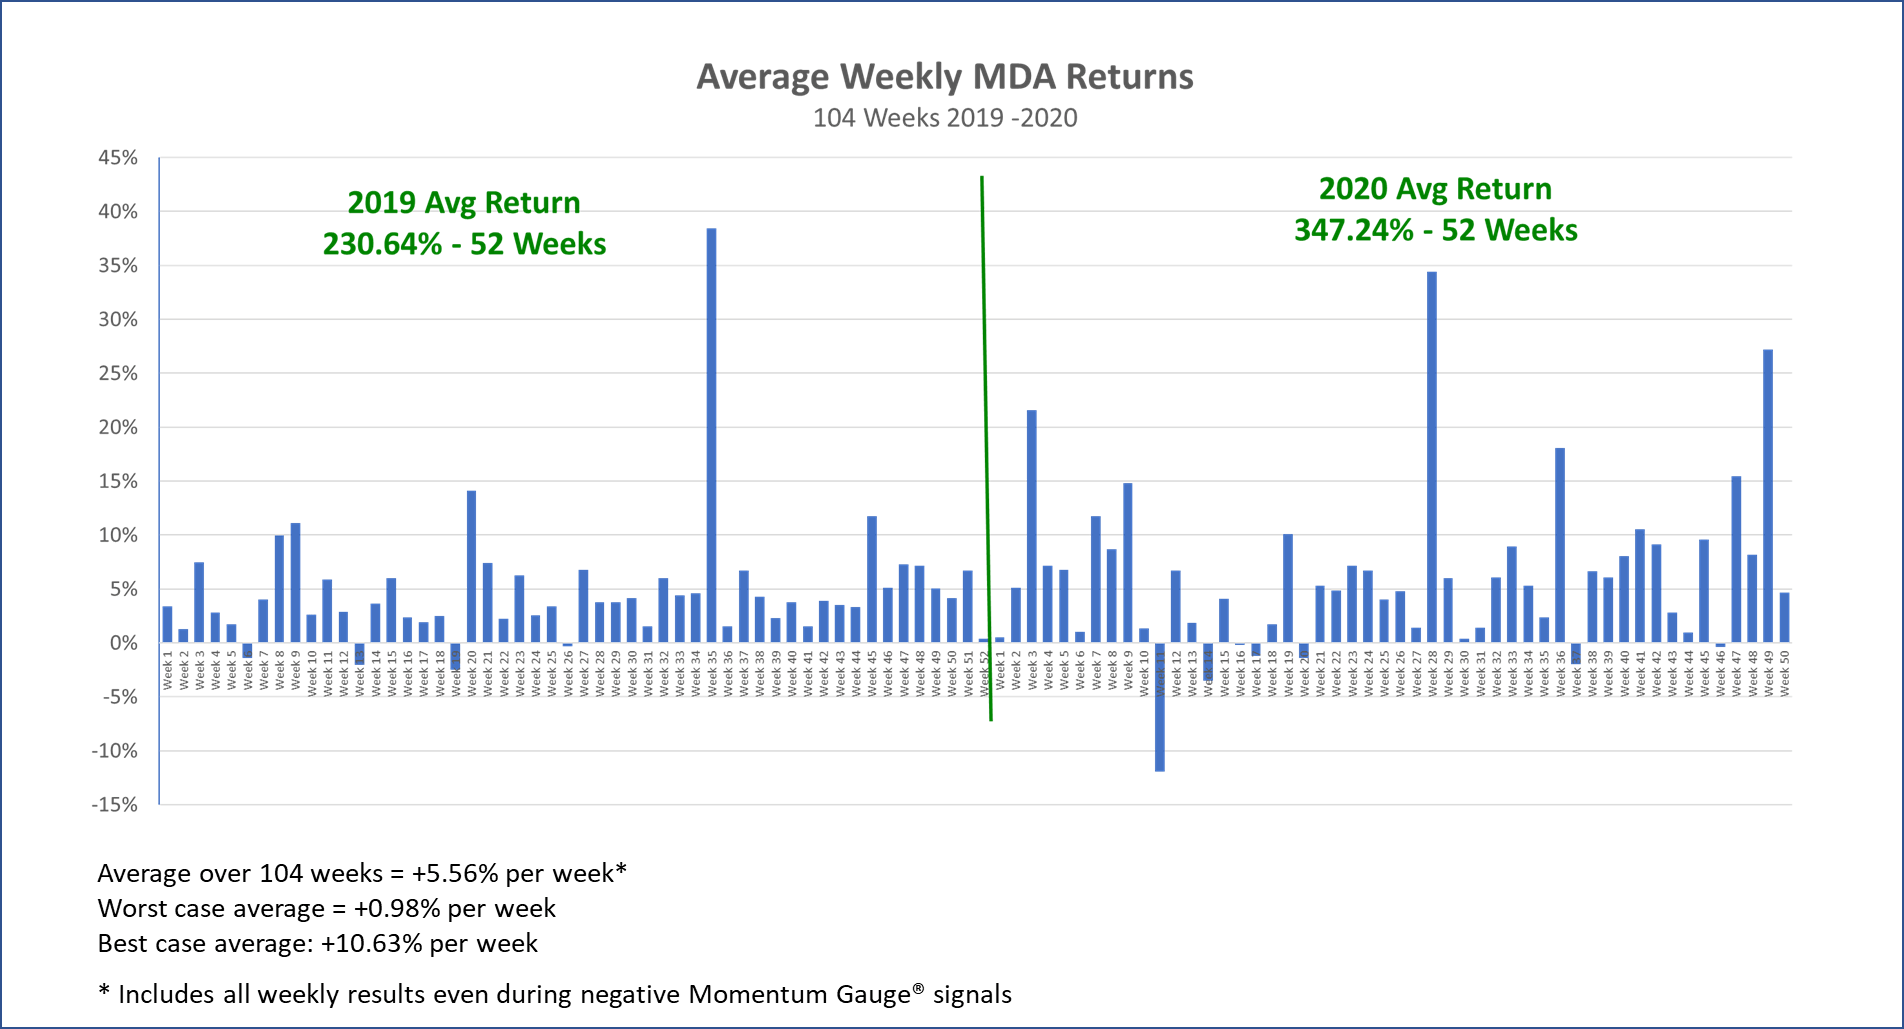
Currently 73 out of 120 selections (60.8%) have gained more than 5% in only their measured week this year. These returns are consistent with prior years' performances even during Federal Reserve QE stimulus years of 2019 and 2020 over 104 weeks.
VMBreakouts.com
Warning: All published results are only possible for members. These stocks are measured from actual release on Friday morning to Friday close. Sample stocks are released publicly over the weekend.
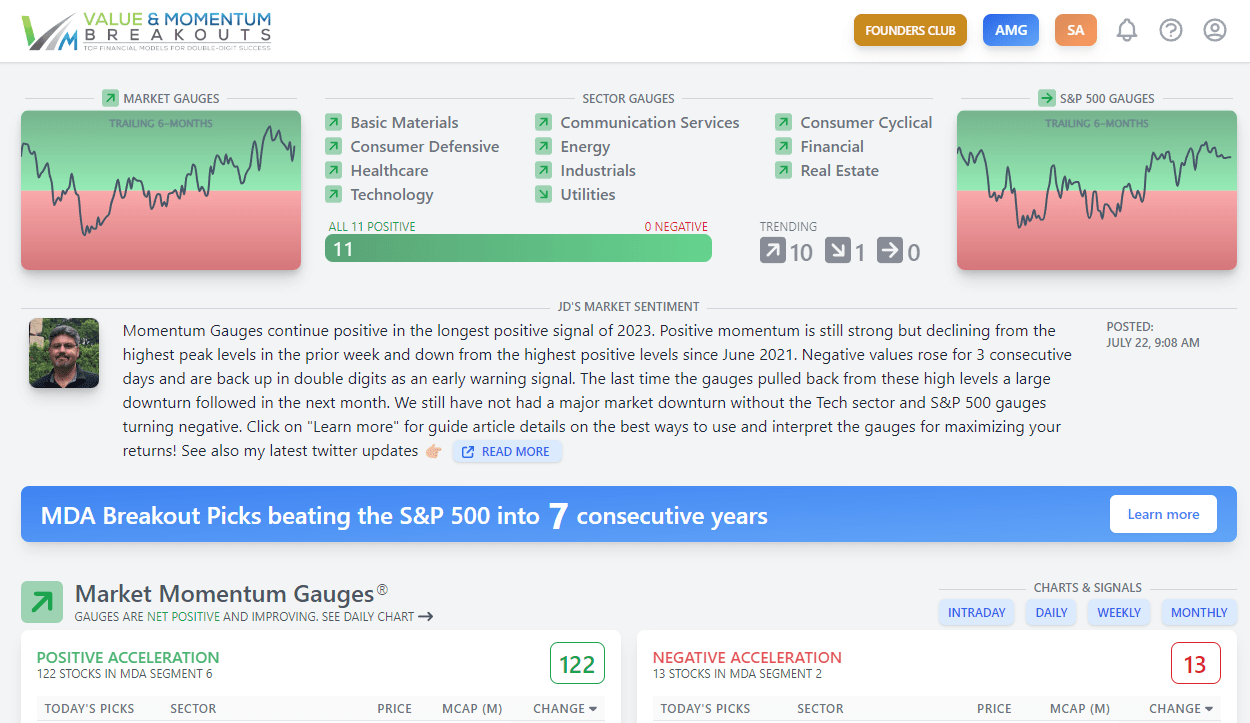
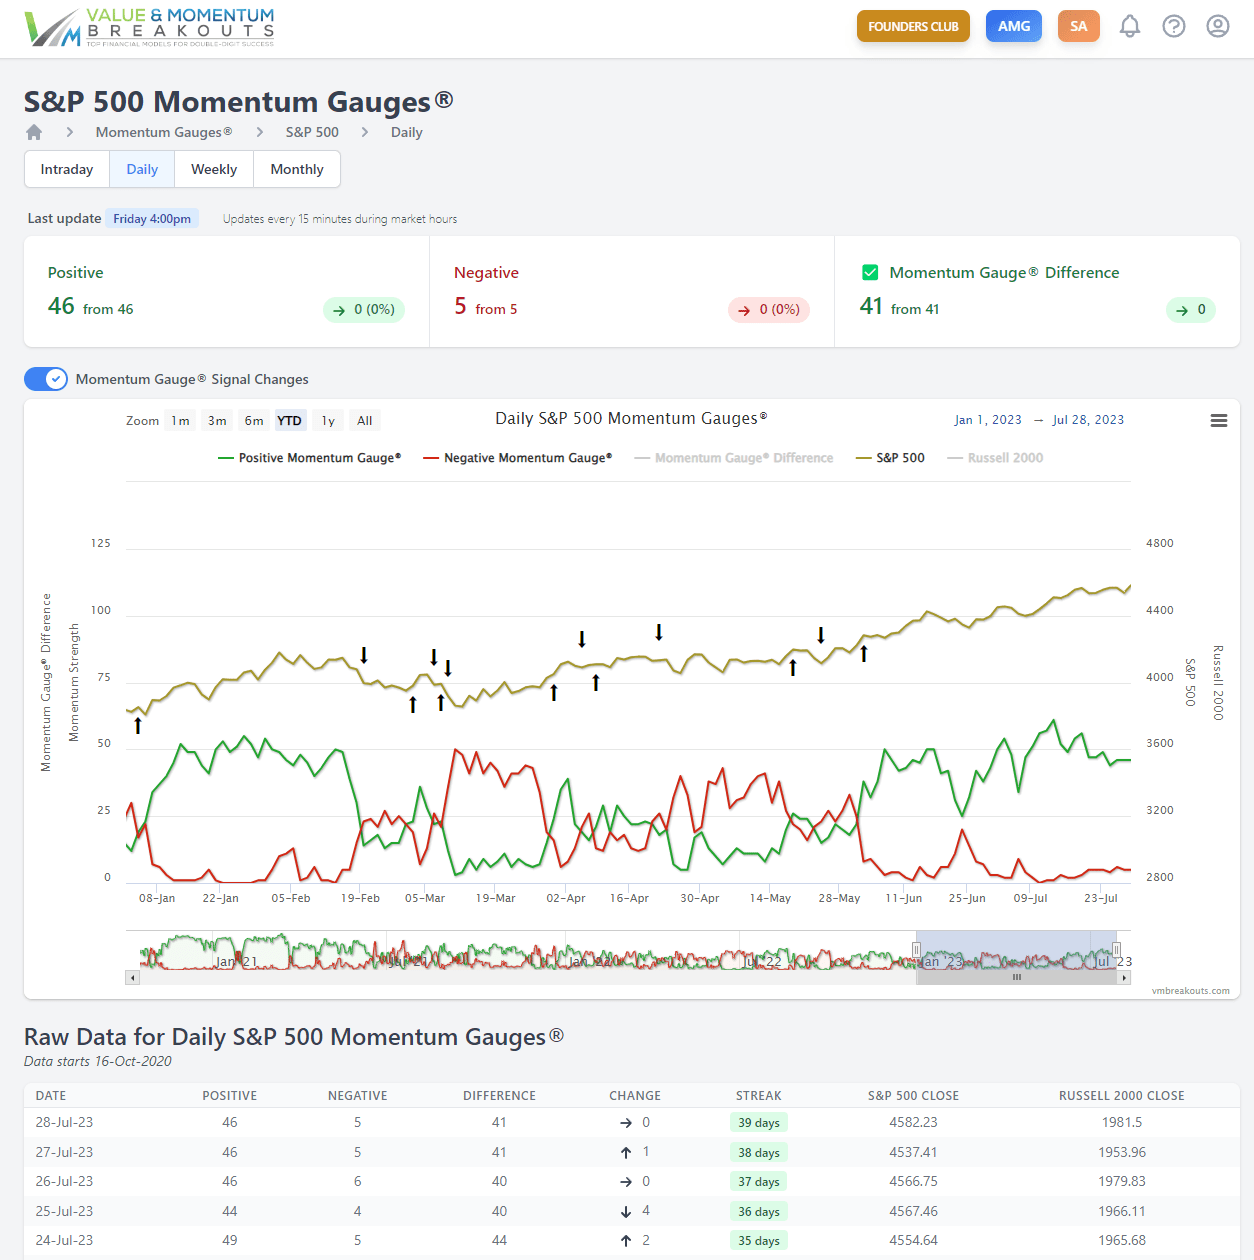
Momentum Gauges Dashboard for Week 31
The Momentum Gauges all continue positive in the longest positive signal this year from June 1. Historically, July is the second-best month of the year on average for the S&P 500 since 1927. Last week my strong warnings of high volatility and risk were accurate as the Fed rate decisions caused large market swings. The ongoing Q2 earnings are still delivering huge surprises for investors so caution is warranted next week as well ahead of Apple and Amazon earnings Wednesday.
app.VMBreakouts.com
You can find my long-term outlook articles here for 2023 that may carry on even longer as the Fed has stated that inflation could remain above their 2% target into 2025:
- Forecasting The S&P 500 For 2023: Year Of The Fed-Pivot And More Record Volatility ( SP500 )
- Momentum Mojo: Alternating Segment Breakouts Favor Oversold Value And Small Caps
- Momentum Memo: Biggest Shift Into Lagging Value Sectors In Friday Breakout
Keep a close eye on the technical support and unusual Thursday/Friday performance of the S&P 500 YTD.
Twitter.com
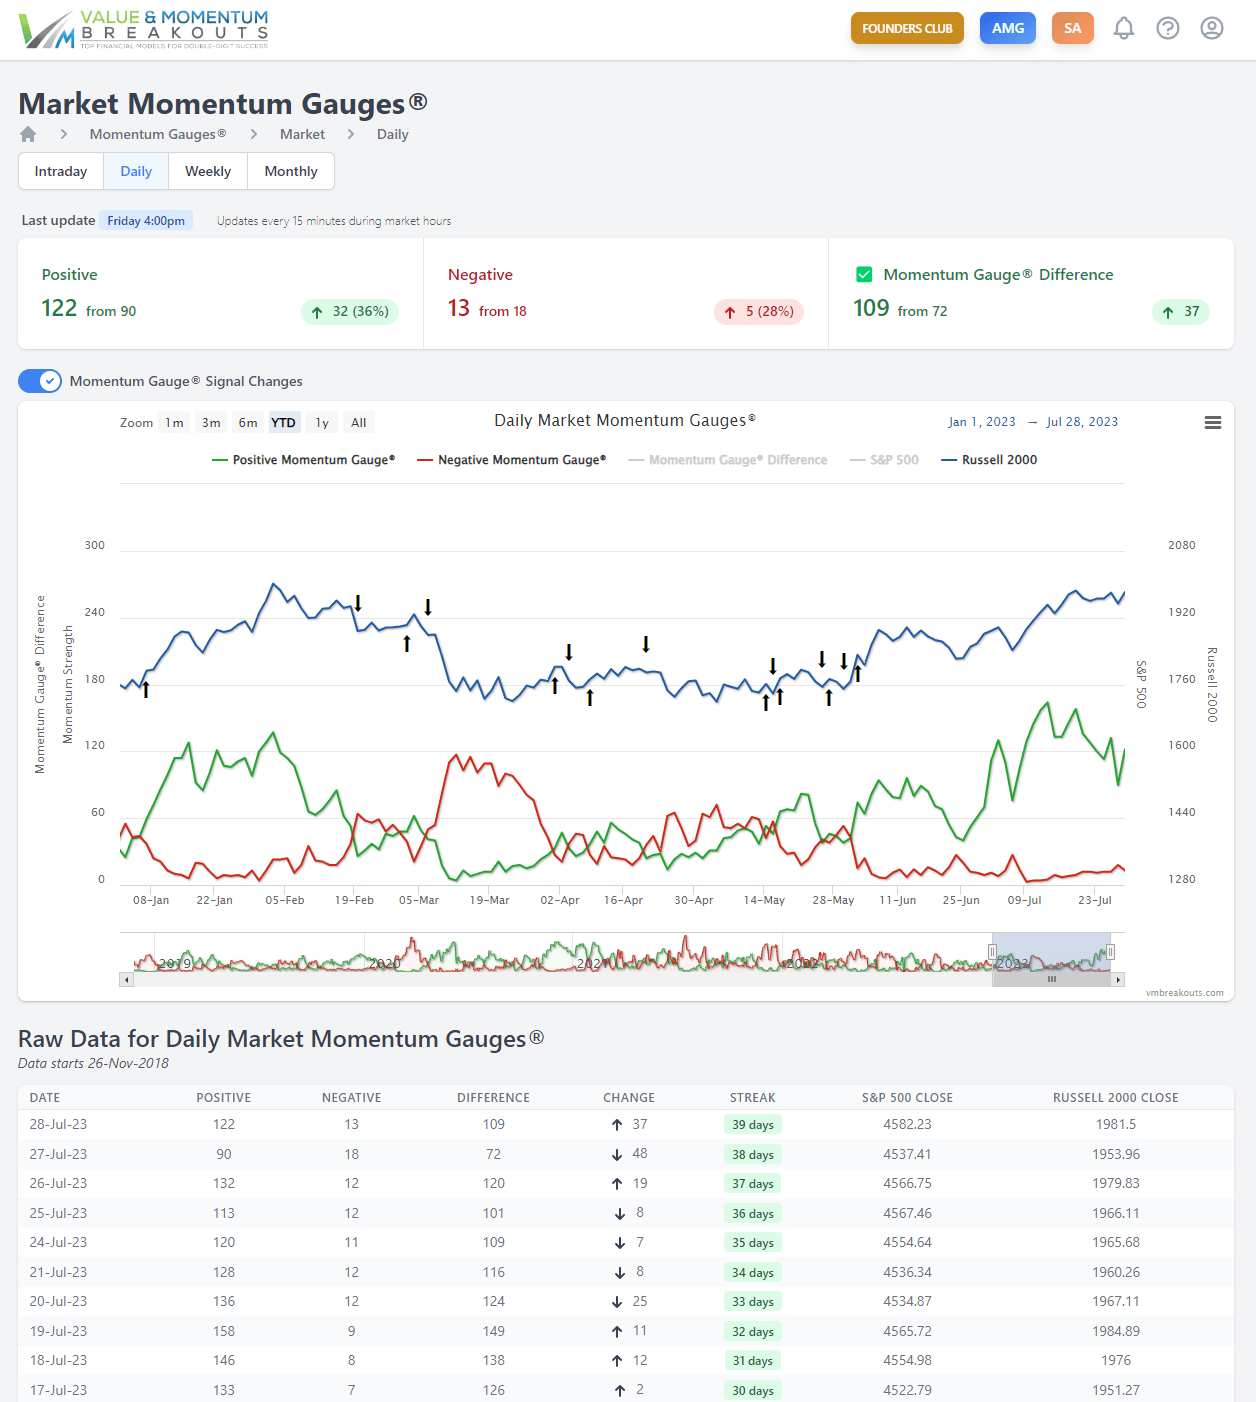
Daily Momentum Gauges continue positive with the recent July 13 peak reaching the highest levels since June 2021. Negative momentum values remain low with strong similarities to the January rally this year.
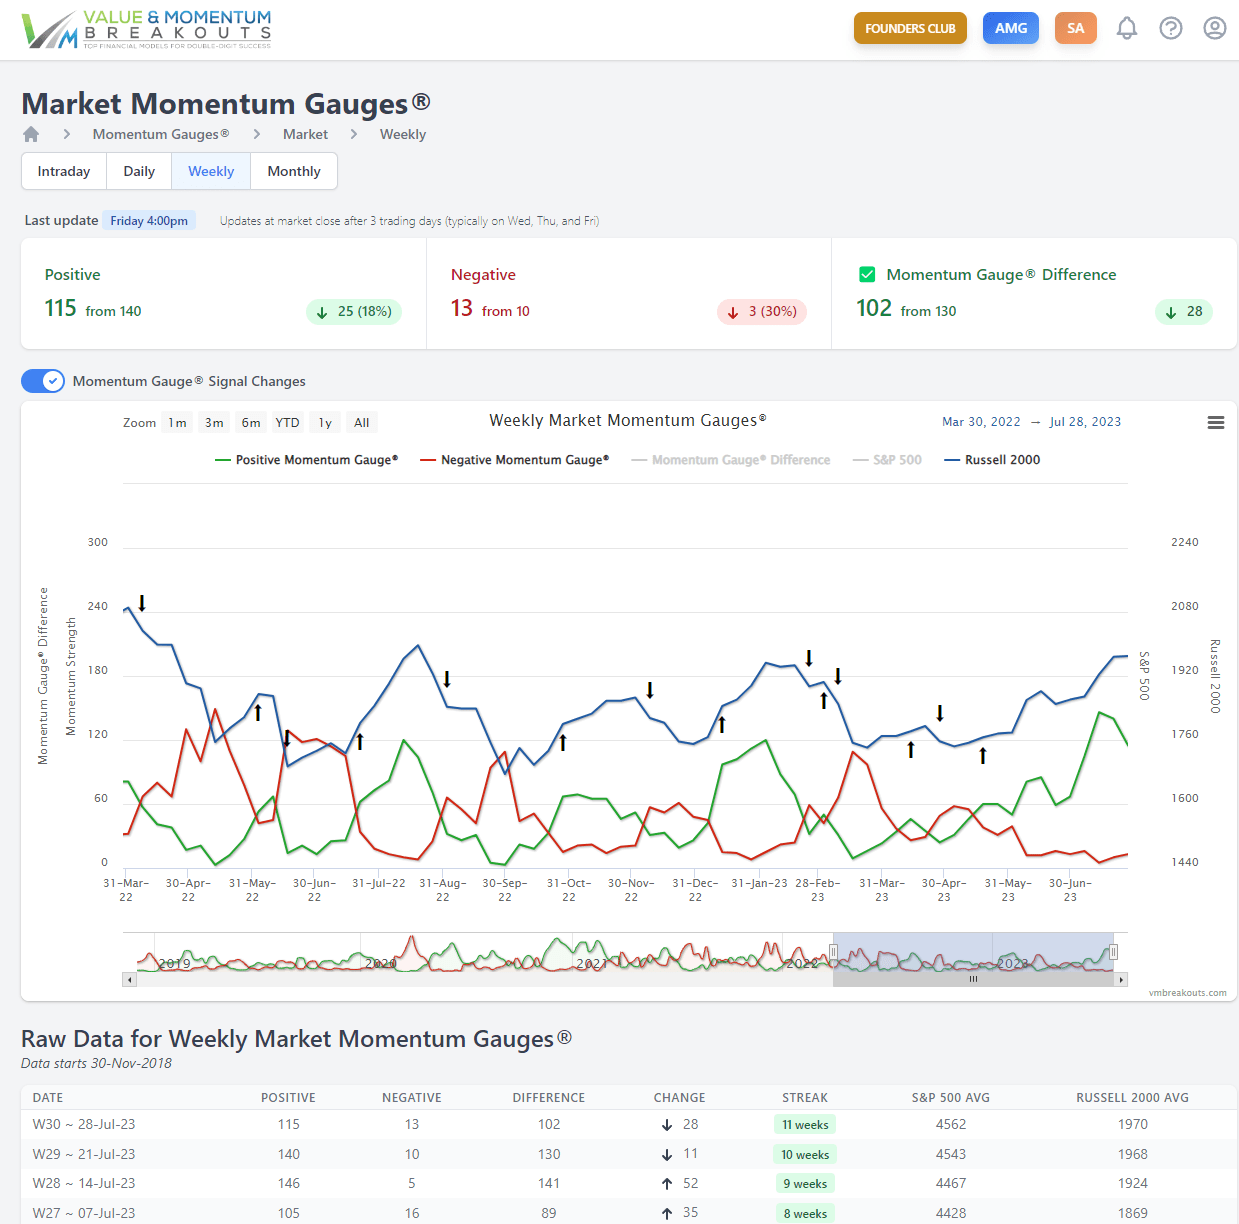
Weekly Momentum Gauges continue positive for 11 weeks in the longest positive run since March of 2021. This last week the gauges declined with rising negative momentum. We can see on the two-year chart below that weekly positive momentum peaked at 120 the last two market rallies and could be peaking again soon.
S&P 500 Daily Momentum Gauges continue positive near the highest levels since January with low negative values. This is the longest positive signal since November 2021 when it ended after 42 days.
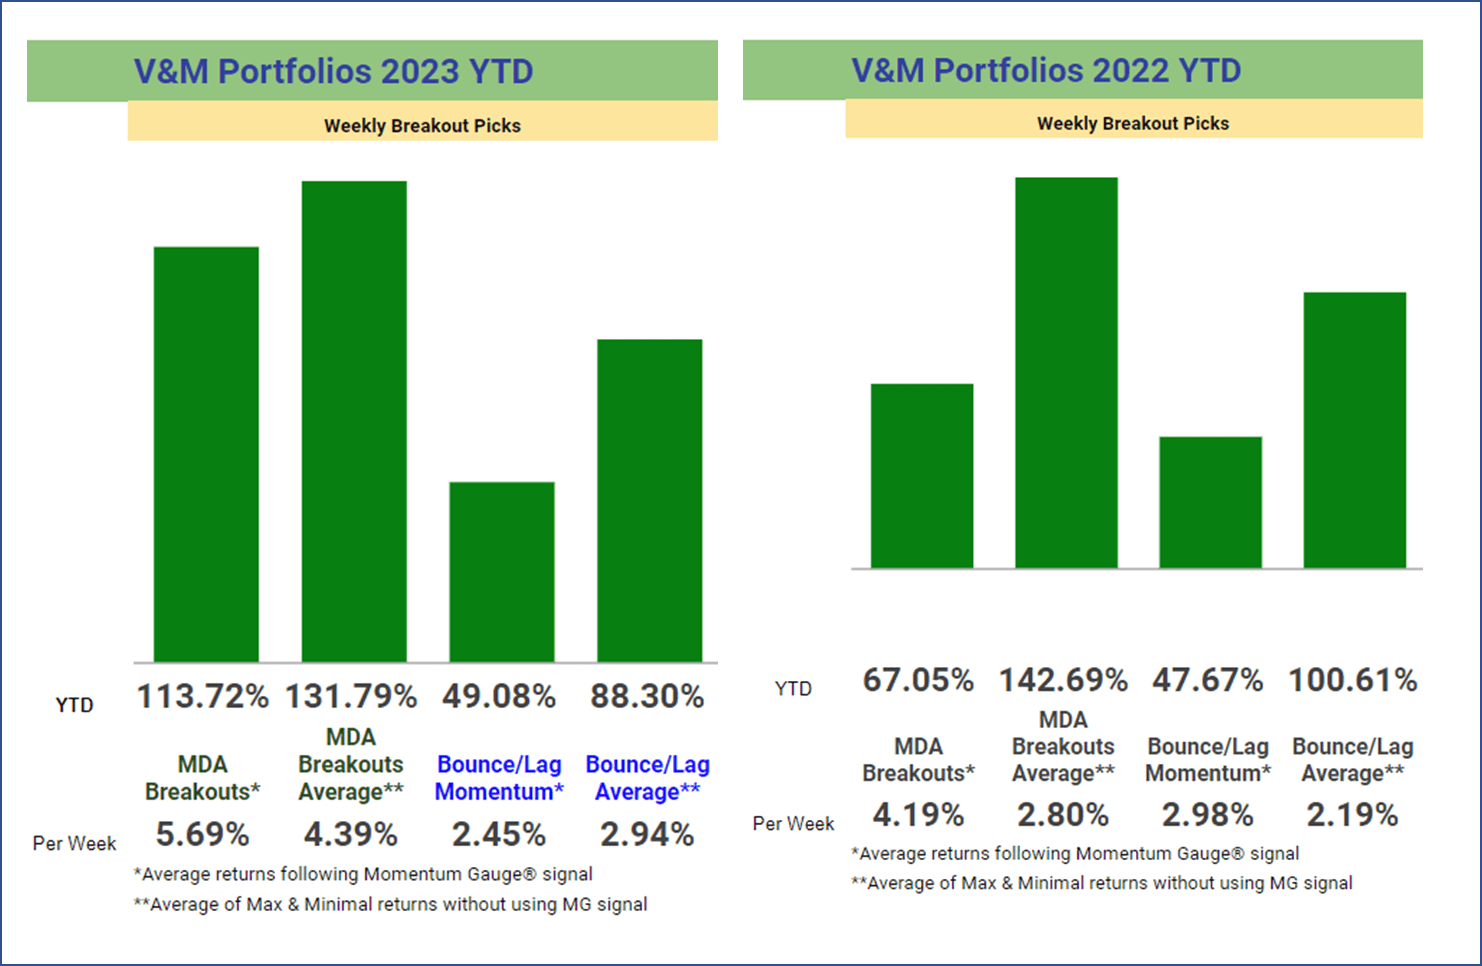
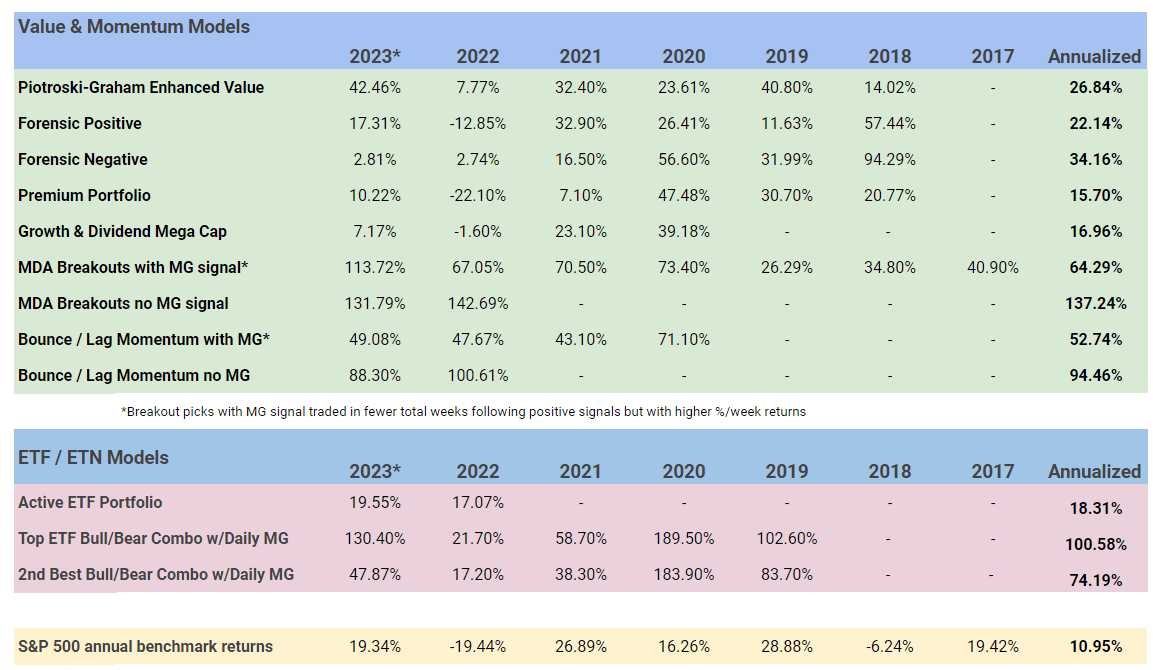
Weekly Breakout Returns
The ongoing competition between the Bounce/Lag Momentum model (from Prof Grant Henning, PhD Statistics) and MDA Breakout picks (from JD Henning, PhD Finance) are shown below with / without using the Momentum Gauge trading signal. The per-week returns equalize the comparison where there were only 16 positive trading weeks last year using the MDA trading signal (negative values below 40).
For 2022, the worst market since 2008: 113 MDA picks gained over 5%, 52 picks over 10%, 22 picks over 15%, and 13 picks over 20% in less than week . These are statistically significant high frequency breakout results despite many shortened holiday weeks.
V&M Multibagger List
VMBreakouts.com
While not the purpose of my model, longer term many of these selections may join the V&M Multibagger list is now at 150 weekly picks with over 100%+ gains, 67 picks over 200%+, 19 picks over 500%+ and seven weekly picks with over 1000%+ gains since January 2019 such as:
- Celsius Holdings ( CELH ) +3,037.8%
- Alexco Resources AXU +1,592.3%
- Super Micro Computer ((SMCI)) +1,323.4%
- Enphase Energy ( ENPH ) +1,015.9%
- Trillium Therapeutics TRIL +1008.7%
More than 450 stocks have gained over 10% in less than a week since this MDA testing began in 2017. Frequency comparison charts are at the end of this article. Readers are cautioned that these are highly volatile stocks that may not be appropriate for achieving your long term investment goals: How to Achieve Optimal Asset Allocation .
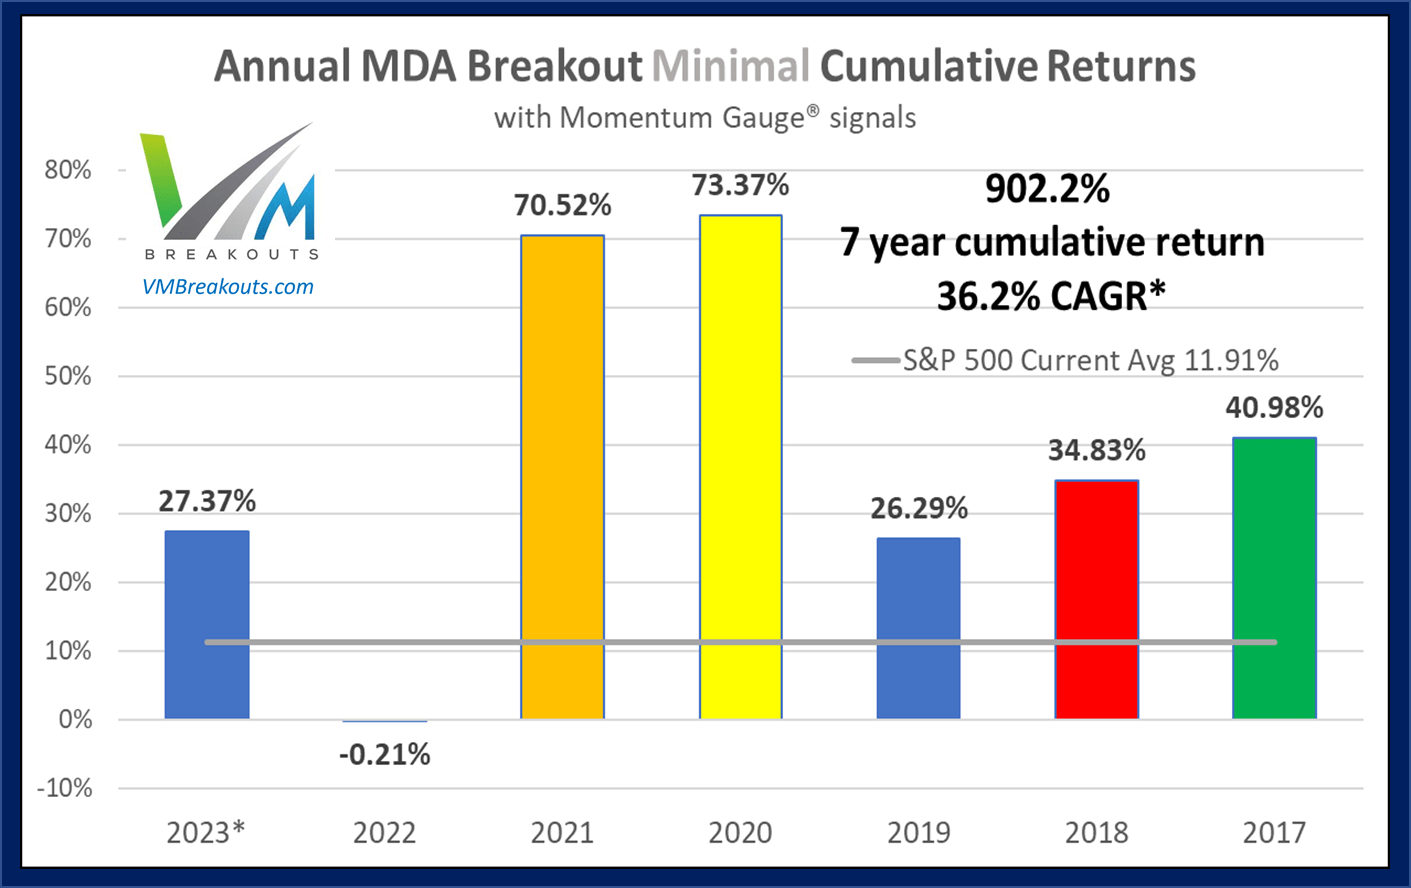
Historical Performance Measurements
Historical MDA Breakout minimal buy/hold (worst case) returns have a compound average growth rate of 36.2% and cumulative minimum returns of +902.2% from 2017. The minimal cumulative returns for 2022 were -0.21%, average cumulative returns were +67.05%, and the best case cumulative returns were +360.25%. The chart reflects the most conservative measurements adding each 52 minimal weekly return in an annual portfolio simulation, though each weekly selection could be compounded weekly.
The Week 31 - 2023 Breakout Stocks for next week are:
The MDA model selections for next week consist of two technology and two healthcare sector stocks. These selections are released in advance to members every Friday with strong current gains shown. It's not possible to duplicate published returns without member access to exclusive Friday morning release of all four selections. Prior selections may be doing well, but for research purposes only new selections are used each week. These selections are based on MDA characteristics from my research and documented best results occur when following the Momentum Gauges and signals.
- Ardelyx ( ARDX ) - Healthcare / Biotechnology
- Palantir Tech ( PLTR ) - Technology / Software - Infrastructure
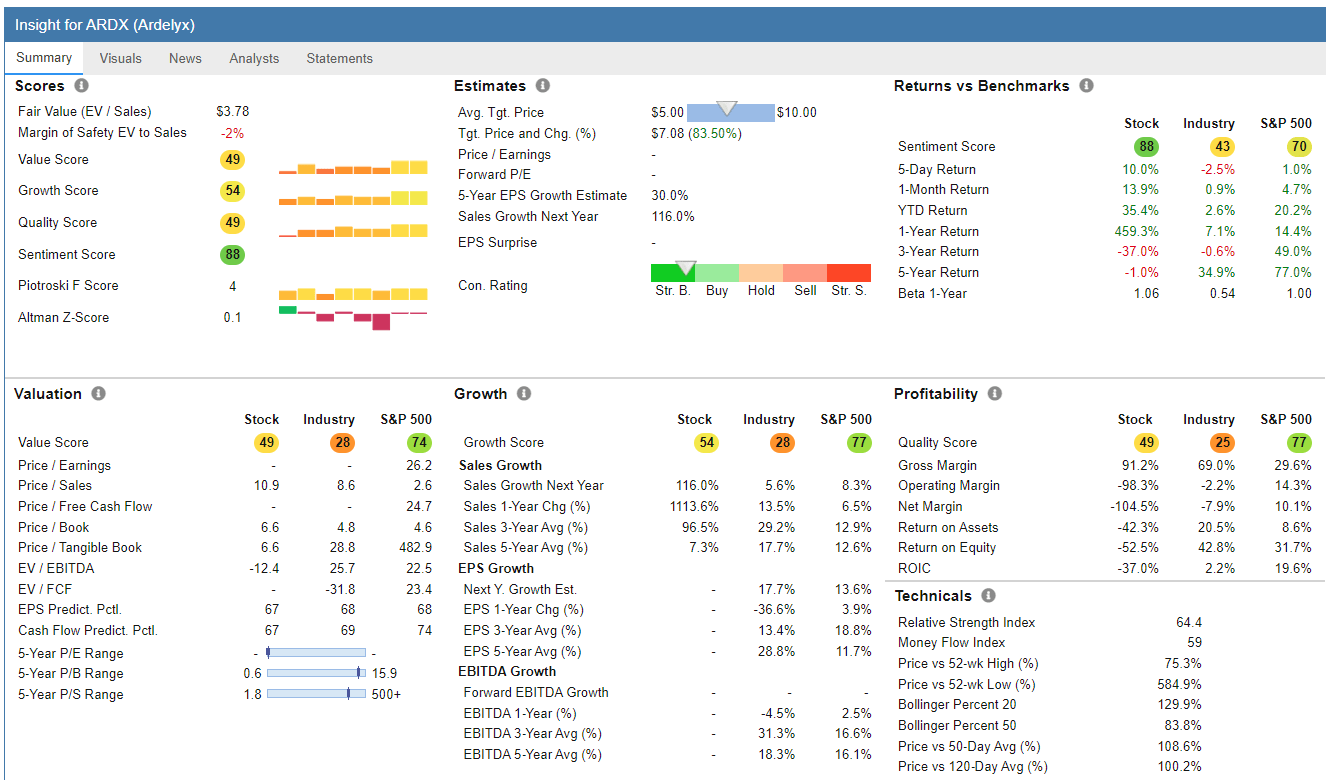
Ardelyx ((ARDX)) - Healthcare / Biotechnology
FinViz.com
Price Target: $5/share (Analyst Consensus + Technical See my FAQ #20)
| Jul-27-23 04:05PM |
| Ardelyx, Inc. Reports Employment Inducement Grants GlobeNewswire |
| Jul-26-23 07:55AM |
| Ardelyx to Report Second Quarter 2023 Financial Results on August 2, 2023 GlobeNewswire |
| Jul-20-23 04:05PM |
| Ardelyx to Present at the H.C. Wainwright 2nd Annual Kidney Conference GlobeNewswire |
| Jul-16-23 09:37AM |
| Loss-Making Ardelyx, Inc. (( ARDX ) ) Expected To Breakeven In The Medium-Term Simply Wall St. |
| Jul-13-23 08:00AM |
| Ardelyx Announces Acceptance of New Drug Application for Tenapanor for Hyperphosphatemia in China GlobeNewswire |
| Jun-29-23 04:09PM |
| Ardelyx, Inc. Reports Employment Inducement Grants GlobeNewswire |
(Source: Company Resources)
Ardelyx, Inc., a biopharmaceutical company, discovers, develops, and commercializes medicines to treat gastrointestinal and cardiorenal therapeutic areas in the United States and internationally. The company's lead product candidate is tenapanor for the treatment of patients with irritable bowel syndrome with constipation.
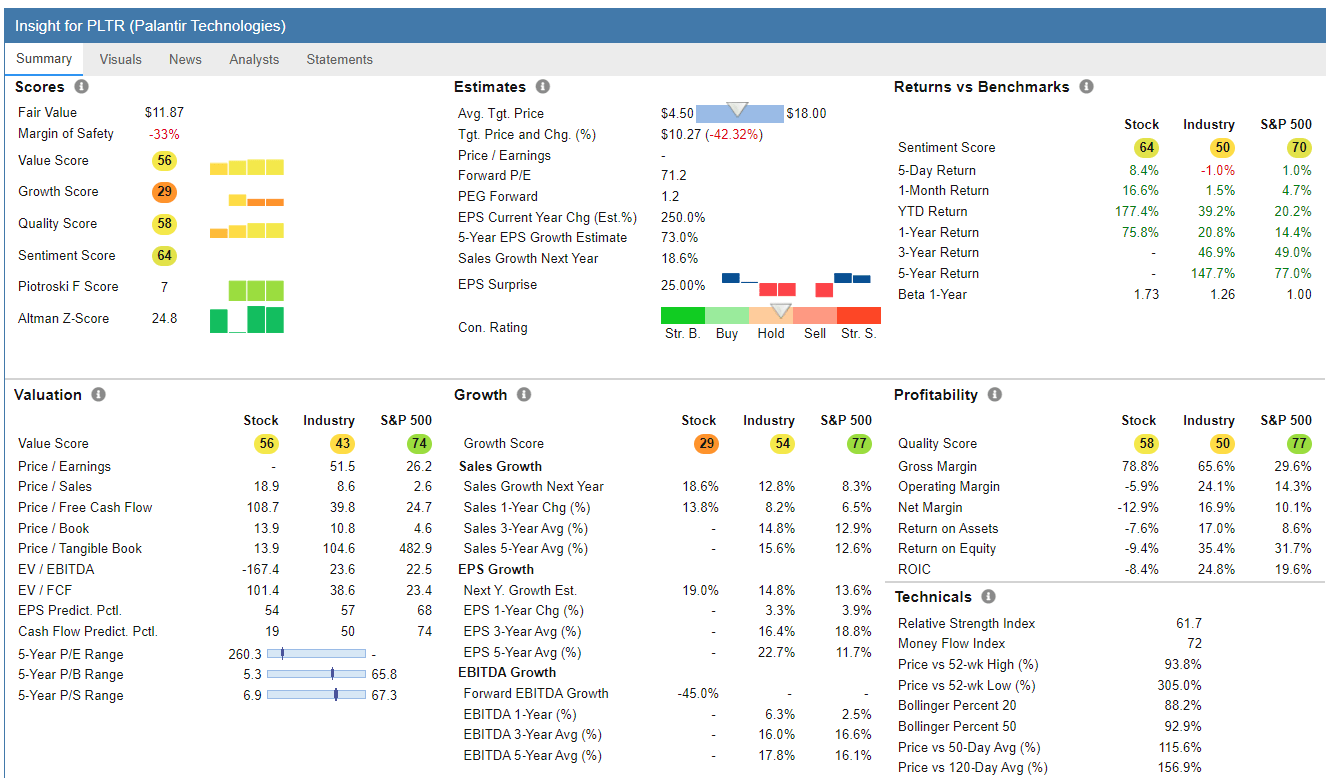
Palantir Tech ((PLTR)) - Technology / Software - Infrastructure
FinViz.com
Price Target: $22/share (Analyst Consensus + Technical See my FAQ #20)
| Jul-28-23 04:55PM |
| Inflation cooling, Palantir stock jumps, 'Barbie' box office haul: Friday's top stories Yahoo Finance Video +10.28% |
| 03:42PM |
| Why Palantir Technologies Stock Soared on Friday Motley Fool |
| 03:28PM |
| Top Analyst Dan Ives Has New Price Target On 'Messi of AI' Palantir TheStreet.com |
| 01:45PM |
| Is Palantir Stock A Buy On Its Artificial Intelligence Prospects? Investor's Business Daily |
| 11:43AM |
| Palantir Stock Spikes After Analyst Says to Buy The Messi of AI Barrons.com |
| 05:15AM |
| 3 No-Brainer Stocks I'd Buy Right Now Without Hesitation Motley Fool |
| Jul-27-23 07:15AM |
| Is Palantir Stock a Buy? Motley Fool |
| 04:00AM |
| Best Growth Stocks: Palantir vs. Cloudflare Motley Fool |
(Source: Company Resources)
Palantir Technologies Inc. builds and deploys software platforms for the intelligence community in the United States to assist in counterterrorism investigations and operations. The company provides Palantir Gotham, a software platform which enables users to identify patterns hidden deep within datasets, ranging from signals intelligence sources to reports from confidential informants, as well as facilitates the handoff between analysts and operational users, helping operators plan and execute real-world responses to threats that have been identified within the platform.
Top Dow 30 Stocks to Watch for Week 31
First, be sure to follow the Momentum Gauges when applying the same MDA breakout model parameters to only 30 stocks on the Dow Index. Second, these selections are made without regard to market cap or the below-average volatility typical of mega-cap stocks that may produce good results relative to other Dow 30 stocks. Third, until the June 1 positive MG signal the Dow has been the worst performing major index with negative returns into May.
| Week Picked |
| Symbol |
| Company |
| Return % |
| Week 30 |
| ( CVX ) |
| Chevron Corporation |
| 0.41% |
| Week 30 |
| ( AMGN ) |
| Amgen, Inc. |
| 0.67% |
| Week 29 |
| ( JPM ) |
| JPMorgan Chase & Co |
| 3.98% |
| Week 29 |
| ( UNH ) |
| UnitedHealth Group Inc |
| 8.92% |
| Week 28 |
| ( AAPL ) |
| Apple Inc |
| 2.54% |
| Week 28 |
| ( PG ) |
| Procter & Gamble Co |
| 3.13% |
| Week 27 |
| ( MSFT ) |
| Microsoft Corp |
| -0.34% |
| Week 27 |
| ( CSCO ) |
| Cisco Systems Inc |
| 0.50% |
| Week 26 |
| ( KO ) |
| Coca-Cola Co |
| 0.99% |
| Week 26 |
| PG |
| Procter & Gamble Co |
| 4.14% |
If you're looking for a much broader selection of large cap stocks, I recommend these long-term portfolios .
The long term buy/hold portfolios Piotroski-Graham, Positive Forensic, and Negative Forensic have all new mid-year portfolios released every July and tracked for the next two years.
2023 Piotroski-Graham enhanced value -
- New July portfolio +6.83%
- January portfolio +42.46% YTD
- 2022 January portfolio beat the S&P 500 by +32.54%
- New July mid-year portfolio -4.27%
- January portfolio +17.31% YTD
- January 2022 Positive Forensic beat S&P 500 by +6.59%
- New July mid-year portfolio +14.26%
- January portfolio +2.81% YTD
- January 2022 Negative Forensic beat S&P 500 by +22.18%
Growth & Dividend Long Term portfolios -
- New July mega cap long term portfolio +7.14%
- January portfolio +0.66% YTD
- January 2022 portfolio beat S&P 500 by +13.91%
The Dow pick for next week is:
Intel Corporation ( INTC )
The Intel breakout continues following strong Q2 earnings and guidance on July 27. Large bullish stair steps continue in the channel from March lows as comparative fundamental ratios to Nvidia ((NVDA)) remain at much healthier valuations.
FinViz.com
Background on Momentum Breakout Stocks
As I have documented before from my research over the years, these MDA breakout picks were designed as high frequency gainers.
These documented high frequency gains in less than a week continue into 2020 at rates more than four times higher than the average stock market returns against comparable stocks with a minimum $2/share and $100 million market cap. The enhanced gains from further MDA research in 2020 are both larger and more frequent than in previous years in every category. ~ The 2020 MDA Breakout Report Card
The frequency percentages remain very similar to returns documented here on Seeking Alpha since 2017 and at rates that greatly exceed the gains of market returns by 2x and as much as 5x in the case of 5% gains.
VMBreakouts.com
The 2021 and 2020 breakout percentages with four stocks selected each week.
MDA selections are restricted to stocks above $2/share, $100M market cap, and greater than 100k avg daily volume. Penny stocks well below these minimum levels have been shown to benefit greatly from the model but introduce much more risk and may be distorted by inflows from readers selecting the same micro-cap stocks.
Conclusion
This stock model continues the live forward-testing of the breakout selection algorithms from my doctoral research with continuous enhancements over prior years. These weekly MDA breakout picks consist of the shortest duration picks of seven quantitative models I publish from top financial research that also include one-year buy/hold value stocks.
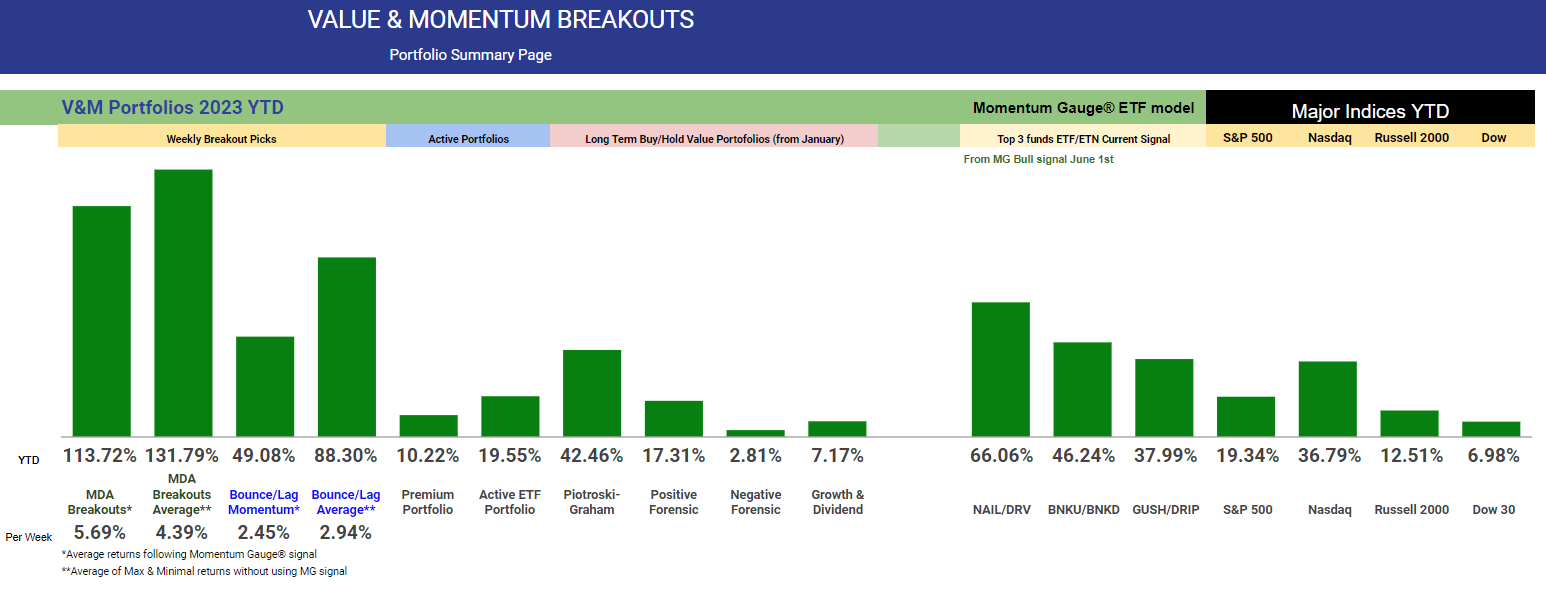
All the V&M portfolio models beat the market indices again last year with consistent outperformance of the major indices since 2017. Remember to follow the Momentum Gauges® in your investing decisions for the best results. YTD returns do not show the peak gains following the signals.
All the very best to you, stay safe and healthy and have a great week of trading!
JD Henning, PhD, MBA, CFE, CAMS
For further details see:
August MDA Breakout Stocks Week 31 - 2023: High-Frequency Gainers To Give You An Edge