USOI - August Non-OPEC And World Oil Production
2023-12-14 04:29:00 ET
Summary
- August Non-OPEC oil production dropped by 71 kb/d to 51,401 kb/d. The largest decreases came from Kazakhstan, Brazil and Russia.
- The STEO is forecasting that Canadian production will drop by 127 kb/d in September due to fires in Alberta this past summer.
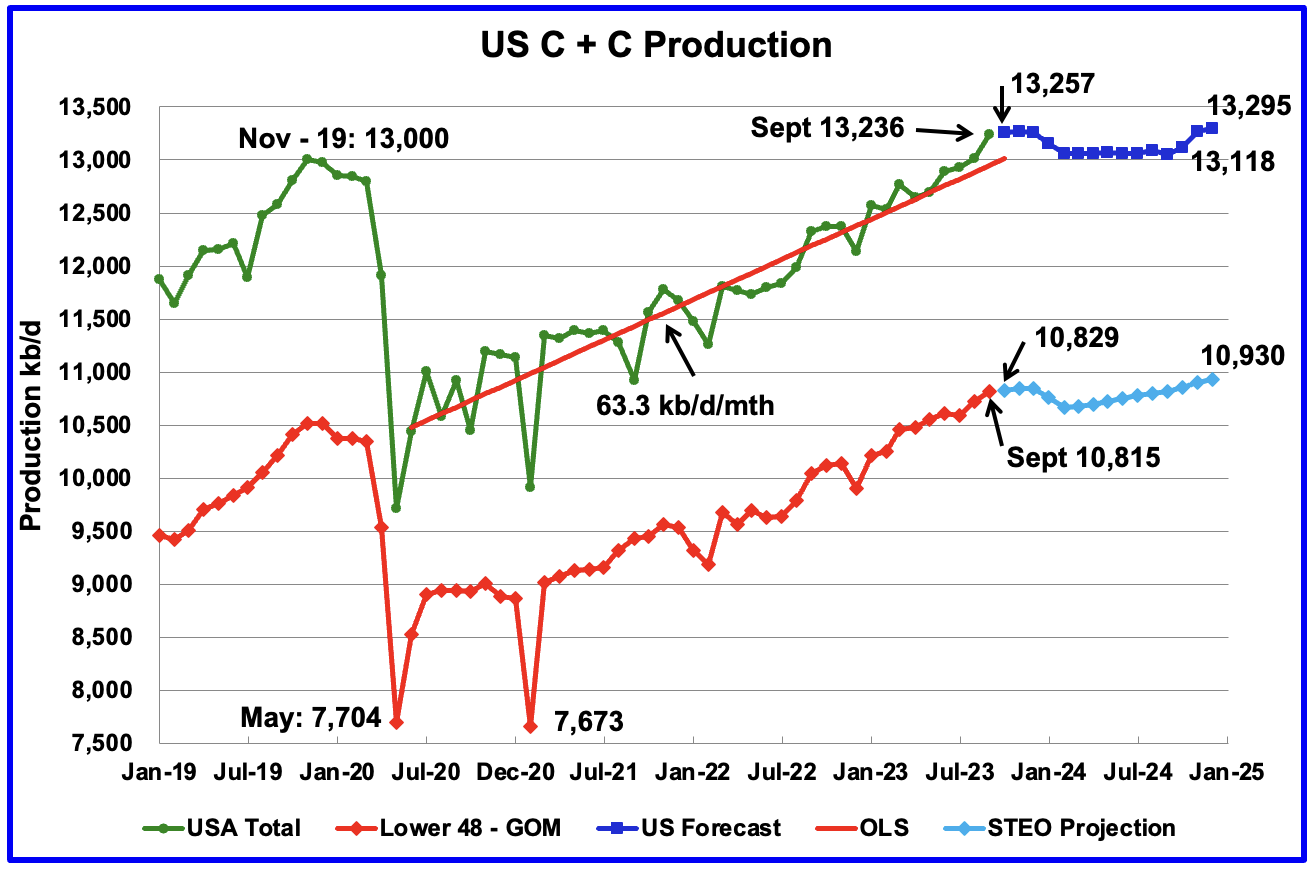
- U.S. September oil production increased by 224 kb/d to 13,236kb/d as reported in the previous post.
A guest post by Ovi
The EIA International Energy Statistics had a reporting hiatus from its May 2023 report to July 2023. They have restarted their reports with the August update. This report updates the POB reports and charts posted for May, June and July.
Below are a number of Crude plus Condensate (C + C) production charts, usually shortened to “oil”, for Non-OPEC countries. The charts are created from data provided by the EIA’s International Energy Statistics and are updated to August 2023. This is the latest and most detailed world oil production information available. Information from other sources such as OPEC, the STEO and country specific sites such as Russia, Brazil, Norway and China is used to provide a short term outlook for future output and direction for a few of these countries and the world.
World oil production and projection charts are presented at the end of this post.
August Non-OPEC oil production dropped by 71 kb/d to 51,401 kb/d. The largest decreases came from Kazakhstan, Brazil and Russia.
Using data from the December 2023 STEO, a projection for Non-OPEC oil output was made for the period September 2023 to December 2024. (Red graph). Output is expected to reach 52,679 kb/d in December 2024, which is 249 kb/d higher than the December 2019 peak of 52,430 kb/d. The current December 2024 output of 52,679 kb/d was revised lower by 407 kb/d than forecast in the November 2023 STEO.
From September 2023 to December 2024, oil production in Non-OPEC countries is expected to increase by 728 kb/d. According to the STEO, the major contributors to the increase are expected to be the Russia, Norway and Canada.
August Non-OPEC W/O US production dropped by 165 kb/d to 38,348 kb/d. September production is projected to increase by 366 kb/d.
From September 2023 to December 2024, production in Non-OPEC countries W/O the US is expected to increase by 670 kb/d.
Note that December 2024 output is lower than the 39,561 kb/d high in January 2020 by 177 kb/d.
Non-OPEC Oil Production Ranked by Country
Listed above are the World’s 10 largest Non-OPEC producers. The criteria for inclusion in the table is that all of the countries produce more than 1,000 kb/d.
August’s production increase for these ten Non-OPEC countries was 3 kb/d while as a whole the Non-OPEC countries saw a production decrease of 71 kb/d.
In August 2023, these 10 countries produced 83.8% of all Non-OPEC oil production.
OPEC’s C + C production decreased by 244 kb/d in August while YoY it decreased by 2,279 kb/d . World MoM production decreased by 315 kb/d while YoY output decreased by 773 kb/d.
Non-OPEC Oil Production Charts
The EIA reported that Brazil’s production decreased by 51 kb/d in August to 3,462 kb/d.
Brazil’s National Petroleum Association (BNPA) reported that output in September increase by 210 kb/d to 3,672 kb/d followed by a 131 kb/d drop in October. According to the November MOMR, September output increased mainly due to ramp-ups at four offshore platforms and less maintenance.
The December MOMR report does not provide any explanation for the October drop. However for 2024, the MOMR states: “Crude oil output is expected to increase through production ramp-ups in the Buzios (Franco), Mero (Libra NW), Tupi (Lula), Peregrino and Itapu (Florim) fields. Oil project start-ups are expected at the Atlanta, Pampo-Enchova Cluster and Vida sites.”
Production from the off-shore “pre-salt” region has been added to the Brazil chart, blue markers. October production dropped by 108 kb/d to 2,722 kb/d, which accounts for most of the 131 kb/d overall decrease in Brazil’s October output.
Much of Brazil’s upcoming 2023 production growth will come from the highly productive pre-salt fields. From March 2023 to September 2023, production from the pre-salt fields increased by 467 kb/d.
According to the EIA, Canada’s production increased by 40 kb/d in August to 4,682 kb/d.
The STEO is forecasting that Canadian production will drop by 127 kb/d in September due to fires in Alberta this past summer.
The Terra Nova Floating Production Storage and Offloading unit (FPSO) restarted production in November according to this source and will add 27 kb/d to Canada’s oil output.
This chart shows the post pandemic trend in bitumen production in Alberta according to data provided by the Canada Energy Regulator . Production from April 2023 to July 2023 was affected by severe weather and plant maintenance.
According to the December OPEC MOMR report: Crude bitumen production output rose in October by 56 tb/d, m-o-m, while synthetic crude increased by 45 tb/d, m-o-m. Taken together, crude bitumen and synthetic crude production rose by 101 tb/d to 3.3 mb/d.
The TMX pipeline continues to be plagued by problems. It has encountered “very challenging” construction conditions due to the hardness of the rock in a mountainous area between Hope and Chilliwack. The Canada Energy Regulator has not approved a variance request to use a smaller diameter pipe in that part of the route. Denying the variance request would likely add an extra 55 to 60 days to the construction schedule.
The delay could push the startup date to late Q2-23 or early Q3-23.
The EIA reported China’s oil output in August rose by 37 kb/d to 4,114 kb/d.
The China National Bureau of Statistics reported that output dropped in September to 4,103 kb/d.
Every January for the last four years, China’s production has taken a massive increase. In 2022 production jumped by 322 kb/d from December 2021 to February 2022. However according to the November/December MOMR: For 2024, Chinese liquids production is expected to remain steady at the 2023 level of 4.6 m/d.
While China’s production growth has risen steadily since 2018, it may be approaching its post pandemic high as inferred by the November MOMR.
According to the EIA, Kazakhstan’s output decreased by 53 kb/d in August to 1,701 kb/d.
The STEO is forecasting that production will rebound in October to 1,912 kb/d.
The December MOMR is reporting that “Crude production was up by 37 tb/d, m-o-m, to average 1.6 mb/d. NGL and condensate output rose by 17 tb/d, m-o-m, to average 0.3 mb/d.”
Mexico’s production in August and September was 1,943 kb/d an increase of 24 kb/d from July’s 1,919 kb/d.
According to Pemex, Mexico’s oil production from August to October was relatively flat. October output was 1,927 kb/d, 8 kb/d higher than July.
Mexico has recently revised its definition of condensate. This has resulted in the EIA adding an extra 64 kb/d, on average, to the Pemex report. The red markers include the additional 64 kb/d.
According to the December MOMR for 2024: “ Pemex’s total crude production decline in mature areas like Ku-Maloob-Zaap and Integral Yaxche-Xanab is forecast to outweigh production ramp-ups in Area-1 and El Golpe-Puerto Ceiba, and from a few start-ups, namely TM-01, Paki and AE-0150-Uchukil.
The EIA reported Norway’s August production dropped to 1,813 kb/d.
Separately, the Norway Petroleum Directorate ((NPD)) reported that September’s production dropped to 1,659 kb/d and then rebounded to 1,798 kb/d in October. (Red markers). The September drop was due to unplanned shut down and equipment failure on a number of platforms.
According to the NPD : “Oil production in October was 3.7 percent lower than the NPD’s forecast and 0.7 percent lower than the forecast so far this year.”
Oman’s production rose very consistently since the low of May 2020. However production began to drop in November 2022. According to the EIA, August’s output rose by 3 kb/d to 1,041 kb/d.
Qatar’s August’s output was unchanged at 1,322 kb/d, possibly due to lack of updated information.
The EIA reported Russia’s August C + C production was 9,935 kb/d. Using data from the November STEO report, Russian output is expected to increase to 10,016 kb/d in November, orange markers. There is no sign that Western sanctions are affecting Russian oil production.
Using data from previous Argus Media reports, Russian crude production is shown from May 2023 to November 2023. For November, Argus reported that Russian crude production was 9,500 kb/d, a decrease of 30 kb/d from October, blue markers. Adding 8% to Argus’ November crude production provides a C + C production estimate of 10,292 kb/d, which is a proxy for the Pre-War Russian Ministry estimate, red markers.
Comparing the Argus crude data with the latest STEO projection indicates that the EIA estimate for Russian C + C is between the Argus estimates for Crude and C + C. Prior to the war, the Russian Ministry estimate was always 404 kb/d higher than the EIA estimate for C + C. The current November Russia Proxy output is 244 kb/d higher that the EIA’s estimate.
The November IEA OMR agrees with Argus that Russian crude production in October was 9,530 kb/d .
U.S. September oil production increased by 224 kb/d to 13,236kb/d as reported in the previous post. However the 2024 production projections reported in the previous post have been updated in this post.
The dark blue graph, taken from the December 2023 STEO, is the forecast for U.S. oil production from October 2023 to December 2024. Output for December 2024 is expected to reach 13,295 kb/d which is 145 kb/d lower than forecast last month and marginally higher than September 2023 .
While overall US oil production increased by 224 kb/d, the Onshore L48 had a production increase of 91 kb/d to 10,815 kb/d in September. Most of the 91 kb/d came from North Dakota, 79 kb/d.
The light blue graph is the STEO’s projection for output to December 2024 for the Onshore L48. From October 2023 to December 2024, production is expected to increase by 101 kb/d to 10,930 kb/d.
These six countries complete the list of Non-OPEC countries with annual production between 500 kb/d and 1,000 kb/d. Note that the UK has been added to this list since its production has been below 1,000 kb/d since 2020 and fell to a new low of 573 kb/d in August.
Their combined August production was 3,724 kb/d, down 122 kb/d from July.
The overall output from the above six countries has been in a slow steady decline since 2014 and appears to have accelerated after 2019.
A Different Approach to World Oil Production
Instead of dividing the World oil producing countries into OPEC and Non-OPEC, this section divides the countries into two groups on the basis of their production capacity. The division will be The Big Three, US, Saudi Arabia and Russia, and the Rest, i.e. the World oil producers W/O the Big 3. The top producer in the Rest, currently Canada, produces less than half of the lowest producer in the Big Three.
Peak production in the Big 3 occurred in April 2020 at 34,739 kb/d. The peak was associated with a large production increase from Saudi Arabia. Post covid, production peaked at 33,896 kb/d in September 2022. The production drop since then is due to cutbacks within the OPEC + countries.
August production from the Big 3 was down 426 kb/d to 31,888 kb/d and down by 2,000 kb/d from September 2022.
Production in the Rest has been slowly increasing since the low of September 2020, 43,039 kb/d. In February 2023 production rose to a post covid high 49,221 kb/d. Output in August 2023 was 48,812 kb/d.
World Oil Production Ranked by Country
Above are listed the World’s 12th largest oil producers. In August 2023, these 12 countries produced 76.6% of the world’s oil. World oil production dropped by 773 kb/d on a YoY basis. On a MoM basis, OPEC’s production decreased by 244 kb/d while on a YoY basis its production decreased by 2,279 kb/d.
World Oil Production Projection
World oil production decreased by 315 kb/d in August, green graph. The largest decrease came from Saudi Arabia 470 kb/d while Iran added 170 kb/d.
This chart also projects World C + C production out to December 2024. It uses the December 2023 STEO report along with the International Energy Statistics to make the projection. (Red markers). Note that December 2024 production is lower than February 2023.
The red graph forecasts that World crude production in December 2024 will be 82,390 kb/d and is 2,190 kb/d lower than the November 2018 peak. Note the large production increase in the first half of 2024 could be the EIA’s expectation that OPEC + would be restoring some of their production cuts. However this is contrary to OPEC’s promised production cuts made on November 30, 2023.
World without the US oil output in August decreased by 409 kb/d to 67,647 kb/d. A rebound in production is expected in September. Note that December 2024 output of 69,095 kb/d is 3,648 kb/d lower than October 2018 output of 72,743 kb/d and lower than February 2023 .
World oil production W/O the U.S. from September 2023 to December 2024 is forecast to increase by a total of 518 kb/d.
Decline Rates
This chart shows the overall decline rate of 51 Small oil producing countries. It used to track 52 countries. However Nigeria has been growing production recently and it has been removed. These countries were chosen primarily because they were small to medium size producers that did not reinvest much of their cashflow to keep increasing production and had a longish history of being in a slow decline.
The OLS line is based on production from January 2006 to August 2022. It has not been updated since August 2022 to see if the production from these countries would break away from the calculated line. It appears that it has broken away since a number of them have had small increases, <10 kb/d, over the last year, August 2022 to August 2023. Also Argentina and Gabon have been increasing production over the past year.
As a percentage of the starting production rate of 19,500 kb/d in January 2006, the 475 kb/d/yr decline rate is 2.4%. If an average yearly decline rate of 2% occurs in all fields, this implies that a yearly decline rate of 1,650 kb/d across all World fields has to be made up by infill drilling. Saudi Arabia says their decline rate is 8% and infill drilling reduces it to 2%.
“Without “maintain potential” drilling to make up for production, Saudi oil fields would have a natural decline rate of a hypothetical 8%.”
Editor's Note: The summary bullets for this article were chosen by Seeking Alpha editors.
For further details see:
August Non-OPEC And World Oil Production