VT - Avantis US Small Cap Value: My 2024 Answer To Overvalued Large Cap Tech Growth
2023-12-27 05:47:51 ET
Summary
- Fama and French introduced the 3-factor and 5-factor models, which include additional factors such as size, value, profitability, and investment returns.
- AVUV does a fantastic job capturing this research and implementing it in a low-cost fund.
- This investment strategy requires high conviction, and it may be best as an addition to the portfolio to "tilt" to a small cap value direction.
An Alternate Option
It's no secret a large majority of the market includes large cap, tech, and growth stocks. I personally believe these companies are overvalued and am in search of better deals. One of my favorite plays for 2024 is factor-based investing in small cap value stocks and ETFs. A great play for this is Avantis US Small Cap Value ETF (AVUV). I believe AVUV implements a sound strategy to factor-based investing that could outperform major indices.
To understand why this strategy is likely to do well, I believe it's important to understand the basis on which the asset decisions are made. In this article, I will cover the capital asset pricing model as it relates to the Fama French factors and provide empirical research of expected returns. The decision to invest in AVUV requires high conviction in this evidence.
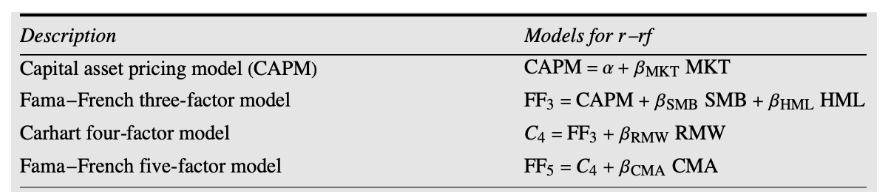
Capital Asset Pricing Model
Asset pricing models are often a function of the efficient market hypothesis, which states asset prices reflect all available information. Expected returns are related to risk, which is a function of pricing. This can be described through the Capital Asset Pricing Model ("CAPM"), which identifies the sensitivity between an asset to the risk of the overall market. The factor used in this model is the market beta. A beta of 1 would be a market cap-weighted index fund such as the S&P 500 or a total world index. Beta is a regression factor of historical price movements compared to the desired index. An asset with a beta of 2 would go up 20% when an asset of beta 1 goes up 10%. Conversely, an asset with a beta of 2 would go down 20% if an asset of beta 1 goes down 10%. A portfolio can have an overall beta as well. Such an example would be a portfolio of 50% cash and 50% index, which would exhibit a Beta of 0.5. A form of calculating the expected return of an asset, given its risk, and a single Beta factor is as follows:
CAPM Formula (Investopedia)
In this form, there is only one Beta - the market beta or market risk. For some time, this used to be all you needed to know to describe how average returns of assets differed from one another. The CAPM has been argued by many, and some have dedicated time to find anomalies that disprove the CAPM and efficient market hypothesis ("EMH") in general. Two of those people are Eugene Fama and Kenneth French, who adopted the 3-factor and 5-factor model.
Fama French Factors
French and Fama explained there is more than one beta, or factor, that can explain the differences of expected returns in portfolios. Five of the major factors are the following:
Market Risk premium - MRP (Described through CAPM)
- MRP is the difference between the expected return on a market portfolio and the risk-free rate.
Size premium - SMB (Small minus Big)
- SMB is the excess return that small capitalization companies return versus large companies.
Value Premium - HML (High minus Low)
- HML is the difference in returns between value stocks and growth stocks. This argues companies with high book-to-market ratios, or value stocks, outperform those with lower book-to-market values, known as growth stocks.
Profitability - RMW (Robust minus Weak)
- RMW compares the returns of firms with high operating profitability and those with low operating profitability.
Investment returns - CMA (Conservative minus aggressive) (gross profits-to-assets)
- CMA gauges the difference between companies that invest aggressively and those that do so more conservatively.
The way to express this is a modification of the CAPM equation to account for the different premiums.
Overview of Factor Models (The Mathematica Journal)
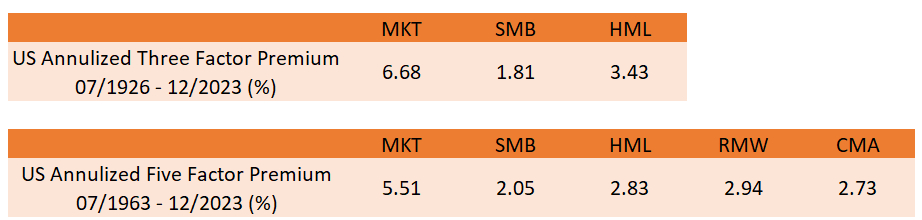
We can then jump over to the Ken French Data Library and download factor premiums over the years into an Excel list. From there, I annualized returns for the three-factor premium and five-factor model premium to understand how each one has performed over the decades.
Factor Premium (Complied By Author from Ken French Data Library)
From 07/1926 to 12/2023, the Market Factor (long stock market and short one-month US treasury) has a premium of 6.68%. In other words, the stock market has beaten treasury bills by providing 6.68% extra return per year on average. The SMB factor has a premium of 1.81%, meaning small cap stocks have beat large cap stocks by providing 1.81% extra return per year on average. The same logic applies to the HML as well. Companies with high book-to-market ratios, or value stocks, have beaten growth stocks by providing a 3.43% premium.
From 07/1963 to 12/2023, stocks outperformed bonds by 5.51%, small caps outperformed large caps by 2.05% and value stocks outperformed growth stocks by 2.83%. However, this model contains two more factors. RMW factors of 2.94% mean companies with high operating profitability beat those and those with low operating profitability 2.94% of the time on average. And finally, the CMA factor says companies who invest conservatively outperform those that invest aggressively 2.73% of the time on average.
My takeaway from this information proves common sense. For HML, I believe value premium intuitively makes sense. Although that hasn't been the case over the last couple decades as growth stocks have outperformed, I believe as time approaches infinity, the fundamentals of investing are to buy something undervalued and sell when it's overvalued. The same can be said about RMW. It intuitively makes sense that companies with higher margins will perform better than those with low on average. And with CMA, a slow, calculated approach to investing makes sense rather than aggressively throwing something at the wall and hoping it sticks. And in a capital market, stocks inherently make sense to return better than bills since good returns drive motivation and motivation drives good returns.
Based on this evidence, one could come to the conclusion:
What if I found all the small cap stocks in the US, filtered those trading at low valuations, and applied a quality screen looking at operating profitability and investment returns? Surely, I could beat the market, right?
Well, I cannot say the second question will be true, but I do know there is one fund that does a tremendous job and uses factor-based, also known as evidence or empirical research-based investing to develop ETFs for believers in this logic. Enter Avantis Investors.
Avantis
Avantis Investors' establishment was in 2019. Prior to this, Dimensional Fund Advisors ("DFA") was one of the only ways to be exposed to a factor-based approach investing strategy. DFA's funds were primarily only available through mutual funds if your advisor had access to it. Now, Avantis has sought what the public wanted and offered publicly traded ETFs, so everyone can get access to it. Avantis was founded by those who worked at DFA and studied under those who sought factor-based investing, so when it comes to experience and qualifications, you cannot get any better than Avantis. They now offer many different ETFs depending on how you would like to tilt your portfolio, however, I'd like to focus on one fund that I think has tremendous upside not only in 2024 but for a lifetime. That fund is the Avantis US Small Cap Value ETF .
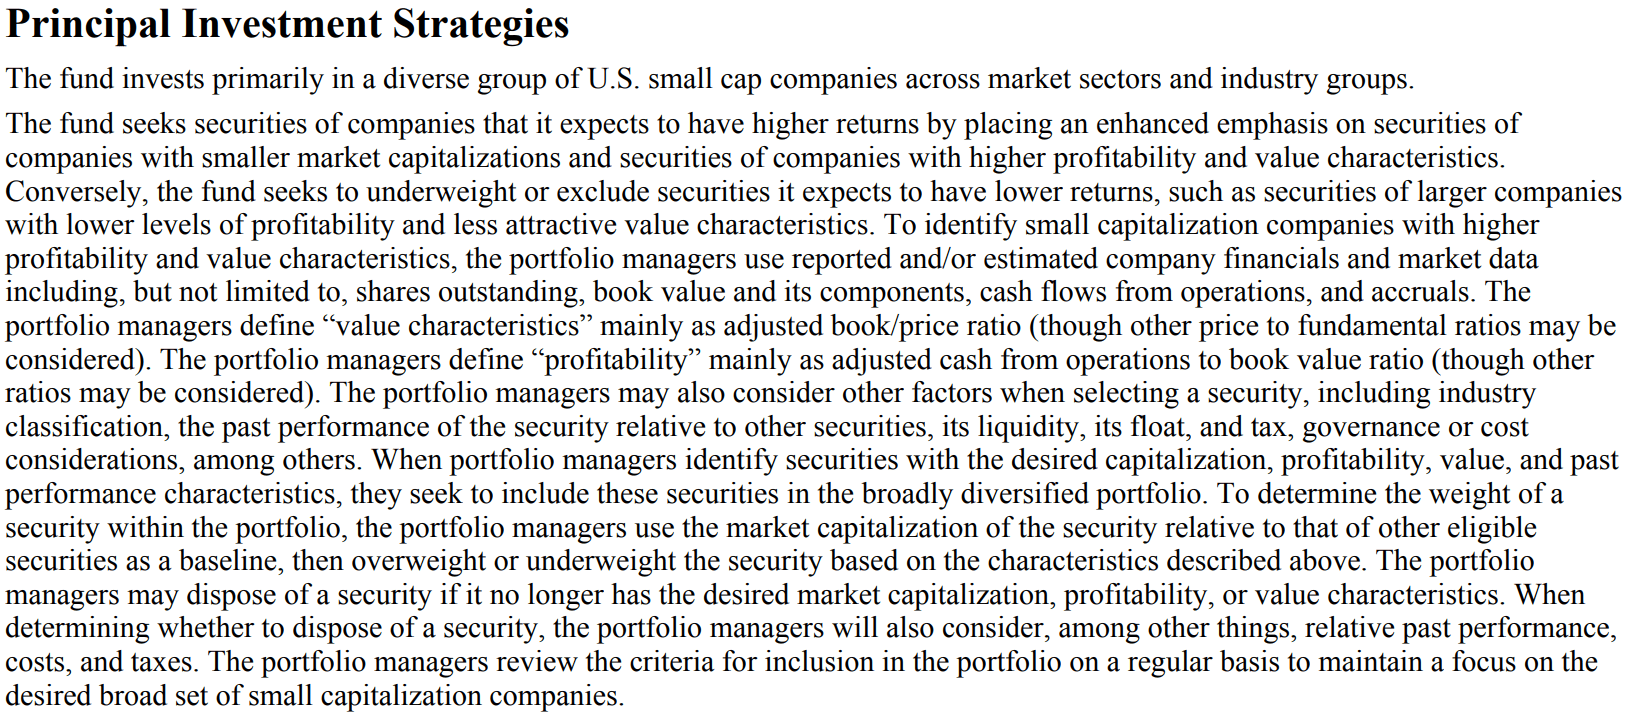
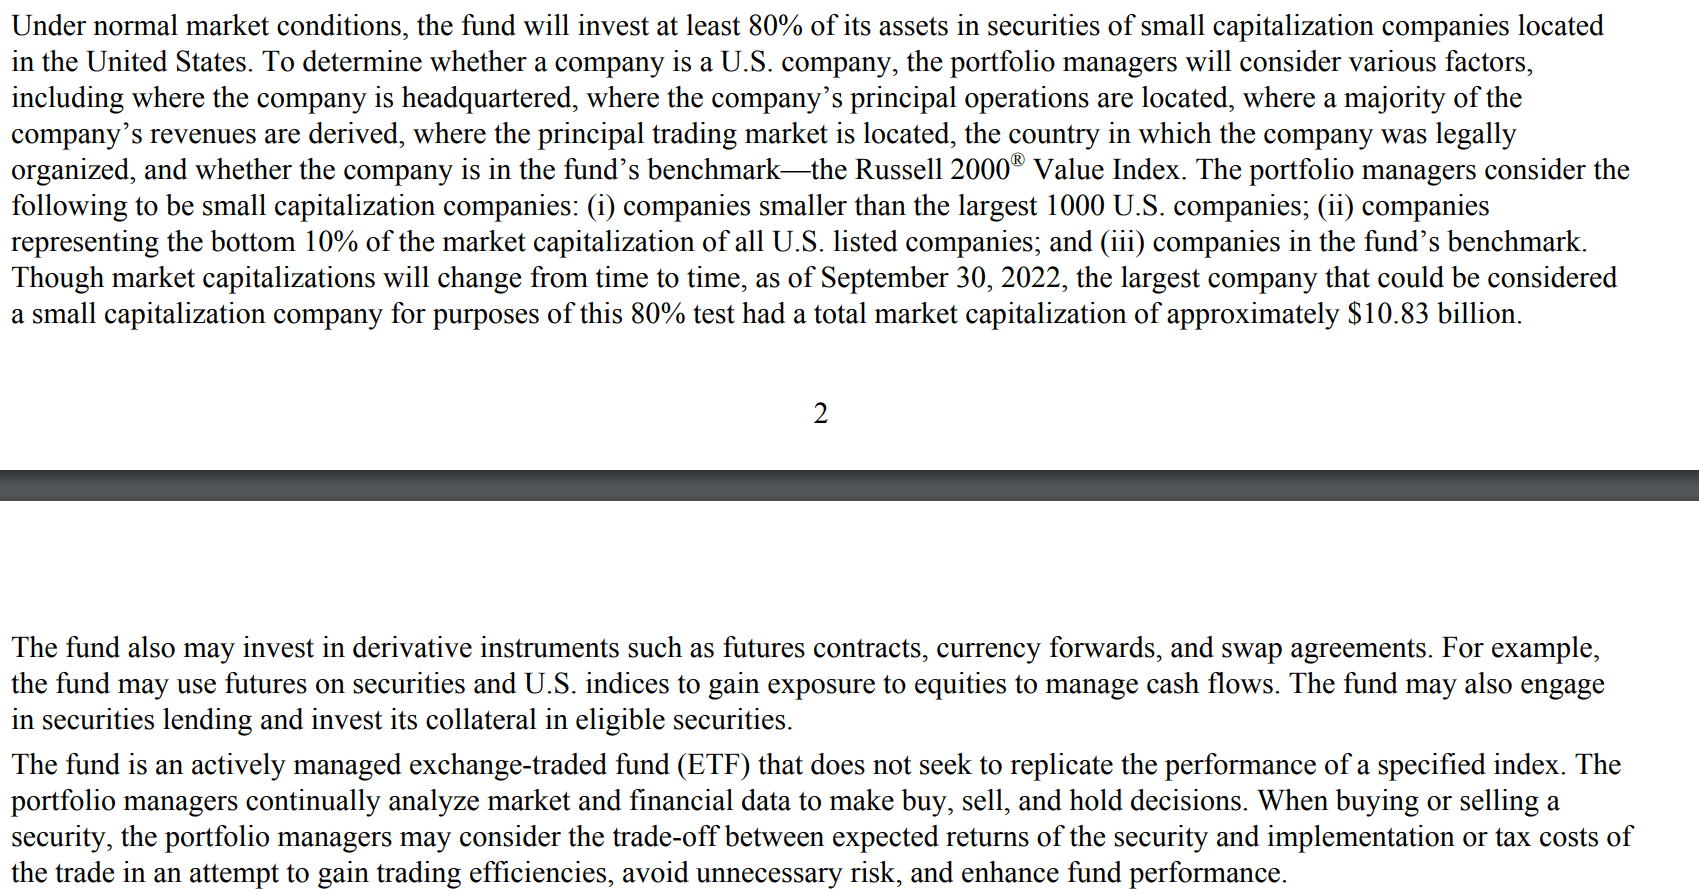
AVUV is an actively-managed fund which comprises a portfolio of US small cap companies. The companies are selected based on fundamental criteria outlined by the Fama French factors of the size premium, value premium, profitable premium and returns premium. In other words, they pick small cheap stocks that exhibit quality factors such as profit and returns. However, they still give themselves free rein to include or exclude companies depending on a variety of factors that may not be in the initial screen. For the most part, this is a passive fund, but there is still optionality by the fund manager. A more in-depth discussion on the strategy can be found in the fund prospectus.
AVUV Investment Strategy (Avantis Website) AVUV Investment Strategies Continued (Avantis)
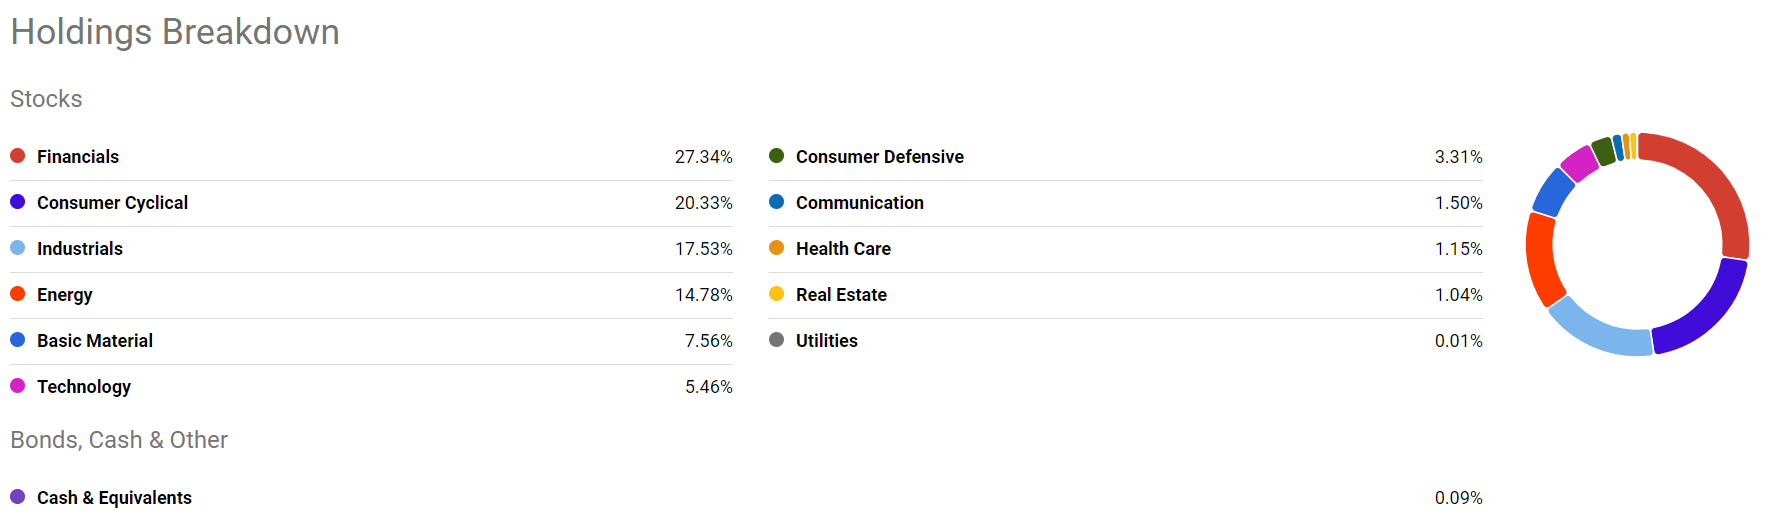
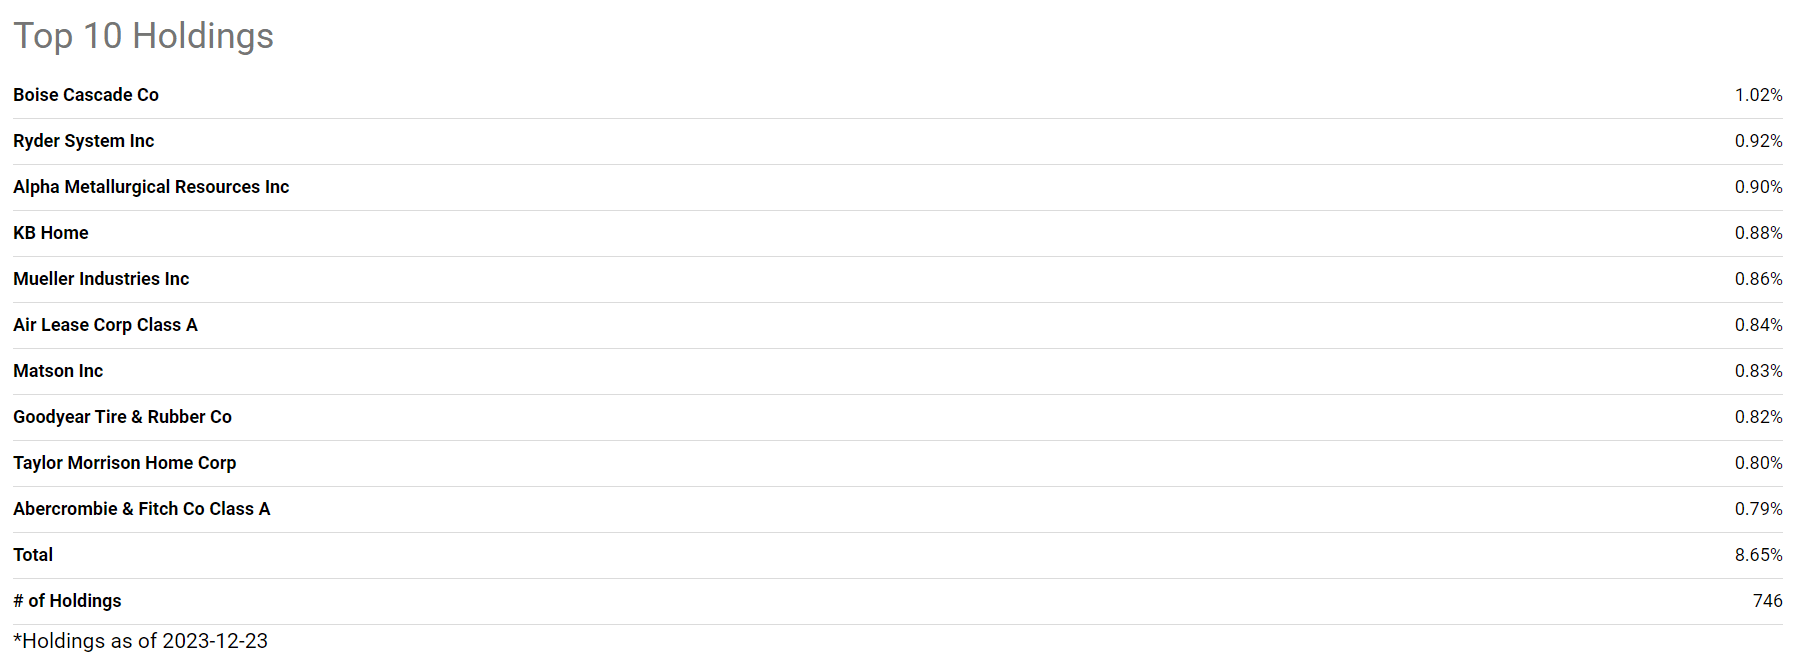
AVUV has a reasonable 0.25% expense ratio and currently a 1.65% dividend yield. It's extremely diverse given the specific factors, with over 700 holdings and each one making up no more than 1% of the total portfolio. A breakdown from Seeking Alpha's information gives us a better idea of this.
AVUV Holdings Sector Breakdown (Seeking Alpha) AVUV Holdings (Seeking Alpha)
It is fairly diversified across sectors as well, with Financials, Consumer cyclical, industrials, and energy making up the majority. As expected, not many tech companies make it past this screening as many of them are large cap, have high valuations on a book ratio basis, or may not be profitable.
High Conviction
One of the risks, or downsides, to this investing approach is it requires extremely high conviction. What I mean by this is you have to be a strong believer that the empirical data and Fama French factor-based research will continue in the future. Initially investing in AVUV and then switching to something more broad like the Vanguard Total World Stock ETF (VT) after a weak performance may result in tracking error leading to underachieving returns. One way investors get around this is by "tilting" their portfolio in one direction if conviction his high for a specific area of the market. For example, I believe large cap and tech stocks are grossly overvalued, so I'm currently tilting my portfolio to include 10% AVUV. This approach calms my mind through the swings, but still allows me to make some active decisions based on my own opinions about the market.
For further details see:
Avantis US Small Cap Value: My 2024 Answer To Overvalued Large Cap Tech Growth