AVDV - AVDV: Low Tech Non-US Weighting A Factor Market Positioning Says Otherwise
2023-11-02 20:32:50 ET
Summary
- The debate between large caps vs. small caps continues as U.S. equity benchmarks cross key levels and the Fed maintains its policy rate.
- Domestic equities have outperformed non-U.S. allocations over the years, but there are mixed opinions on whether this trend will continue.
- The Avantis International Small Cap Value ETF offers diversified exposure to ex-U.S. equities, but its low weighting in tech may impact long-term performance.
- Compressed multiples provide scope for next 12 months' relative performance, but technicals are yet to substantiate this view.
Investment brief
The debate of large caps vs. small caps rages on in the back end of '23, as U.S. equity benchmarks roll over and cross key levels, and the Fed's decision to pause further tightening and maintain its policy rate at 22 highs of 5.25–5.5% yesterday. Still, the Fed will continue shrinking its balance sheet in lieu of next policy meeting, "reducing its holdings of Treasury securities and agency debt and agency mortgage-backed securities", per the announcement.
The repricing of discount rates crumbled risk assets across '22, with a short-lived relief rally ending last month. Large caps have outperformed their smaller-cap peers within this rally, on aggregate. This is in no way thanks to the breadth of the market—performance has been concentrated in "the magnificent 7" in the broad indices.
Then, you have the debate of U.S. vs. non–U.S. allocations. Domestic equities have outperformed by a factor of 1.62x vs. European indices and 1.08x Japanese stocks since 2013. Can this continue?
There are mixed opinions on this. Nonetheless, it's worth investigating the breadth of international small-cap equities and fund universe covering the same.
The Avantis International Small Cap Value ETF ( AVDV ) is one such offering that lends investors diversified exposure to ex-U.S. equities across a range of sectors. The fund's holdings are mostly weighted to industrials (22.75%) and financials (18.6%), and—unlike the U.S. indices—only a 4.6% weighting in tech. The top 10 holdings comprise 7% of the portfolio, and the largest position is <1%. This will likely reduce volatility, but may be a drag on performance over the long run in my opinion.
It has $3.8Bn in AUM, charging an expense ratio of 0.36% on this. Distributions are $1.92 in the TTM, a 3.4% trailing yield as I write. The fund tracks the MSCI World ex USA Small Cap Index and has a tracking error of 5.6% from this benchmark since it was listed in 2019.
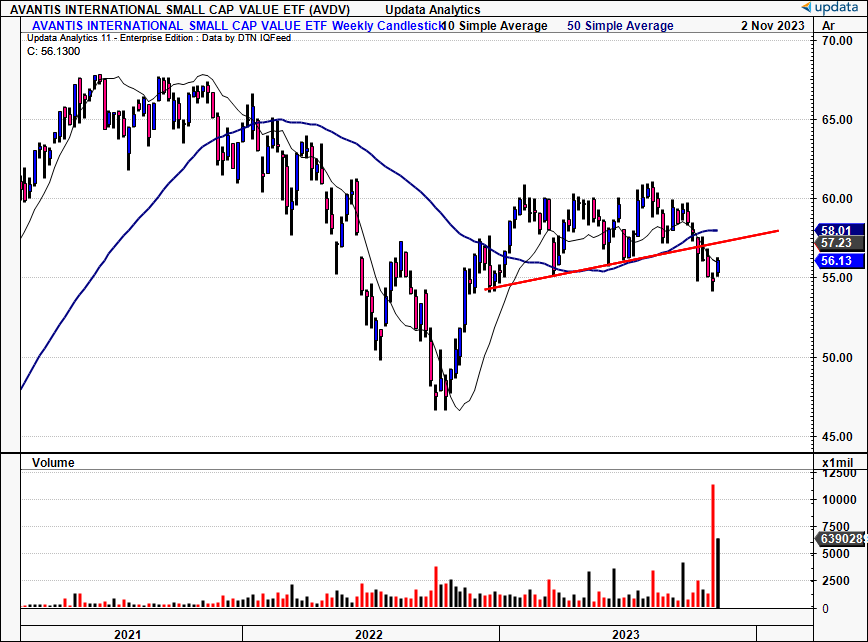
Figure 1. AVDV long-term price evolution, breaking uptrend and crossing 50DMA + 200DMA in recent weeks.
As a negative, just like its domestic counterparts, AVDV has crossed beneath its 200DMA in recent weeks, breaking the uptrend that was in situ since Q1 '23 in doing so. This is a critical level that either 1) opens up the scope for allocation, or 2) confirms a downside bias for the fund. The firm's small-cap bias may also play into this notion.
As such, my recommendations across all three investment horizons is as follows:
Fundamental bias—
- Short-term (next 12 months)— Neutral — value is well supported in the compressed multiples at just 0.14x earnings—more than statistically cheap vs. benchmarks. Dividend growth and the current yield of ~3% add to this. But, critical macro risks and a potential rotation back into U.S. equities sharply balance this. Potential allocation supported with a rally above former highs or back into trend.
- Medium-term (1–3 years)— Neutral — Eurozone GDP forecasts have been revised lower, along with key industrial measures like construction. Around 46% of the fund's holdings are based in Europe. Its APAC holdings (mainly Japan) come with mixed projections as well. Avoid allocations on weakness.
- Long-term (3+ years) — Neutral — The opportunity cost of allocating ex-U.S. over the long-term is too high in my opinion. U.S. listed equities still offer the most compelling long-term upside, and AVDV's thin allocation to tech may be a drag on long-term performance. Look to more selective opportunities elsewhere.
Technical bias—
- Short-term (coming days) — Bullish; recent momentum uptick, immense buying volume in the roll to November.
- Mid-term (coming weeks)— Neutral; rangebound trade, still time to retrace back to the $55–$57s. Beyond that, there's no confirmation.
- Long-term (coming months)— Neutral ; a s above.
Net-net, considering a long-term view, I rate AVDV a hold for the reasons raised in this report.
Talking points
- Are equities even still attractive at all?
After a decade of outperformance, the U.S. equity markets have taken a turn these past 24 months. Non-US counterparts have since attracted $59Bn of capital flows into mutual funds and ETFs in '23, versus just $5Bn of fun flows for U.S. markets. Moreover, the performance of domestic equities over the past 10 years has been mainly driven by the performance of tech and large caps in general.
AVDV’s low tech weighting may be a potential factor for performance over the coming 12 months—however, the question of whether equities are even still attractive in the current environment looms.
A recent note from Luxembourg hedge fund Maxin Advisors LLC calls this into question. The firm notes that "investors are dumping the high-flying and over-extended technology stocks", opining that we are entering a "very nasty phase for equity markets" amid a lack of catalysts to prevent investors from liquidating positions.
With US yields surging to new highs and the US 10 year bond reaching 5 % last week, the highest level since 2006, it was only a matter of time before the main indexes broke down and last week’s close is a major milestone for the direction of the markets ahead.
Both the SP500 closed below the uptrend in place since the October 13th low, confirming that the bear market rally is definitely over and that the third wave of the secular bear market that started in January 2022 is unfolding."
Not to mention, the concentration of the "magnificent 7" tech stocks continues to weigh in as a potential downside risk, given these names have upheld the rally of the broad indices this year. Without these contributions, the breadth of the equity market is low, and stocks have underperformed this year on aggregate.
Figure 2.
Source: Trahan Macro Research
- Balancing factors
Another factor to consider is seasonality. Research from Goldman Sachs ( GS ) illustrates that, going back to 1950, and 1985, the S&P 500 index and NASDAQ 100 index have exhibited the highest subsequent monthly returns over the remaining few months from November to December, respectively (Figure 3).
Figure 3.
Source: Goldman Sachs Macro Research, Bloomberg Terminal
This may or may not be a bullish sign for equities for the remainder of the year. However, one shouldn’t ignore two factors:
- Where we sit in relation to the average seasonality (heavily dislocated),
- The overwhelming short bias of net positioning investors have amassed in US stocks this year.
As seen in Figure 4, there have now been 70 weeks of net short positioning in the S&P 500 Index from 2021 to the current date. Contrarians may find this appealing, but there is no denying that short US stocks is currently a crowded trade.
Figure 4.
Source: Bespoke, from X
Casey Clark, CIO at Rockefeller Asset Management makes a good point in saying that "[s] mall cap stocks are cheap relative to large-cap stocks and relative to history, but being "cheap" alone doesn't always make for a good investment."
The firm announced it is starting its 5th European/UCITS fund, the Rockefeller US Small Cap Equity ESG UCITS , raising $42mm in its initial round. It believes that small cap vehicles, such as this will be a “truly differentiated offering in the region of Europe” . With this kind of institutional backing, the question as to whether AVDV’s offering has the same allure, given its heavy concentration to Europe.
- Next 12-months returns potential attractive
AVDV‘s returns are potentially bolstered by the fact that the trades at just 0.14x earnings, well below the segment average, and FactSet's segment average of ~3x earnings. These dislocations have the potential to offer attractive starting valuations and therefore provide a path to a reversion to segment averages. As a reminder, starting multiples heavily impact coming 12 month stock returns.
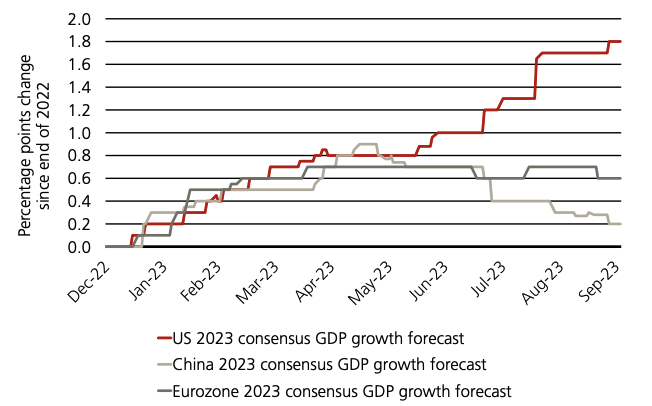
However, this is balanced by the fact that European GDP growth forecasts have been revised lower multiple times since May this year (Figure 5), catching just 0.2 percentage points change since original forecasts were made in December 2022. Hence, returns beyond 12 months are less predictable— itself a compressing factor in the scope for multiple expansions.
Figure 5. Eurozone GDP growth forecasts have been revised lower consistently since May this year.
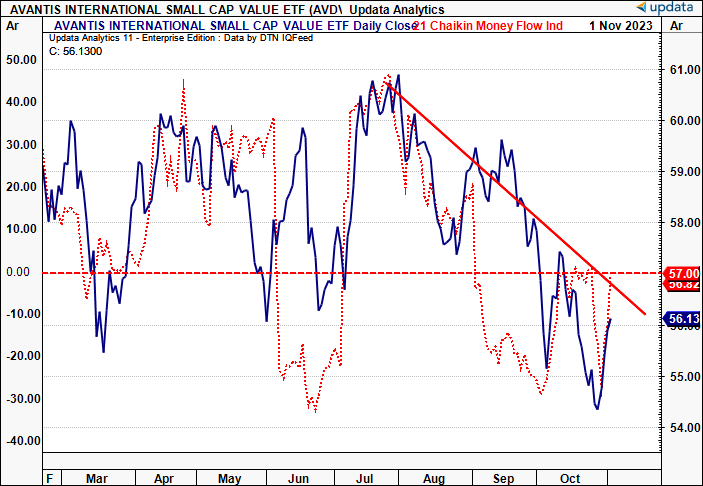
Unfortunately, fund flows into a VDV have not reflected this sentiment, and have been heavily biased to the downside since July, corresponding with the shop, sell-off in its equity value, as seen in Figure 6.
Figure 6.
Technical considerations
1. Regarding momentum
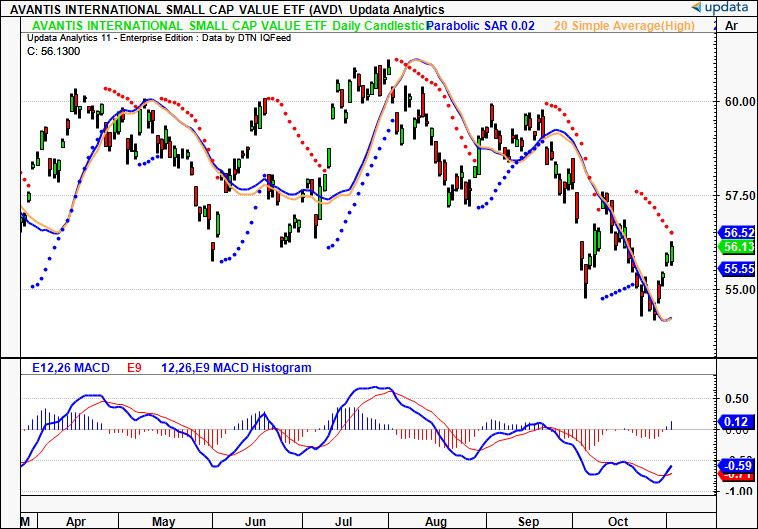
AVDV has just completed a 3 waves down move after finding its 52 week low in October. The 2 moving averages shown track the highs and lows from the last month, and critically there is (1) no 'gap' between them, and (2) both are trending lower. This tells me AVDV has been setting both lower highs and lows, so the cross above these MA's may be remarkable. Further, we've a bullish cross in the MACD which has turned positive for the first time since September. Medium-term momentum is therefore (potentially) turning positive.
Figure 7.
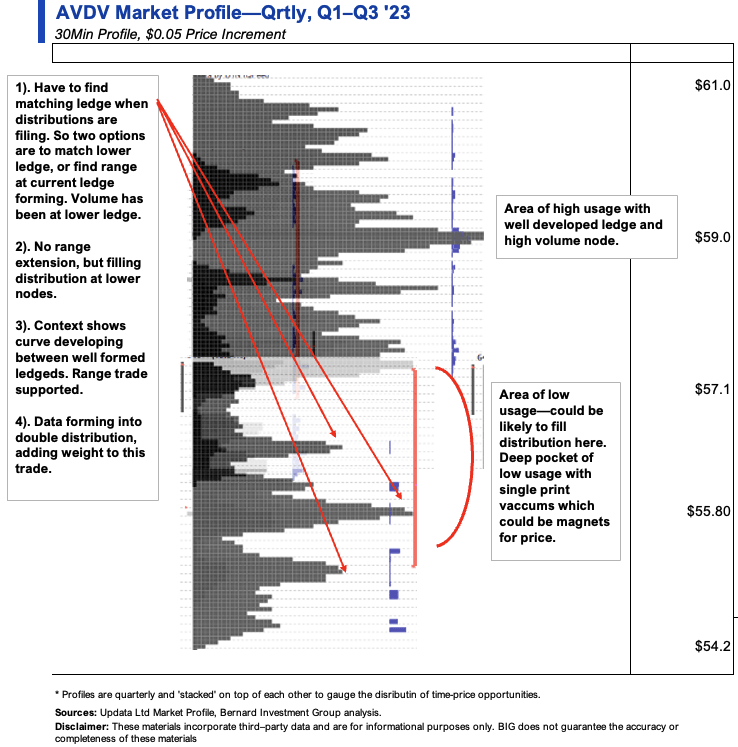
2. Skew, directional bias of price distribution
- Observations: Uncompleted bell curve so far in Q2, broad distribution that, when shown with historical context, exhibits:
- Formation of prominent ledge + high volume node at $59–$60, and inferior ledge forming at the $55s as the new POC in October/November. Markets will look to form matching ledges when distributions are filling, so we could see further rotations above the lower ledge in the $54–$55s in my opinion.
- Deep pocket of low usage between $54–$59, could be a vacuum and drag prices into this pocket. Markets tend to move from areas of high usage and this supports range trade between the two forming ledges to fill the pocket and broader distribution.
- Skew is in a double distribution with multiple distribution peaks, which adds further weight to sideways trade moving forward. Good news for the bulls.
- Key levels: Investors should closely monitor the $57–$59 region as key support areas in the low-usage pocket. These are key marks on the upside that align with the marabuzo line + gap down in the $57s and the former high (Figure 11).
- Actionable strategy: Given the double distribution, high under-developed ledges, and marabuzo line + gap down in the $57s, directional trade is not supported. Instead, look to range trade in buying the lows of value and selling the highs of value.
Figure 8.
3. Directional bias on trend views
My judgement is there is support for further congestion sideways on mid to long-term horizons.
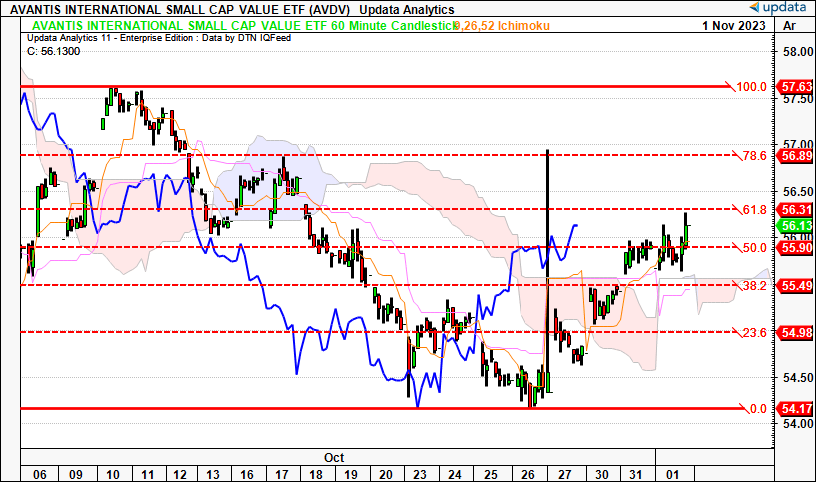
Figure 9. Short-term (60-minute chart, looking to coming days)—
Observations:
- Reversal off 52-week lows well documented and market has changed character in the short-term.
- Price and lagging lines above the cloud in a bullish thrust with 2x gaps higher into then out of the cloud.
- Has already retraced 61.8 level on the Fib from October high, still time to push to the $57 region (prior high).
Key levels:
- Downsides at the cloud top of $55.50 then $55, $54 at the 52-week low.
- Next upsides are to $56.90 then above $57.
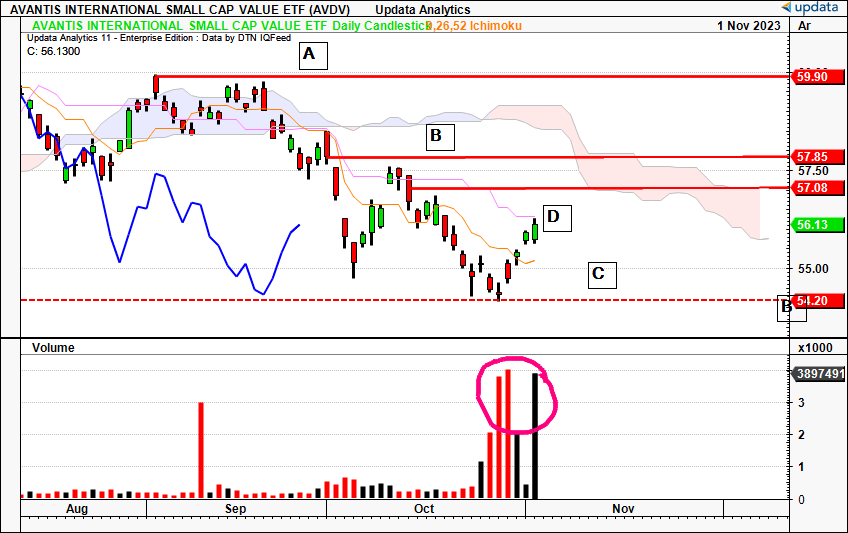
Figure 10. Medium-term (daily chart, looking to the coming weeks)—
- Top of 2nd down wave at A was tested and failed in September, followed by bearish cross beneath the cloud.
- Gap down at B not met advancing shares lower after bearish engulfing candle.
- Bounce off lows at C came after tight doji and potential morning star and tiny hammer that's followed through until today. Enormous selling volume at this level which didn't break prices lower, signalling the reversal.
- Now at D with price testing the standard line having crossed the turning line in October. Buying volume matched sellers from last month. Needs to retake marabuzo line of October hanging cloud for bullish confirmation, which coincides with the cloud base in mid November.
Key levels:
- $57 is the upside of marabuzo line from October, then I'd be looking to $57.80s which is slightly above the cloud in mid-November. Even if we hold sideways, this could cross into the cloud by December.
- $54s on the downside nearing the 52-week low.
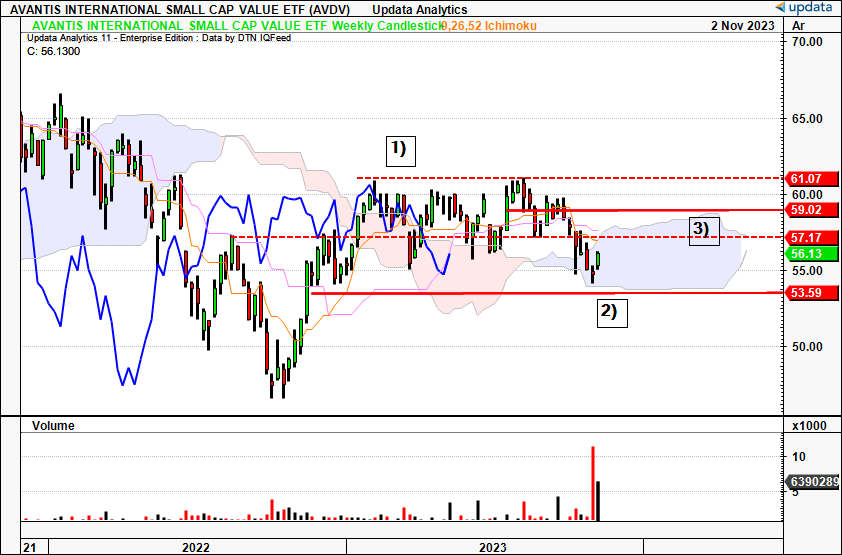
Figure 11. Long-term (weekly chart, looking to coming months)—
- Broke cloud top to the downside last month, after couldn't retake top of range at 1).
- We are neutral in the cloud, bounced from cloud bottom at 2) with morning star formation.
- Marabuzo line at $59s was rejected in October and hasn't been retaken at 3)
Key levels:
- Upside to $57.20 then $59 at marabuzo line from September. Former high is $61, but seems a stretch for now. Cloud top is ~$59 by December.
- Downsides to $53–$54 at cloud base, which extends from Nov–December.
Discussion Summary
In short, there is a lack of conviction in AVDV for investors with a mid to long-term horizon. There is scope for capital appreciation over the coming 12 months given the fund's cheap multiples. But this is balanced by challenging fundamentals in the Eurozone and a mixed sentiment for stocks in general. Longer-term my judgement is the opportunity cost of overlooking the U.S. is too great anyway. Net-net, I rate AVDV a hold on the combination of fundamentals and technicals.
For further details see:
AVDV: Low Tech, Non-US Weighting A Factor, Market Positioning Says Otherwise