FVAL - AVLV: An ETF Combining Value Quality And Growth
2023-10-12 18:25:09 ET
Summary
- Avantis US Large Cap Value ETF is an actively managed fund with a portfolio of 250 stocks and a focus on value and profitability.
- It is well-diversified across sectors and holdings, and combines good fundamental metrics in value, quality and growth.
- Price history is promising, but too short to assess the performance.
AVLV strategy and portfolio
Avantis US Large Cap Value ETF ( AVLV ) is an actively managed exchange-traded fund ("ETF") listed on 09/21/2021. It selects large cap companies with value and profitability characteristics. The fund has a portfolio of 250 stocks, a yield of 2%, and an expense ratio of 0.15%. Distributions are paid quarterly.
As described in the prospectus by Avantis Investors ,
The portfolio managers define “value characteristics” mainly as adjusted book/price ratio (though other price to fundamental ratios may be considered). The portfolio managers define “profitability” mainly as adjusted cash from operations to book value ratio (though other ratios may be considered). The portfolio managers may also consider other factors when selecting a security, including industry classification, the past performance of the security relative to other securities, its liquidity, its float, and tax, governance or cost considerations, among others . (…) The fund defines large capitalization companies as those with market capitalizations at least as large as the smallest company in the Russell 1000® Value Index .
The fund’s benchmark is the Russell 1000 Value Index, represented hereafter by iShares Russell 1000 Value ETF ( IWD ). The portfolio turnover rate was 23% in the most recent fiscal year.
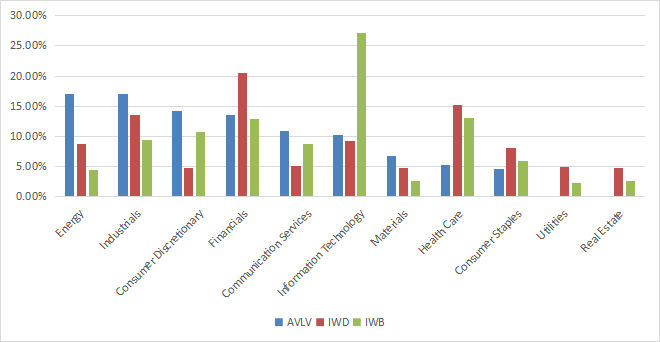
The top three sectors are energy, industrials (about 17% of assets for each), and consumer discretionary (14%). Compared to IWD and the broader index Russell 1000 ( IWB ), AVLV overweights these sectors, along with communication and materials. It almost ignores utilities and completely real estate.
Sector breakdown (chart: author; data: Fidelity, iShares)
The top 10 holdings, listed below with their weights and valuation ratios, represent 21.2% of asset value. No issuer weighs more than 3.4%, so risks related to individual companies are low to moderate.
| Ticker |
| Name |
| Weight |
| P/E ttm |
| P/E fwd |
| P/Sales |
| P/Book |
| P/FCF |
| Yield% |
| Meta Platforms, Inc. |
| 3.37% |
| 38.21 |
| 24.35 |
| 7.1 |
| 6.39 |
| 35.63 |
| 0 |
| Apple Inc. |
| 3.12% |
| 30.22 |
| 29.68 |
| 7.39 |
| 47.06 |
| 32.97 |
| 0.53 |
| Alphabet Inc. |
| 3.07% |
| 29.73 |
| 24.76 |
| 6.23 |
| 6.72 |
| 25.23 |
| 0 |
| JPMorgan Chase & Co. |
| 2.60% |
| 9.4 |
| 9.05 |
| 2.09 |
| 1.51 |
| 4.74 |
| 2.87 |
| Exxon Mobil Corp. |
| 2.21% |
| 8.52 |
| 11.39 |
| 1.2 |
| 2.18 |
| 13.77 |
| 3.42 |
| Chevron Corp. |
| 1.90% |
| 10.22 |
| 11.73 |
| 1.41 |
| 1.91 |
| 17.78 |
| 3.75 |
| Union Pacific Corp. |
| 1.68% |
| 19.12 |
| 20.51 |
| 5.16 |
| 9.68 |
| 56 |
| 2.48 |
| Texas Instruments Incorporated |
| 1.61% |
| 18.88 |
| 21.52 |
| 7.66 |
| 9.04 |
| N/A |
| 3.31 |
| Applied Materials, Inc. |
| 1.56% |
| 18.75 |
| 17.95 |
| 4.53 |
| 7.94 |
| 19.8 |
| 0.9 |
| Comcast Corp. |
| 1.53% |
| 28.06 |
| 11.66 |
| 1.53 |
| 2.2 |
| 25.75 |
| 2.62 |
Ratios: Portfolio123.
* The stock series of Alphabet/Google have been grouped in the same line.
Performance
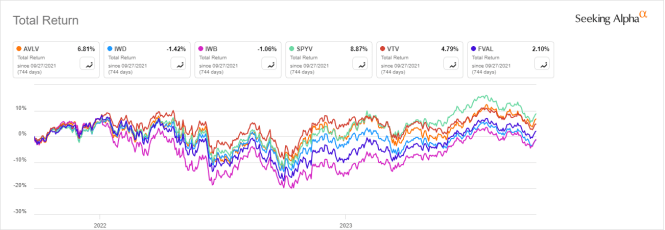
The chart below compares total returns of AVLV, IWD, IWB and three large cap value ETFs:
- SPDR Portfolio S&P 500 Value ETF ( SPYV ),
- Vanguard Value ETF ( VTV ),
- Fidelity® Value Factor ETF ( FVAL ), reviewed here .
AVLV vs benchmark and competitors (Seeking Alpha)
AVLV is the second-best performer behind SPYV. A note of caution, though: this period is too short to call a winner.
Scann ing AVLV portfolio
Aggregate Price/Earnings, Price/Sales and Price/Cash Flow ratios of AVLV are much better (i.e., lower) than for IWD and IWB. The Price/Book ratio is a bit higher than for IWD, which is not a concern. As we will see later, this ratio is not the most reliable.
| AVLV |
| IWD |
| IWB |
| Price / Earnings TTM |
| 12.25 |
| 15.65 |
| 21.61 |
| Price / Book |
| 2.61 |
| 2.22 |
| 3.81 |
| Price / Sales |
| 1.24 |
| 1.64 |
| 2.41 |
| Price / Cash Flow |
| 7.98 |
| 11.12 |
| 15.39 |
Source: Fidelity.
Most importantly, AVLV excels at combining value with growth, as reported in the table below. The cash flow growth is especially impressive.
| AVLV |
| IWD |
| IWB |
| Earnings growth % |
| 25.94% |
| 15.18% |
| 17.71% |
| Sales growth % |
| 16.62% |
| 9.91% |
| 11.53% |
| Cash flow growth % |
| 26.88% |
| 7.01% |
| 7.96% |
Source: Fidelity.
In my ETF reviews, risky stocks are companies with at least two red flags among: bad Piotroski score, negative ROA (return on assets), unsustainable payout ratio, bad or dubious Altman Z-score, excluding financials and real estate where these metrics are unreliable. AVLV holds 250 stocks, of which 30 are risky regarding these assumptions. Risky stocks weigh only 6.4% of asset value, which is a good point.
My calculation of aggregated quality metrics (reported in the next table) points to a quality superior to the Russell 1000 index. The return on assets is especially good.
| AVLV |
| IWB |
| Altman Z-score |
| 4.64 |
| 3.5 |
| Piotroski F-score |
| 5.96 |
| 5.63 |
| ROA % TTM |
| 11.18 |
| 6.31 |
Edge of actively managed ETFs
Most value indexes have two methodological weaknesses. The first one is assessing all stocks with the same criteria. It means the valuation ratios are considered comparable across sectors and industries. Obviously, they are not: my monthly dashboard here shows how valuation and quality metrics may vary across sectors.
The second shortcoming of value indexes is relying too much on the price/book ratio (P/B). Despite being the original value metric of the Fama-French model, P/B adds some risk in value strategies. Historical data show that a large group of companies with low P/B has a higher volatility and deeper drawdowns than a same-size group with low price/earnings, price/sales or price/free cash flow. The next table shows the return and risk metrics of the cheapest quarter of the S&P 500 (i.e. 125 stocks) measured in price/book, price/earnings, price/sales and price/free cash flow. The sets are reconstituted annually between 1/1/2000 and 1/1/2023 with elements in equal weight.
| Annual.Return |
| Drawdown |
| Sharpe ratio |
| Volatility |
| Cheapest quarter in P/B |
| 8.54% |
| -81.55% |
| 0.35 |
| 37.06% |
| Cheapest quarter in P/E |
| 10.71% |
| -73.62% |
| 0.48 |
| 25.01% |
| Cheapest quarter in P/S |
| 12.82% |
| -76.16% |
| 0.47 |
| 34.83% |
| Cheapest quarter in P/FCF |
| 15.32% |
| -74.77% |
| 0.61 |
| 27.03% |
Data calculated with Portfolio123.
Actively managed value funds like AVLV are more flexible than ETFs tracking an index, and they may implement a more sophisticated approach. In particular, AVLV takes profitability into account, which helps filter out value traps.
Takeaway
Avantis US Large Cap Value ETF is an actively managed fund invested in 250 stocks with value and profitability characteristics. Its top 3 sectors are energy, industrials and consumer discretionary. The portfolio is well-diversified across sectors and holdings, and it combines good fundamental metrics in value, growth and quality. The Avantis US Large Cap Value ETF strategy is more sophisticated and flexible than the usual value indexes, but it is also less transparent. Price history is promising, but too short to assess performance relative to competitors.
For further details see:
AVLV: An ETF Combining Value, Quality And Growth