BW - B. Riley Financial: Sustainability Of Dividend And Interest Yields
2023-05-03 19:17:41 ET
Summary
- RILY's diverse portfolio and intricate business model pose challenges in assessing its ability to sustain its high-yield returns.
- Preferred shares and notes appear better positioned to maintain a stable yield for investors, despite potential headwinds.
- Tomorrow's results will likely mirror stabilization in capital markets, offset by subdued M&A activity.
- The primary sources of growth will likely come from RILY's consumer and communications segment.
As B. Riley Financial, Inc. ( RILY ) navigates an increasingly challenging macroeconomic landscape, equity, and fixed-income investors find themselves asking one crucial question: can the high-yield returns be sustained in the long run? RILY's intricate business model makes answering this question a challenging task, necessitating in-depth research and analysis into revenue sources and asset quality.
B. Riley Financial, Inc. is a diversified company, with a strategy to combine different businesses with varying economic characteristics. While the approach can provide a degree of protection against market downturns, for now, dividends will likely fluctuate with the ebbs and flows of economic cycles. In 2022, RILY's total revenue declined by $474 million compared to the previous year. This decline can be attributed to the cyclical nature of some of its businesses.
Although the common share dividend may face challenges in the short term, the preferred shares and notes, which are typically less sensitive to economic fluctuations, seem better positioned to weather potential headwinds and maintain a more stable yield to investors, underpinning our hold rating on RILY's equity, and our buy rating on its notes and preferred shares.
Profitability
When analyzing any publicly-traded company, investors should be prepared to encounter a certain level of ambiguity regarding the firm's operations due to information asymmetry. B. Riley Financial, Inc., a self-proclaimed opportunistic investor, exemplifies this reality, as their approach to investment has led to confusion and most recently, the restatement of financial statements. Although these accounting restatements didn't impact EPS or cash flow figures, they made it harder to assess performance against management investment objectives.
The accounting treatment is often determined by the investment firm's intentions regarding the holding period of an investment. The company's opportunistic nature of its investment strategy might have caused confusion regarding the proper accounting treatment of various investment accounts resulting in the restatement of two balances on their income statement: 1) Trading (loss) income and fair value adjustments on loans; and 2) Realized and unrealized gains (losses) on investments.
Given these issues, the analysis below covers the restated performance on an annualized basis.
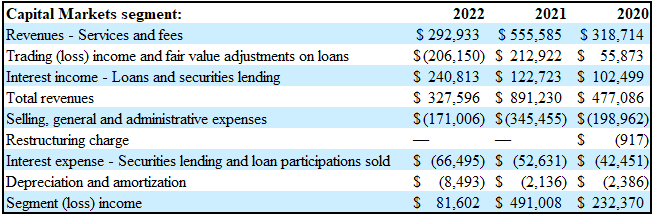
Capital Markets Segment
RILY's capital market segment, which includes service and fee revenue related to its capital underwriting activities (i.e., IPOs and debt underwriting) and interest income on securities lending and "bridging loan portfolio" extended for troubled companies by RILY until they find a new lender.
Figures in 000s (B. Riley Financial Inc)
The segment demonstrated varying degrees of performance across its core business activities and trading operations. While the segment's income remains positive, the declining total revenue and fluctuating expenses highlight the high exposure to the ever-changing financial landscape.
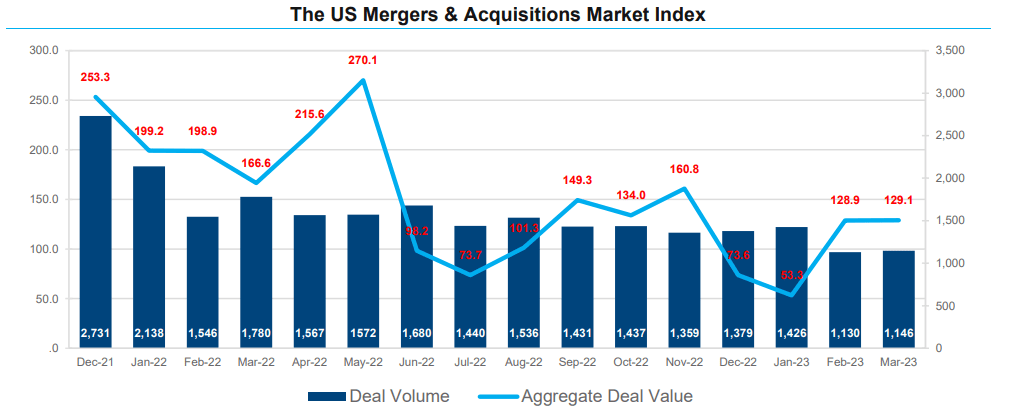
Taking M&A market activity as a proxy for what to expect from RILY tomorrow, we see a rebound in February and March in terms of deal value from January multi-year lows. However, we are still very much behind levels seen in 2021 and early 2022. For example, in Q1 2023, U.S. M&A deal value declined 45% compared to the same period of last year. Taking this as a proxy, one would expect the Service and Fees revenue related to the Capital Markets segment to decline from 69 million in Q1 2022 to 37 million in Q1 2023.
| Revenues - Services and fees: 000s |
| Q1 2021 |
| Q1 2022 |
| Q1 2023 E |
| Capital Markets segment |
| $170,979.00 |
| $69,084.00 |
| $37,996.20 |
It is difficult to forecast the revenue (loss) from the company's trading activities. From my understanding, this account balance mirrors the performance of RILY's equity and loans held for strategic short-term purposes, such as gaining a favorable seat in bankruptcy proceedings and loans for troubled companies where the company acts as an underwriter. Directionally, Q1 2023 saw a rebound in the equity markets, and a stable-slight decline in interest rates, which have a favorable impact on loan valuation. RILY also has a few hundred million of exposure to the Cryptocurrency market, which also saw a rebound in prices. I believe that we could see a rebound in revenue from trading activities in the capital market segment.
Regarding interest income from loans and securities lending, I believe it should remain flattish. From my understanding, RILY's loan portfolio has a balance of about $770 million at cost, ($700 million fair value as of December 2022). Given the company's focus on troubled SMEs, it is not unreasonable to assume a 15% return. Based on these figures, interest on loans should be about $115 million, while the remaining balance ($130 million) could be attributed to interest income from its securities lending activities. Overall, RILY's capital market segment demonstrated resilience and adaptability in recent months, thanks to a flexible SG&A structure. Still, as we look forward to Q1, one should note the slowdown in activity in the financial markets.
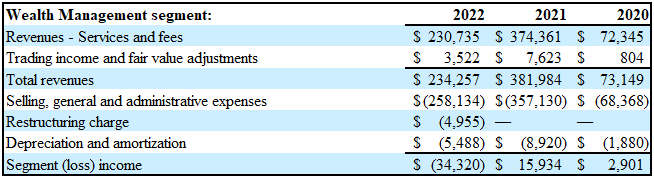
Wealth Management Segment
Figures in 000s (B. Riley Financial Inc)
The Wealth Management Segment has a less flexible cost structure. Overall, revenue is mostly dependent on Assets Under Management, or "AUM," which stands at around $24 billion based on the latest annual report. From my understanding, RILY charges industry-standard rates between 1% - 1.5% of AUM annually, in addition to performance fees. In 2022, both equities and bond values declined, impacting performance revenue. It is critical to keep an eye on AUM, which mirrors broader market trends, and investor confidence, as it directly influences the segment's ability to generate steady and sustainable revenue. One should also note that the Wealth Management Segment has historically suffered from thin margins, calling for critical restructuring to enhance profitability. In Q1 2023, we saw improvements in the equity and bond markets, with both asset classes rising. Improving market conditions in Q1 2023, and recent acquisitions including the Faber deal in February 2023 lead me to believe that we should see a small YoY increase in the segment's profitability.
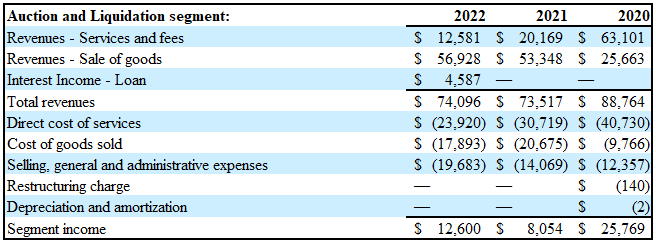
Auction and Liquidation Segment
Figures in 000s (B. Riley Financial Inc)
The auction and liquidation segment is an important component of RILY's diverse portfolio. The segment helps RILY to diversify its income sources, making the company more resilient to fluctuations in other segments such as Capital Markets and Wealth management. One can even say that the Auction segment is countercyclical, given that branch closures typically increase during economic downturns. Last week, RILY, which has been the primary underwriter and book-runner of Bed Bath and Beyond Inc.'s capital needs, announced the commencement of liquidation of all BBBY 360 stores, after the struggling retailer announced bankruptcy.
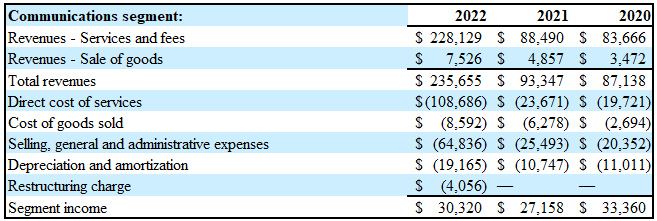
Communications Segment
Figures in 000s (B. Riley Financial Inc)
RILY's communication segment is a testament to the company's opportunistic mindset and strategy. The company has acquired a range of businesses within the communications sector seeking to generate attractive risk-adjusted investment returns, including investments in companies in the decline phase, such as magicJack, a VoIP provider, and United Online, a dial-up, and broadband internet provider. The increase in 2022 revenue is primarily due to the consolidation of Lingo, the acquisition of Bullseye, and the full-year results from Marconi Wireless. These acquisitions were enough to compensate for the decline in UOL and magicJack. Looking ahead, RILY'S seems in a great position to expand its communications segment through opportunistic acquisitions, enhancing its revenue and cash generation power.
Consumer Segment
Figures in 000s (B. Riley Financial Inc)
RILY's consumer segment demonstrated resilience in the past few years. The segment's net loss in 2020 was attributed to non-cash impairment charges due to the impact of the pandemic, an accounting issue that, in my view, doesn't mirror the long-term value of its licensing revenue. But given the uncertainty of the pandemic, especially at its onset, accounting rules mandated unrecoverable non-cash impairment charges.
I expect a meaningful increase in the consumer segment revenue in Q1 2023, driven by the acquisition of Targus in October 2022, which will be fully incorporated in Q1 2023 revenue as opposed to the same quarter of last year. For those new to RILY, Targus is a manufacturer and distributor of Laptop cases and accessories.
Other Revenue and Operating Expenses
Beyond the asset impairments mentioned above, RILY recorded a $ 201 million write-off (mostly unrealized losses) on its investment portfolio, bringing the total to $403 million, essentially erasing all capital gains of 2021. Out of the 403 million write-offs, 380 is an unrealized non-cash impartment charges. It is essential to recognize that the market selloff of 2022 played a significant role in its asset impairment. Given the improvements in market conditions, I believe we could see much better performance for RILY's top and bottom line figures.
In 2022, RILY reported a $30 million dividend income on its 1 billion equity portfolio. Due to the complexity of RILY's balance sheet, I decided to dedicate a separate article to the company's investment portfolio (~$700 million in loans and ~$1 billion in equity at fair value.) The Q1 2023 results will create significant volatility, given the magnitude of pessimism over its financials, as mirrored in the 35% short interest. In broad terms, RILY's investment portfolio is less diversified than its operations. For example, the top five equity holdings below represent at least a third of the total equity portfolio.
| Company Name |
| Ticker |
| Number of Shares |
| Price as of Dec 2022 |
| Value as of Dec 2022 |
| Price as of Mar 2023 |
| Value as of Mar 2023 |
| Babcock & Wilcox Enterprises |
| ( BW ) |
| 27,288,639 |
| $5.77 |
| $157,455,447 |
| $6.06 |
| $165,369,152 |
| Alta Equipment Group Inc. |
| ( ALTG ) |
| 6,000,763 |
| $13.19 |
| $79,150,063 |
| $15.85 |
| $95,112,093 |
| The Arena Group Holdings, Inc. |
| ( AREN ) |
| 4,592,793 |
| $10.00 |
| $45,927,930 |
| $4.25 |
| $19,519,370 |
| DoubleDown Interactive Co Ltd |
| ( DDIC ) |
| 3,876,217 |
| $8.20 |
| $31,784,979 |
| $8.00 |
| $31,009,736 |
| FaZe Holdings Inc |
| ( FAZE ) |
| 11,184,152 |
| $1.74 |
| $19,460,424 |
| $0.46 |
| $5,144,709 |
Summary
RILY's diversified business model combining different economic characteristics can offer some protection against market downturns, but dividends are likely to fluctuate with economic cycles. Preferred shares and publicly-traded notes appear better positioned to maintain stable yields.
In Q1 2023, B. Riley Financial, Inc.'s portfolio should mirror stabilization in the financial markets, but it is essential to keep an eye on various figures, including AUM and the performance of its investment portfolio. The company's communications and consumer segments will be the primary sources of growth, given the subdued M&A activity in Q1 2023. I expect significant volatility subsequent to the B. Riley Financial, Inc. earnings call, thus investors should exercise caution and discipline.
For further details see:
B. Riley Financial: Sustainability Of Dividend And Interest Yields