BANC - Banc of California: High Topline Growth Appears Priced In
Summary
- Following last year's acquisition, organic loan growth will likely remain at a satisfactory level this year thanks to improving economic activity in California.
- The margin is only slightly rate-sensitive. BANC currently has more rate-sensitive deposits than loans.
- The December 2022 target price suggests a small upside from the current market price. Further, BANC is offering a low and unattractive dividend yield.
Earnings of Banc of California ( BANC ) will most probably surge this year due to subdued organic loan growth as well as the acquisition of Pacific Mercantile Bancorp late last year. Further, the margin will likely expand slightly as interest rates surge. Overall, I'm expecting Banc of California to report earnings of $2.02 per share for 2022, up 113% year-over-year. For 2023, I'm expecting earnings to grow by 3% to $2.08 per share. The year-end target price suggests a small upside from the current market price. Therefore, I'm adopting a hold rating on Banc of California.
California’s Economic Activity to Sustain Organic Loan Growth
Banc of California’s loan portfolio grew by 2.8% in the first half of 2022, which is not too bad given the company's history of low organic growth. Going forward, loan growth will likely continue at the first half’s rate. This is because I'm expecting strong economic activity to counter the effect of high borrowing costs on credit demand.
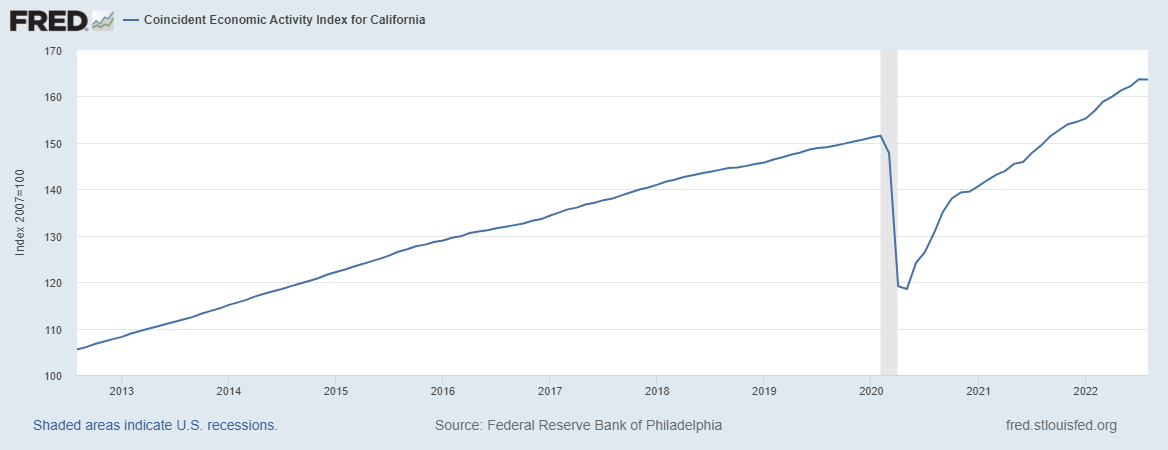
As its name suggests, Banc of California operates throughout the state of California. However, its branch network is mostly concentrated in Southern California, from San Diego to Santa Barbara. Residential loans make up a quarter of total loans, while commercial loans make up around three-quarters of total loans. The economic activity index’s trendline is currently steeper than it was before the pandemic, which shows that the economy is rapidly improving.
Further, the management mentioned in the latest conference call that it is continuing to make key hires in new verticals, which will also support loan growth.
Considering these factors, I'm expecting the loan portfolio to grow by 1.5% every quarter till the end of 2023. This will lead to a loan growth of 6% in 2022. However, the average loan balance will be 20% higher in 2022 relative to 2021 because of the acquisition of Pacific Mercantile Bancorp in October 2021.
Meanwhile, I'm expecting other balance sheet items to grow somewhat in line with loans. The following table shows my balance sheet estimates.
| FY18 |
| FY19 |
| FY20 |
| FY21 |
| FY22E |
| FY23E |
| Income Statement |
| Net interest income |
| 286 |
| 248 |
| 225 |
| 254 |
| 317 |
| 348 |
| Provision for loan losses |
| 30 |
| 36 |
| 30 |
| 7 |
| (25) |
| 14 |
| Non-interest income |
| 24 |
| 12 |
| 19 |
| 19 |
| 29 |
| 32 |
| Non-interest expense |
| 233 |
| 196 |
| 199 |
| 183 |
| 191 |
| 191 |
| Net income - Class A |
| 23 |
| 3 |
| (1) |
| 50 |
| 124 |
| 127 |
| EPS - Diluted -Class A ($) |
| 0.45 |
| 0.05 |
| -0.02 |
| 0.95 |
| 2.02 |
| 2.08 |
| Source: SEC Filings, Earnings Releases, Author's Estimates (In USD million unless otherwise specified) |
Actual earnings may differ materially from estimates because of the risks and uncertainties related to inflation, and consequently the timing and magnitude of interest rate hikes. Further, a stronger or longer-than-anticipated recession can increase the provisioning for expected loan losses beyond my estimates.
Adopting a Hold Rating
Banc of California is offering a dividend yield of 1.4% at the current quarterly dividend rate of $0.06 per share. The earnings and dividend estimates suggest a payout ratio of 11.5% for 2023, which is below the historical average. Nevertheless, I’m not expecting an increase in the dividend level as the company does not regularly change its dividend.
I’m using the historical price-to-tangible book (“P/TB”) and the peer price-to-earnings (“P/E”) multiples to value Banc of California. The stock has traded at an average P/TB ratio of 1.17 in the past, as shown below.
| FY18 |
| FY19 |
| FY20 |
| FY21 |
| Average |
| TBVPS - Dec 2022 ($) |
| 14.7 |
| 14.7 |
| 14.7 |
| 14.7 |
| 14.7 |
| Target Price ($) |
| 14.3 |
| 15.8 |
| 17.2 |
| 18.7 |
| 20.2 |
| Market Price ($) |
| 16.9 |
| 16.9 |
| 16.9 |
| 16.9 |
| 16.9 |
| Upside/(Downside) |
| (15.5)% |
| (6.8)% |
| 1.9% |
| 10.6% |
| 19.3% |
| Source: Author's Estimates |
Historically, Banc of California’s P/E multiple has been very erratic. Therefore, it's best to take the peer average to value the company instead of the historical average. As of the close of October 5, the peer average P/E ratio was around 9.7x, as shown below.
| CASH |
| PFBC |
| HFWA |
| PFC |
| Average |
| EPS 2022 ($) |
| 2.02 |
| 2.02 |
| 2.02 |
| 2.02 |
| 2.02 |
| Target Price ($) |
| 15.6 |
| 17.6 |
| 19.6 |
| 21.6 |
| 23.7 |
| Market Price ($) |
| 16.9 |
| 16.9 |
| 16.9 |
| 16.9 |
| 16.9 |
| Upside/(Downside) |
| (7.9)% |
| 4.1% |
| 16.0% |
| 28.0% |
| 40.0% |
| Source: Author's Estimates |
Equally weighting the target prices from the two valuation methods gives a combined target price of $18.4 , which implies a 9.0% upside from the current market price. Adding the forward dividend yield gives a total expected return of 10.4%. As this total expected return is not high enough for me, I’m adopting a hold rating on Banc of California.
For further details see:
Banc of California: High Topline Growth Appears Priced In