BANR - Banner Corporation: Disappointing Past Promising Future
2023-06-21 08:35:38 ET
Summary
- Banner Corporation, a small regional bank, is considered a buy due to its quality deposits, high net interest margin, and undervaluation.
- The bank has managed to keep deposit costs low and increase asset yield, resulting in a net interest margin well above its peers.
- However, risks include potential instability in the banking sector, challenges in hedging against falling interest rates, and incorrect assessment of 2023 EPS.
During one of my last articles, a user expressed in the comments his interest in Banner Corporation ( BANR ), a company I was not even aware existed. Probably, I was not the only one, as it has 1510 followers and only 6 articles have been published on Seeking Alpha since 2017. Anyway, intrigued, I looked closely at its data and was pleasantly surprised to the point that I consider it a buy.
In this article I will show you the reasons behind my optimism toward this semi-unknown bank, while also, of course, highlighting all the risks involved. The paragraphs will be presented in this order:
- Bad memories of the past
- Deposits quality
- Asset quality and net interest margin
- Dividend analysis
- Valuation and insider transactions
- Risks
- Conclusion
Bad memories of the past
Banner Corporation operates as a bank holding company for Banner Bank; it was founded in 1890 and is headquartered in Walla Walla, Washington. Currently, its market capitalization is $1.59 billion and has total assets worth $15.53 billion.
In short, we are talking about a very small bank unknown to many. What is more, those few who know it may not have good memories after what happened during the subprime mortgage crisis.
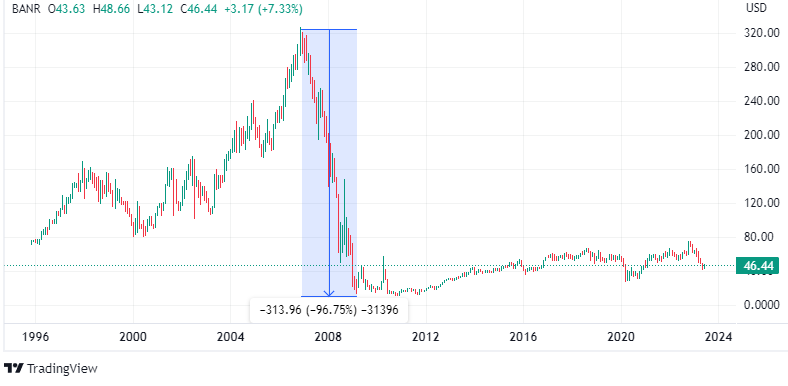
At the time, BANR stock reached an all-time high of $326 per share, and then began to collapse until it almost reached a single-digit price. It was a sensational collapse, 97% or so, and many shareholders lost virtually all or most of it.
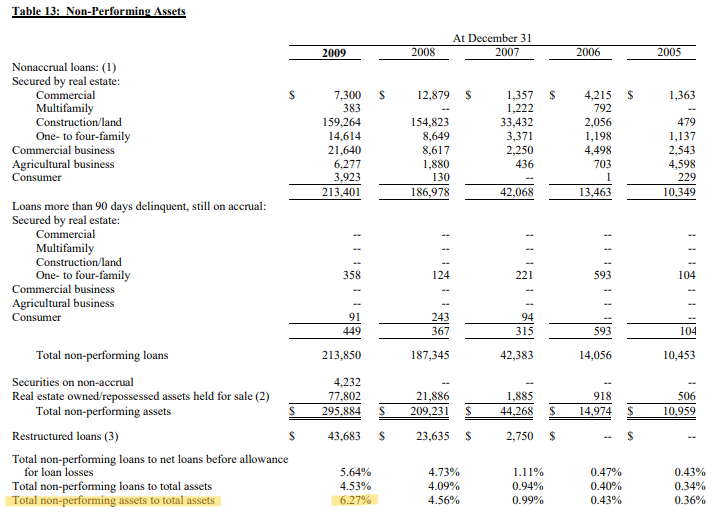
Non-performing assets reached unprecedented levels, expectations for the future were bad, and confidence was at an all-time low. In short, Banner was in a catastrophic situation and one step away from bankruptcy.
The bottom had been hit; at that point it was difficult to do worse and a series of radical changes were chosen. In April 2010 the CEO role was given to Mark Grescovich, who by the way still holds the position.
Thirteen years after that date, a lot has changed, and although Banner still remains uninfluential in the financial markets, in my opinion it is one of the most solid and undervalued regional banks. As we shall see, the banking crisis that resulted from SVB's failure has barely affected its operations, showing that it has learned from its past mistakes. However, as its performance was affected by that of the banking sector as a whole, its price per share collapsed anyway. All this generated a buying opportunity.
Deposits quality
The first aspect I want to talk about is the deposits quality , in my opinion Banner's greatest strength.
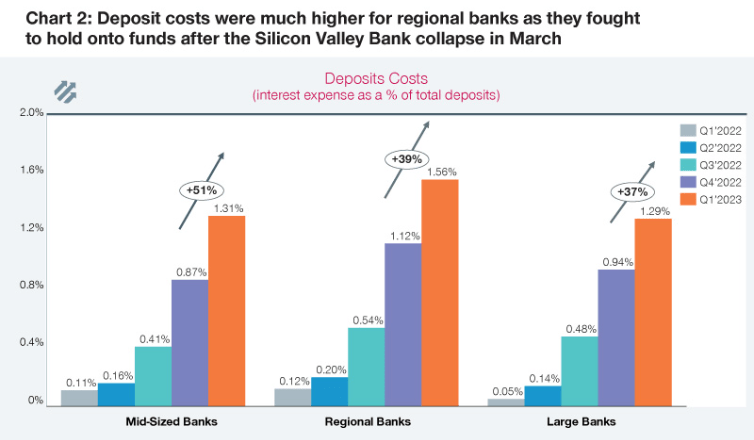
In the current macroeconomic environment with money market rates skyrocketing, almost all banks are struggling to keep the cost of deposits low. It is not easy when T-bills yield 5%, but it is critical that funding costs do not rise, otherwise they erode the net interest margin. This process is affecting regional banks the most, as they lack the bargaining power to retain customers without offering them higher interest.
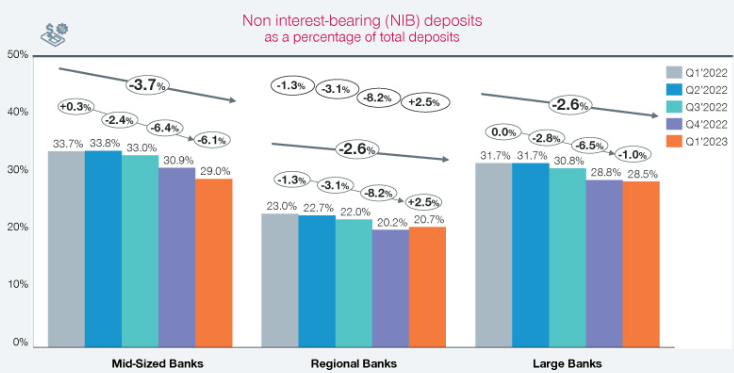
As we can see from this interesting chart taken from Simon-Kucher , in Q1 2023 the average deposit cost of regional banks was 1.56%, 27 basis points higher than large banks. So, based on this data, we might expect Banner to have a fairly high cost of deposits: actually, it is the exact opposite.
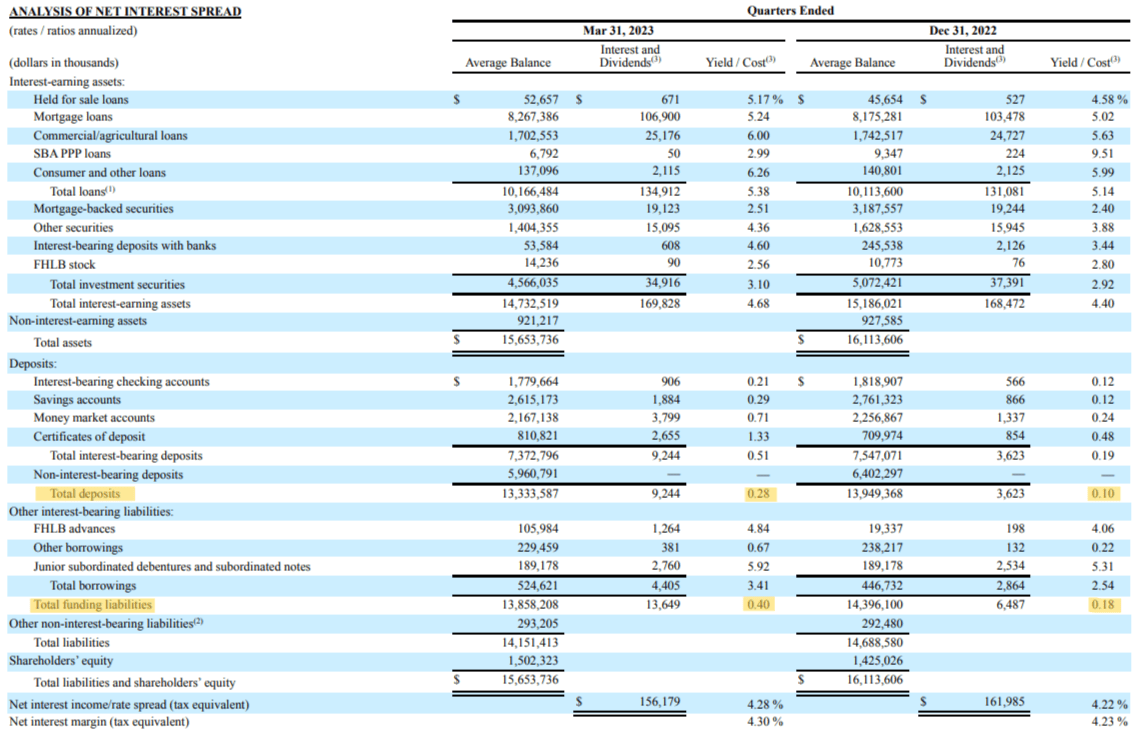
The cost of deposits is 0.28% , only 18 basis points higher than last quarter. Not only is this figure extremely low for a regional bank, but also for a large bank. With proper proportions, just consider that JPMorgan pays an average of 1.85% on interest-bearing deposits.
Banner Q1 2023
Moreover, although reduced compared to Q4 2022, non-interest bearing deposits still remain a huge slice of funding sources, or 43%. The average for regional banks is less than half, about 20.70%.
Overall, adding up deposits and borrowings, Banner pays average interest of 0.40%, which is insignificant compared to the current Fed Funds Rate. It is hard to find a bank with even lower costs.
At this point a question arises: how is it possible for a semi-unknown bank to have such a large advantage? The answer is that Banner over the years has built an excellent customer base that looks not so much at the interest rate offered by deposits but at the quality of service.
And one of the things we've noticed and observed is that we don't need to offer the highest rate in the market to generate not only good deposit retention, but bring new money in on those CD products. So, we'll continue to do that. What you want to see us do is chase deposits with the highest rate in our markets. We don't need to do that. Our clients simply want a fair rate, given the service and value they're provided at Banner.
CFO Peter Conner, Q1 2023 conference call .
In short, it matters little if rates continue to rise, Banner's customers are loyal and look primarily at the service provided. In fact, the average customer has deposited only $20k with this bank, so the opportunity cost of not investing this amount-or a portion of it-is relatively low.
In any case, despite all these positive aspects, Banner's deposits are not perfect and have a weakness: they are declining in nominal terms. The more observant will have noticed in the previous image that total deposits have declined by $616 million, driven mainly by non-interest bearing.
Well, this decline arose from customers' willingness to invest their excess cash in more rewarding financial instruments; some of them opted instead for Banner-issued certificates of deposit. However, despite this wake-up call, there are three aspects that do not make me doubt the soundness of Banner's deposits:
- Deposit outflows in the first quarter were actually lower than in the fourth quarter, so this phenomenon is fading over time. The impact of SVB's bankruptcy played virtually no role in this.
- Banner has a flexible financial structure and can easily handle a reduction in deposits. The loan to deposit ratio is 77% and cash available covers uninsured deposits.
- The reduction in deposits was mainly driven by outflows of nonoperating balances, mainly small businesses and commercial customers who shifted some of their balances to government bonds. However, they still keep the core relationship with Banner.
Specifically focusing on the latter, management expects that the outflow may continue in the coming months, but it will mainly affect noncore deposits.
Gradually, the closer we get to the base of core deposits, the more the outflow will stabilize. Personally, I expect deposits to pick up no earlier than Q3, as Q2 is subject to seasonal outflows. In fact, in Q2 tax payments occur, both on property and income, so this will result in a major outflow for the bank.
Finally, I would like to briefly discuss Banner's long-term performance, as it has shown that it is a totally different bank than it was 13 years ago.
In the last image I offered, the data go back as far as 2009, and it is evident how much deposits have improved over time. I am not talking about total amount, but the quality of customers.
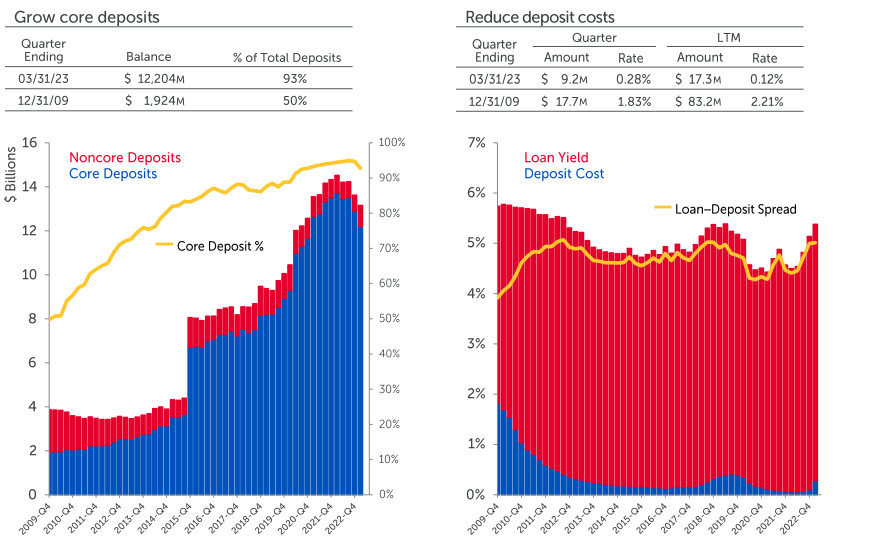
- Core deposits today account for 93% of total deposits; in 2009 they were only 50 %.
- The cost of deposits is 0.28%, in Q4 2009 it was 1.83%. At that time the Fed Funds Rate was already close to 0%, but in previous months it had reached a peak comparable to current levels.
In short, the improvement in deposits has occurred on all fronts and has been achieved through excellent management efforts over time. Before Mark Grescovich as CEO the situation was dire, today after 13 years it is a different story.
We've gone through so many cycles. But I think the point is we instilled that strategic pillar in 2010 of having a moderate risk profile, so that we can be successful through all economic cycles. And that's how we position the balance sheet, that's how we positioned our product offering, and our delivery channels.
I also believe that from this cycle, what we're seeing, my view is that this is going to have a longer tail to it than people realize. And that in and of itself, given our moderate risk profile, we'll present great opportunities for Banner going forward.
CEO Mark Grescovich, Q1 2023 conference call .
Asset Quality and Net Interest Margin
Having ascertained that Banner has quality deposits, I will now analyze the assets.
Banner Q1 2023
As we can see from this image, earning assets are divided into two groups:
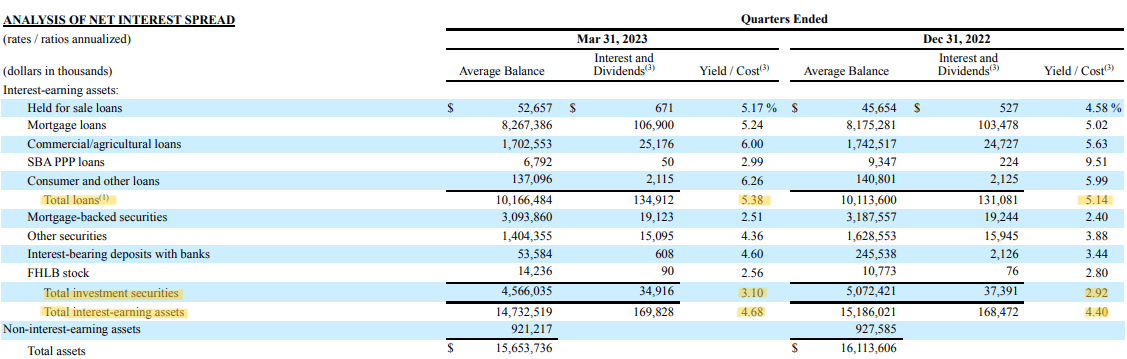
- Loans, with a weight of 69% and an average yield of 5.38%; 68% of them have floating/adjustable rates.
- Securities & interest-bearing deposits with a weight of 31% and an average yield of 3.10%.
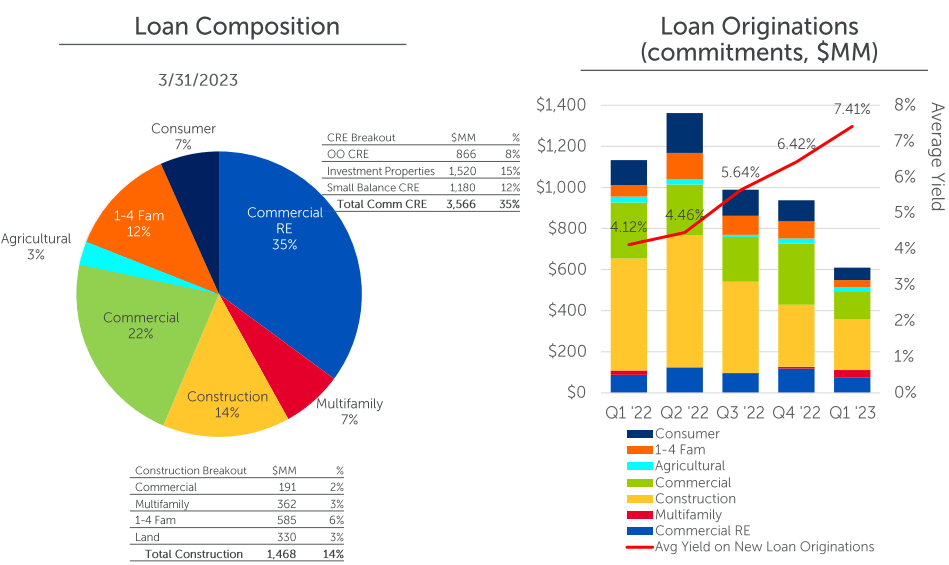
As for the first group, the loan portfolio appears rather diversified, however, the CRE segment weighs heavily. In particular, exposure to offices accounts for 7% of total loans.
The origination of new loans is gradually slowing down, but after all it was widely expected. When interest rates rise, consumers and businesses tend to avoid taking on debt. Regardless, there is always someone who needs to borrow money, and in Q1 2023, Banner lent at an average rate of 7.41%.
Banner Q1 2023
As for the second group, 81% of its investments are AAA rated, which significantly reduces its overall risk. It is moderately sensitive to interest rates since it has a mix of fixed- and floating-rate assets. In addition, Banner is continuing to purchase new assets at current market rates; this is driving the return of the entire portfolio up quarter by quarter.
Overall, according to the quarterly average balance sheet, total interest-earning assets achieved a yield of 4.68%; 28 basis points higher than the previous quarter.
In short, Banner managed to both keep deposit costs low and increase-if slightly-the yield on assets. As a result, the net interest margin has remained high and is far better than that of peers.
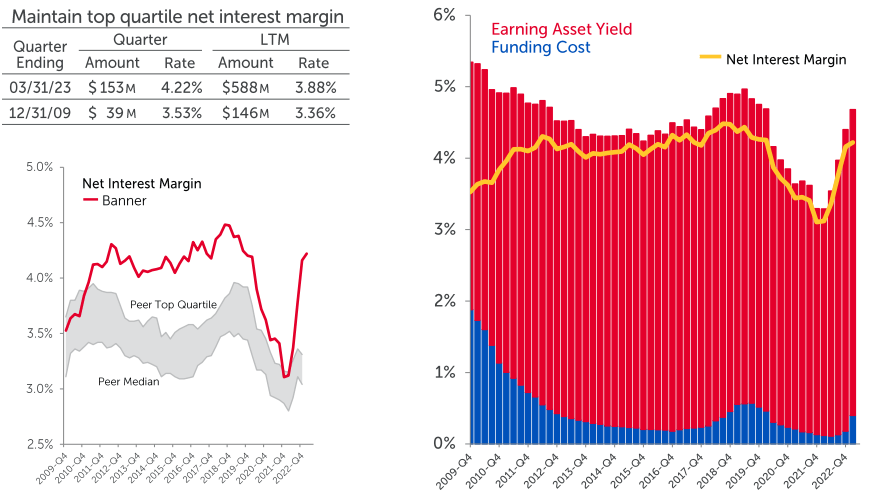
As we can see from this graph, Banner's net interest margin is well above both the peer median and the peer top quartiles. In other words, while peers struggle to exceed 3%, Banner has already far exceeded 4%.
Moreover, again, I think it is important to note the long-term improvement. In 2009 the net interest margin was significantly lower despite the earning asset yield being higher.
As of today, an entirely different balance has been achieved and very little of the old Banner remains. Nonperforming loans have also improved over the long term.
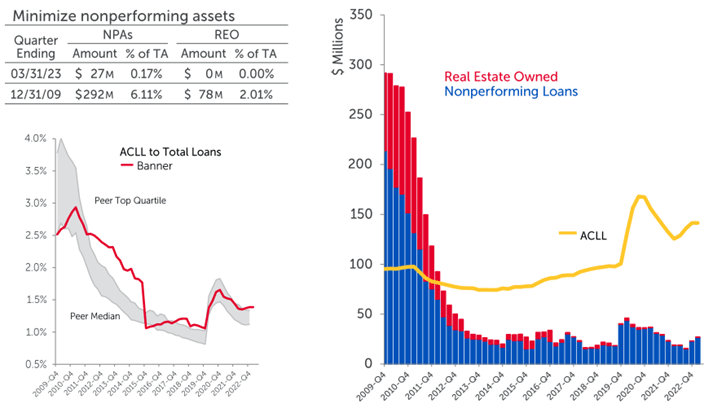
In my opinion, management has done a great job in adjusting its choices according to the changing economic environment, and this has caused the net interest margin to increase in line with the Fed Funds Rate. However, one question remains: when rates are cut, will the net interest margin fall as quickly as it rose? This is unlikely, as management is already implementing a strategy to reduce this risk.
Our goal through this rate cycle was to reduce our asset sensitivity as we got towards the top of the rate cycle through a combination of organically migrating the loan portfolio for more duration and putting loan floors in on the floating and adjustable-rate loans as we went up.
And we're in a good position now as we get towards what we presume as the top of the rate cycle. And in the way down, we're going to have a slower pace of repricing on the loan book when rates do begin to come down.
And so our goal is to hold the range of our margin where it is with just a little compression going forward, given the fact that we put in this asymmetry into our asset sensitivity as rates have gone up organically.
CFO Peter Conner, Q1 2023 conference call .
Let me explain in simple terms what this means.
Management's expectation is that the Fed has stopped-or almost stopped-raising interest rates, so it is necessary to reduce the asset sensitivity to future declines in the Fed Funds Rate, otherwise the net interest margin will worsen. The goal is for the latter to remain more or less at current levels but it is likely that at least a minimum will compress.
Here are what operations will be implemented in the strategy:
- The first is to gain more exposure to high duration assets. This way, since the latter are more sensitive when rates fall, it will result in greater capital gains. The risk of a devaluation remains should rates continue to rise, but management expects that we are near the end of this cycle. In any case, it is worth remembering that only 37% of loans are fixed-rate, so even if they rise, the overall effect would not be disastrous.
- The second operation concerns the inclusion of floors in floating-rate loans. In this way, even if the Fed Funds Rate were to collapse, the borrower would have to pay a predetermined minimum interest rate.
In other words, over the past year having a large portion of floating-rate loans has helped the net interest margin follow the Fed Funds Rate trend, but now the strategy needs to be changed and this exposure needs to be reduced through rate hedging strategies and exposure to high duration and fixed-rate assets.
Dividend analysis
Another reason I consider Banner a buy is because of its dividend, which is high and in my opinion sustainable.
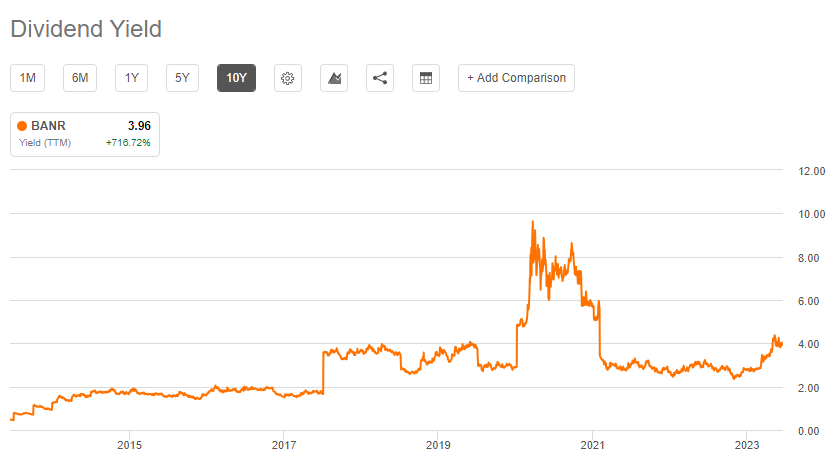
The current dividend yield is 3.96%, definitely above the market average. Moreover, excluding the brief Covid interlude, the dividend yield is at significantly higher levels than in the past. In itself, this could be a sign of undervaluation.
In any case, it is not enough to analyze the dividend yield, but it is necessary to understand whether the dividend is sustainable. If not, the bank will cut it in the future.
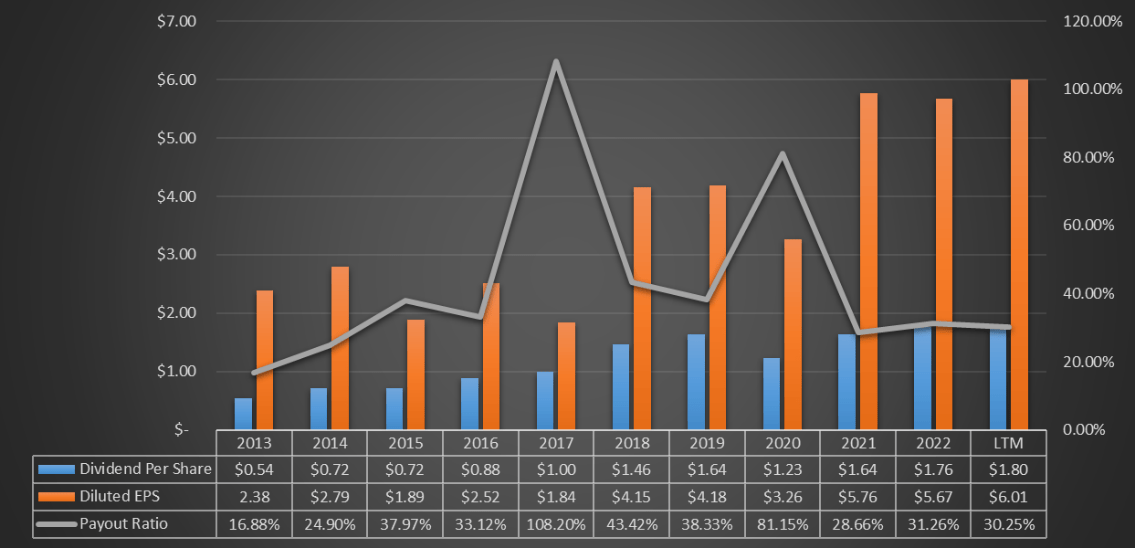
Personally, I think there are no particular problems regarding sustainability, since EPS largely covers the dividend per share; moreover, both are growing over the long term.
A payout ratio of 30 % is quite low, so the bank if it wanted to could also increase the dividend in a major way. I doubt it can do so at this stage where more liquidity is needed on a precautionary basis. Once the uncertainty in the banking sector is overcome, I expect the dividend to be one of the priorities again.
Finally, I want to point out that not every year the dividend per share increases. In complex phases such as 2020 the dividend was cut without thinking about it, just as in good phases it was increased significantly as between 2015-2018. In conclusion, in the short-term volatility is expected on the dividend, but in the long run it has proven to be increasing and sustainable.
Valuation and insiders
Banner's valuation will be done through the weighted average of three different methodologies. The first two involve book value and EPS, each with a weight of 40%; the last is the dividend discount model and its weight is 20%. The source of all the data I will include is Seeking Alpha.
- The average Price / Book ((TTM)) for the last 5 years is 1.17x; multiplying this by the Book Value per share of $44.64, the fair value amounts to $52.22 per share.
- The average GAAP P/E ((TTM)) over the past 5 years was 13.31x; multiplying this by $6.51, or Street estimates for 2023 EPS, the fair value amounts to $86.64 per share.
- The fair value through the dividend discount model is obtained based on the following inputs:
- Annual Payout ((FWD)) of $1.92 per share.
- Dividend growth rate of 10%. Consider that over the past 10 years the CAGR has been 28.49%, so I have entered a fairly conservative figure.
- Required return on investment, 15% per year. Banner is a small bank, so it is reasonable to require a high return given its risk.
Under these assumptions, the fair value is $42.24 per share.
By weighted averaging the various methods, BANR stock's fair value is $63.99, which means the stock is undervalued given that it is trading at $46 per share. Furthermore, apparently, I am not the only one who thinks so.
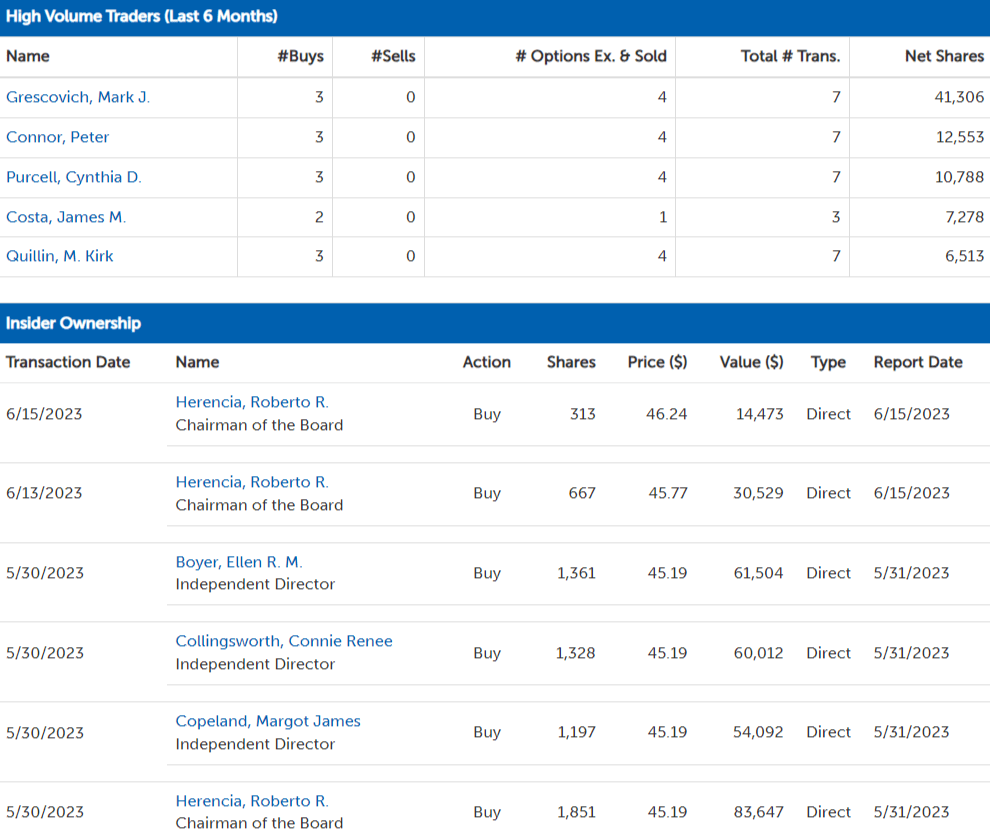
Insiders have been buying for 6 months without ever selling, and the latest purchases were a few days ago. CEO Mark Grescovich tops the list, with 41,306 shares purchased. This is not definitive proof that Banner is undervalued, they could be wrong too, but it is certainly an encouraging sign.
Risks
So far I have discussed mainly positive aspects, however, I believe it is equally important to highlight some of the risks of investing in Banner. I have identified three, from most important to least important.
- The first risk is simply related to banking, which is unstable by definition. Banks finance themselves through deposits, and if a large proportion of customers decide to withdraw their funds no bank can save itself, not even JPMorgan. Of course, for solid banks this does not happen, since there is no incentive for customers to do so. However, sometimes moments of unwarranted panic can be created, and can do permanent damage. At present, there is not much confidence in the banking system, and we cannot rule out with certainty that Banner will not be the subject of a bank run. After all, we are talking about a small bank with little influence in the world financial system. I personally expect that it won't happen given the strength of its deposits, but I don't have a crystal ball. First Republic was also a great bank.
- The second risk concerns the inability or infeasibility of applying the strategy of hedging against falling interest rates. The Fed could surprise everyone and raise rates a lot more; no one can know.
- The third risk is due to an incorrect assessment of 2023 EPS. If the estimates are wrong, then so is my fair value calculation, and not by a small margin. Consider that the calculation by EPS was the one that gave the highest fair value, $86.64 per share, and had a 40% weighting.
Conclusion
Banner is a small bank that was in terrible condition at the end of the great financial crisis. From 2010 onward, with the appointment of a new CEO and a favorable macroeconomic environment, it has gradually managed to achieve a remarkable soundness. As of today, I consider it an interesting as well as well-priced bank, which is why my rating is a buy. I tend to avoid a buy rating for banks of this size and so risky, but in this case I was pleasantly surprised.
I have rarely seen banks with such inexpensive deposits, as well as such a high net interest margin in such an economic environment. In addition, the high dividend and the insiders who keep buying are two other factors that lead me to rate this bank as a buy.
Certainly, I do not believe that at the current price Banner is the investment of a lifetime, but I simply consider it reasonable to start building a position. After months in which the market has skyrocketed, particularly tech companies, it is hard to find good opportunities. I think this is one of them, but it is critical to weight Banner as best as possible within the portfolio. It is crucial not to overexpose.
For further details see:
Banner Corporation: Disappointing Past, Promising Future