BRP - Baron Funds Q1 2023 Report - Letter From Linda
2023-05-10 04:45:00 ET
Summary
- Baron is an asset management firm focused on delivering growth equity investment solutions known for long-term, fundamental, active approach to growth investing.
- Despite the positive returns, the stock market’s journey in the first quarter could hardly be described as smooth sailing.
- Financial companies have been a significant source of investment ideas at Baron.
The first three months of 2023 brought a fresh reversal in the equity market trends from last year. A positive shift in investor expectations drove the S&P 500 Index up 7% during the quarter, while the tech-heavy Nasdaq Composite Index soared even higher: 17%. Growth equities, which took a beating last year, outperformed value, and larger caps outperformed smaller caps, largely due to the rebound of the tech giants.
As the table below shows, the popular market indexes are well above their 2022 lows but remain significantly below their highest levels. In particular, the growth and smaller cap indexes, as well as emerging market equities, still have some distance to cover before reaching their previous highs.
Similarly, valuations have come down significantly from their highest levels of the past decade, and for small- and mid-cap equities they are even materially below their long-term averages. Growth is even more discounted.
Equities Have Bounced Off Their Lows
Returns of Popular Equity Indexes
as of 3/31/2023
| All |
| 2022 |
| Time |
| All Time |
| Low to |
| High to |
| High to '22 |
| 3/31/23 |
| 3/31/23 |
| Return |
| Low - Total |
| - Total |
| - Total |
| Needed to |
| Index Name |
| Return |
| Return |
| Return |
| Recover* |
| S&P 500 Index |
| -24.5% |
| 15.8% |
| -12.5% |
| 16.7% |
| Russell 3000 Index |
| -25.1% |
| 14.9% |
| -13.9% |
| 18.5% |
| Russell 3000 Growth Index |
| -32.5% |
| 18.3% |
| -20.2% |
| 26.9% |
| Russell Midcap Index |
| -26.1% |
| 13.7% |
| -16.0% |
| 21.7% |
| Russell Midcap Growth Index |
| -38.7% |
| 21.9% |
| -25.2% |
| 35.1% |
| Russell 2000 Index |
| -31.9% |
| 10.6% |
| -24.7% |
| 35.5% |
| Russell 2000 Growth Index |
| -42.0% |
| 17.8% |
| -31.6% |
| 44.0% |
| Nasdaq Composite Index |
| -35.8% |
| 20.0% |
| -23.0% |
| 31.4% |
| MSCI ACWI ex. USA Index |
| -29.7% |
| 23.4% |
| -13.2% |
| 20.5% |
| MSCI EM Index |
| -39.0% |
| 18.5% |
| -27.7% |
| 45.9% |
Sources: FactSet, FTSE Russell, and MSCI, Inc.
*Represents the cumulative % increase needed from 3/31/23 for the price index to reach its highest level over the past decade.
Past performance is not indicative of future results. The index is unmanaged. Index performance is not Fund performance; one cannot invest directly in an index.
Valuations Have Become More Attractive
Price-to-Earnings Ratios of Popular Equity Indexes
as of 3/31/2023
| Index Name |
| Current/Long-Term Average NTM P/E Ratios |
| NTM P/E Ratio vs. Long-Term Average |
| Current P/E Ratio vs. Past 10-Yr. Max. P/E Ratio |
| S&P 500 Index |
| 18.0x / 17.2x |
| 105% |
| -21% |
| Russell 3000 Index |
| 18.0x / 17.3x |
| 104% |
| -24% |
| Russell 3000 Growth Index |
| 23.5x / 21.6x |
| 109% |
| -28% |
| Russell Midcap Index |
| 16.3x / 17.0x |
| 96% |
| -27% |
| Russell Midcap Growth Index |
| 21.3x / 22.3x |
| 96% |
| -39% |
| Russell 2000 Index |
| 13.5x / 17.0x |
| 80% |
| -33% |
| Russell 2000 Growth Index |
| 16.8x / 20.5x |
| 82% |
| -36% |
| Nasdaq Composite Index |
| 27.1x / 22.0x |
| 123% |
| -24% |
| MSCI ACWI ex. USA Index |
| 12.7x / 13.1x |
| 97% |
| -25% |
| MSCI EM Index |
| 12.2x / 11.5x |
| 107% |
| -21% |
Sources: FactSet, The Bank of New York Mellon Corporation using I/B/E/S 1 Year Forecast EPS, FTSE Russell, and MSCI, Inc.
NTM P/E is an abbreviation of Next-Twelve-Months Price-to-Earnings. Long-term average P/E ratios are calculated using the average of monthly NTM P/Es over the past 25 years, except for the Nasdaq Composite Index, the MSCI ACWI ex USA Index, and the MSCI EM Index, where the average is for the past 20 years due to shorter data availability.
Past performance is not indicative of future results. The index is unmanaged. Index performance is not Fund performance; one cannot invest directly in an index.
Despite the positive returns, the stock market's journey in the first quarter could hardly be described as smooth sailing. Inflation expectations and economic prospects dominated the narrative until early March when attention rapidly shifted to the collapse of Silicon Valley Bank (SIVBQ) and Signature Bank (SBNY) and the health of the banking system. For the first time in 15 years, investors questioned whether banks are a safe place to invest or even hold deposits. Many of our shareholders reached out with questions regarding Baron's direct and indirect exposure to banks and regional banks, in particular.
Baron's domestic Funds do not currently invest in U.S. regional banks, as they lack the fundamental characteristics we look for in our holdings. Historically, our domestic Funds have had an insignificant allocation to banks, mostly prior to the Financial Crisis of 2008. Our international Funds have some exposure to non-U.S. banks but are underweight relative to their respective benchmarks.
Despite our limited investments in banks, Baron has significant interest and a long-term track record in investing in financial services. Given the recent shift in investor attention to the Financials sector, I thought it would be fitting to share how we think about investing in financial companies.
Why Invest in Financials
Financial services are the backbone of the U.S. and most global economies. They play a critical role in facilitating capital allocation; providing essential services to businesses, governments, and individuals; and maintaining stability in financial markets. In the U.S., finance and insurance businesses accounted for $2 trillion of GDP in 2022 (around 8% of the total). According to data from the Bureau of Labor Statistics1, the financial services industry employs nearly 6.7 million people in the U.S. across 565,688 private and 1,090 government establishments. Some estimates indicate that the finance industry comprises around 20% of the global economy. Although it is hard to provide a precise number, one could argue that such estimates are reasonable given that no business activity of any scale can function without some connection to a well-developed financial industry.
Being an integral part of business and economic activity is already a strong argument in favor of adding financial stocks to a portfolio. But more than this, Financials includes a broad variety of business models with diverse growth prospects, cyclicality, and secular trends, which can add balance and diversification to a portfolio.
Financial companies are commonly viewed by investors as bastions of stability, characterized by modest growth prospects and low risk. Typically, financial stocks in the U.S. and other developed markets are perceived as value investments. As the chart on the top right shows, Financials within the Russell 3000 Index had the highest median value score of all sectors. The value score of each stock is estimated by MSCI Barra's US Total Market Model, and 85% of the score is a company's book-to-price ratio2. Scores are measured in standard deviation units, and a score of 1.0 means that a company's value score is one standard deviation higher than the average publicly traded stock in the U.S.
A closer look within the sector, however, unveils a substantial difference in the median value scores from one sub-industry to another. The next chart shows that the more traditional financial businesses - banks, insurance, and real-estate-related companies - have very high-value scores, while the more service-oriented, tech-driven, capital-light segments have much lower and even negative median value scores.
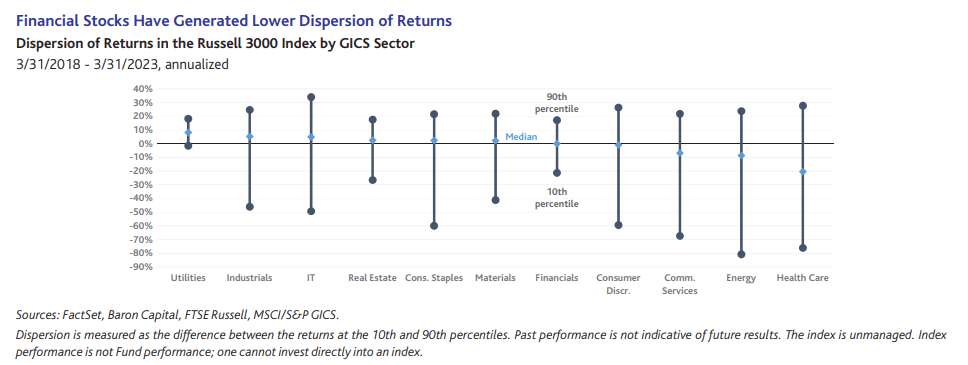
An analysis of historical stock returns may suggest on the surface that the Financials sector has not provided significant opportunities for stock pickers. However, when we dive deeper into the sector, we see there have been areas of significant opportunity. The chart below illustrates the range of returns (dispersion) of the stocks in the Russell 3000 Index by GICS sector over the past five years, as well as the median stock return by sector. In Financials, the stock(s) that ranked in the 90th percentile by performance returned around 17% annualized, while the stock(s) that ranked in the 10th percentile lost around 21% annualized 3. The median return in Financials was approximately 0%.
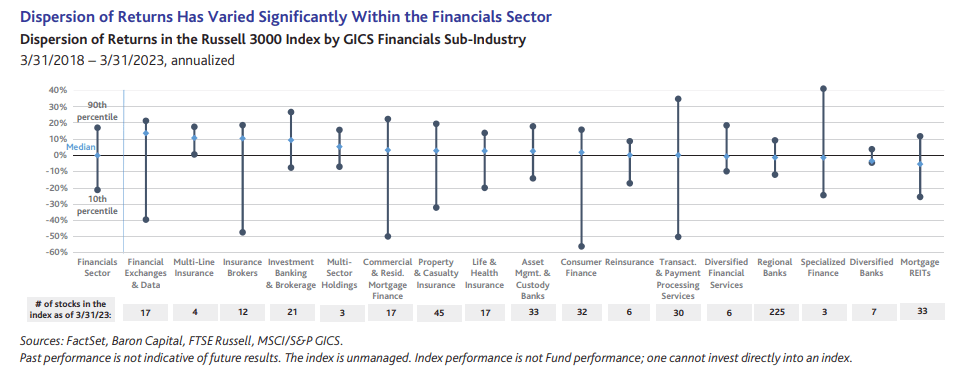
The next chart shows how different the return outcomes and dispersion have been from one Financials sub-industry to the next. For example, financial exchanges & data companies generated the highest median returns over the past five years, and the range of returns varied from -40% to over 20% annualized, which presented an attractive opportunity for active investors to exhibit their skills. Transaction & payment processing services companies experienced an even larger dispersion of returns and delivered the highest returns in the sector, which also made them an attractive investment area for stock pickers. Regional and diversified banks, on the other hand, offered the lowest median returns and very small dispersion, meaning the stock prices of the companies in these sub-industries moved more or less identically, presenting little to no opportunity for active investors.
The numbers at the bottom of the last chart show how many stocks there were in each Financials sub-industry as of 3/31/23, an additional indicator of how broad the opportunity set is for stock pickers. Some areas, like reinsurance and multi-line insurance, have only a handful of companies, offering little investment choice. Most of the other segments offer a broad enough selection, and regional banks are an outlier with 225 companies.
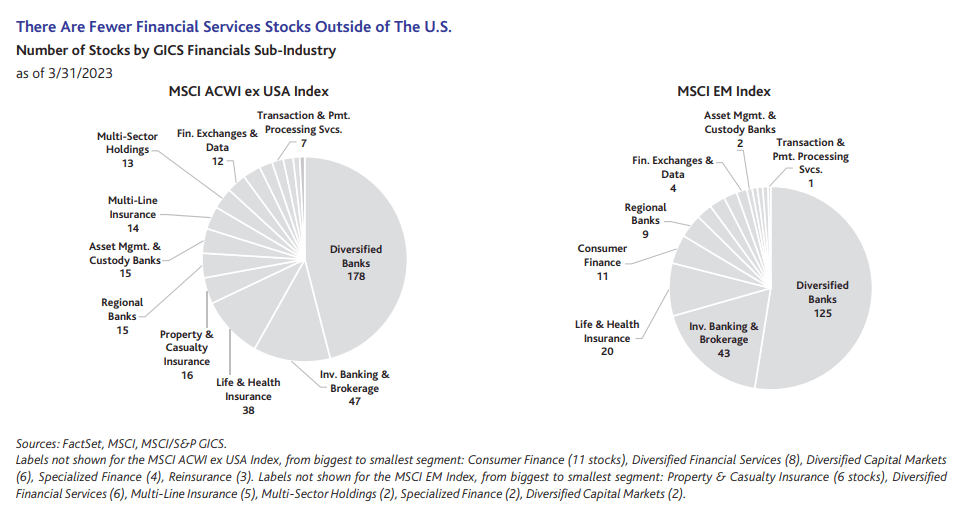
Outside of the U.S., the opportunity set in Financials is also dominated by bank stocks, but there are fewer choices for public equity investors in the service-oriented segments of the sector. As the chart on the left below shows, there are only 12 stocks in financial exchanges and data and just seven in transaction & payment processing services in the MSCI ACWI ex-USA Index. The choice of service-oriented financials is even scarcer in emerging markets, as the chart on the right shows. However, in emerging economies, the Financials sector is still developing, and many banks are considered growth stocks, presenting active growth managers with attractive opportunities.
It is astonishing how low the dispersion of U.S. diversified banks' returns was over the past five years. The U.S. banking industry is mature, and there are rarely surprises that could lead to significant variation in returns. In our view, the main reason behind the very low dispersion is the lack of competitive edge these businesses have relative to each other.
At the same time, other financial businesses that are subject to little or no regulation and do not require onerous resources have managed to stand out and deliver better stock returns than competitors - or banks. For example, MSCI Inc. ( MSCI ), a leading index and analytics provider, has only a handful of competitors. Arguably, it is much easier to create an index than to start a bank, yet, there isn't much competition for MSCI's business. This is because MSCI has successfully built a hard-to-replicate business model and its products have become the industry standard, giving it a strong and lasting competitive advantage. So have FactSet Research Systems, Inc. ( FDS ) and Bloomberg L.P., the leaders in financial data and analytics; so have Visa, Inc. (V) and Mastercard, Inc. ( MA ), the world's leading payment technology companies; so have S&P Global, Inc. ( SPGI) and Moody's Corp., ( MCO ) the leaders in credit ratings.
We believe that competitive advantage is a highly important factor when investing in financial stocks. Big balance sheets and a lot of capital do not automatically result in significant competitive advantages. High product quality, innovation, reputation, market leadership, and superior customer relationships may. When strong competitive advantages are combined with long-term growth opportunities and exceptional leadership, a business becomes uniquely positioned to leverage these competitive advantages, which we believe sooner or later should result in outstanding stock returns.
At Baron, durable competitive advantage is one of the four key investment criteria when we look for investments. The other three are long-term growth opportunities, excellent management, and attractive valuation. When it comes to investing in financial companies, we put significant emphasis on competitive advantage. We believe that a financial company that does not have a strong edge over the competition is not worth investing in and that equity investors need to be highly selective when investing in financial stocks.
For decades, the landscape in Financials was dominated by traditional banks and insurers. The aftermath of the Financial Crisis, significant regulatory reforms, and low-interest rates affected the prospects of many financial companies, forcing them to adapt to the new environment and prompting the emergence of new, innovative players. Without a doubt, however, the biggest catalyst of change in the financial industry in recent years has been technological advancement.
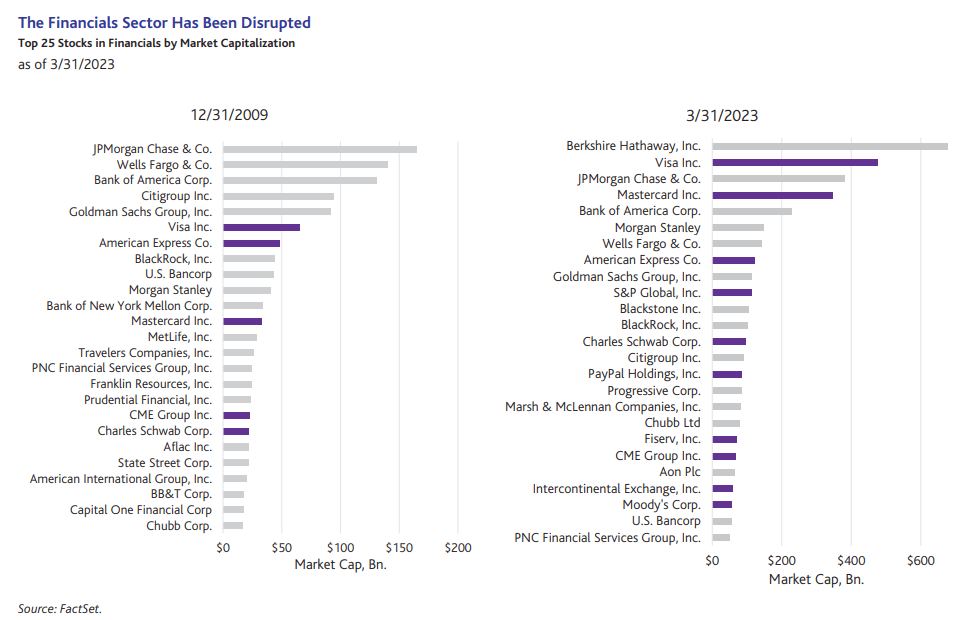
As with many sectors, digital transformation has become indispensable for financial enterprises. Enhanced hardware and software solutions, coupled with the rapid emergence of data analytics for business intelligence, have not only driven the modernization of the sector but also made possible the emergence of a broad range of capital-light, customer-centric financial businesses. This has given rise to significant new competition, enabling non-traditional players, such as tech giants, merchants, and innovative fintech companies to find new opportunities for growth and value creation and to disrupt the dominance of traditional finance players. As the charts below show, at the end of the Financial Crisis, the largest financial businesses were banks and insurers. Only five of the largest 25 publicly traded financial businesses in the U.S. were capital-light and service-oriented. Today, this view is significantly different - 10 out of the top 25 financial businesses are capital-light and service-oriented companies, with Visa, Inc. and Mastercard, Inc. occupying the second and fourth spots after experiencing 7.3 times and 10.4 times increases in market capitalization, respectively.
Financial firms, mostly banks, insurers, and asset managers, rank among the world's top technology spenders. According to Gartner, Inc., a leading technology research and advisory firm, in 2022 financial institutions globally spent $623 billion on IT, or around 14% of worldwide IT spending. Just four major banks, Citigroup, Inc. (C), JPMorgan Chase & Co. (JPM), Bank of America, Corp. (BAC), and Wells Fargo & Co. (WFC) accounted for nearly $30 billion of the total. What is even more impressive is that Citigroup and JPMorgan Chase have over 30,000 and 50,000 technology-related employees, respectively - numbers high enough to rival technology giants. Yet, despite the enormous allocation of capital and resources to technology, the incumbents in the Financials sector have not been able to deliver significant growth and shareholder value. They have spent nearly a decade to digitally transform their business activities and improve customer experience, but their efforts have largely been focused on safeguarding and maintaining the existing business and customers. It is hard for large, mature, asset-intensive businesses to adapt quickly and competitively and deliver high growth, regardless of the size of their IT budgets.
In contrast, capital-light financial businesses and financial technology firms have concentrated their efforts on redesigning and reinventing existing systems and services and creating innovative new solutions. Multiple growth trends spurred by the technological revolution, such as the shift to electronic payments, the rise of e-commerce, the growing importance of cybersecurity, the widespread adoption of mobile banking, to name a few, have resulted in the emergence of the Fintech industry, which sits at the intersection of financial services and technology. In search of new revenue and earnings sources, big tech companies and online retailers have also started offering data-driven, customer-centric financial services.
The agile, data-driven approach has enabled emerging financial players to continuously refine their offerings, providing a more personalized and seamless user experience. As a result, many of them have been able to attract and retain customers at a much faster pace than their incumbent counterparts. This has not only fueled their rapid growth but also generated impressive returns for their investors.
As shown in the chart below, the companies in the capital-light, service-oriented financial industries tend to have higher growth prospects and higher profitability compared to the asset-heavy banks. The size of the bubbles on the chart reflects the weight of the sub-industries in the Russell 3000 Index. The median growth score of the companies in each sub-industry is measured on the vertical axis, and the median profitability score is reflected on the horizontal axis. These scores are estimated by MSCI Barra's US Total Market Model, and the fundamental metrics used in the score calculations are disclosed in a footnote below the chart.
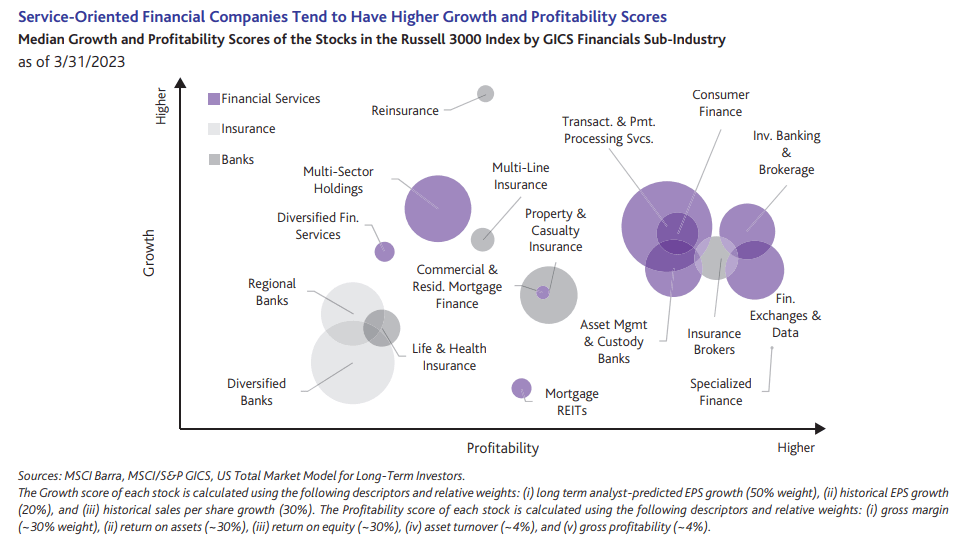
We believe that the accelerated transformation of financial services will persist for years to come, propelling growth and presenting enticing investment prospects. Although it is impossible to predict the exact shape of the future industry landscape and identify the ultimate victors, one aspect remains clear - amid change and disruption, there invariably lies an opportunity for adept active managers.
Baron's Approach to Investing in Financial Companies
Financial companies have been a significant source of investment ideas at Baron. Just as with other sectors, we are focused on durable, long-term growth opportunities, strong competitive advantages, and exceptional management teams. For the most part, we invest in financial businesses that are capital- and asset-light, do not take significant balance sheet risks, are service-oriented, and are innovative and enabled by technology. We have been able to find durable competitive advantages in such businesses, and we believe such businesses are best positioned to benefit from the technology-driven shift in the sector and drive future growth. We also have a limited number of investments in unique insurance companies.
The financial services space is diverse and complex, so we have staffed significant expertise to be able to cover it in depth. At Baron, we have five research analysts with a deep understanding of financial businesses and industry developments. In addition, several of our portfolio managers, including Ron, Alex Umansky, and Michael Kass, have accumulated long investment track records - and expertise - investing in U.S. and international financial services companies. This effort is supplemented by our strong technology research team, which provides additional support and idea generation when it comes to technology-driven financial companies. One of our financial analysts, Josh Saltman, is also the portfolio manager of the Baron FinTech Fund, which was launched at the end of 2019.
The next chart shows that in the domestic Baron Funds we favor financial exchanges and data companies, certain insurance companies, and providers of transaction and payment processing. As it happens, these are the areas with higher dispersion and potential for active managers to add value. In our international Funds, where the opportunity set is markedly different, we have more significant exposure to diversified banks and consumer finance businesses.
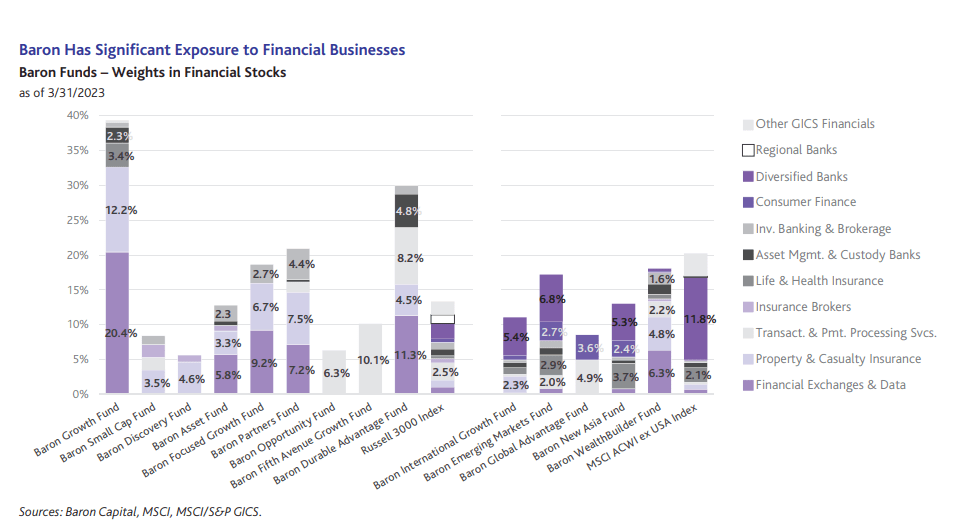
The exposures of the Baron Funds to different types of financial stocks vary widely based on the range and availability of opportunities in each Fund's investment universe, investment strategy objectives, and the risk appetites of the portfolio managers. Baron Opportunity Fund, Baron Fifth Avenue Growth Fund, Baron Global Advantage Fund, and Baron FinTech Fund (presented in more detail further below) typically have the highest exposures to technology-driven investments. Most of our Funds have significant allocations to financial services stocks and as of 3/31/23, none of the domestic Baron Funds had investments in banks, and our international Funds had some investments in banks but were underweight compared to their respective benchmarks.
The exposures in the chart above are a result of Baron's continuous research and risk management processes, and each portfolio manager's conviction in the quality, competitive strength, and growth prospects of the companies in the portfolio. Although our portfolio managers monitor the weights of financial stocks in the benchmarks, they do not invest in a way that intentionally results in an under or overexposure to the Financials sector and any of its sub-segments. Baron's investments in financial-related businesses are always selected around strong secular growth trends that we believe will continue regardless of economic cyclicality, interest rate movements, and other macroeconomic and political factors. Some examples of secular growth trends in financial services are:
- The global shift from cash to electronic payments - with the rapid growth of e-commerce, mobile technology, and digital wallets, electronic payments have become increasingly popular and convenient for consumers and businesses alike. Electronic payments offer higher convenience, cost savings, security, and higher financial inclusion for unbanked and underbanked populations, among other benefits. Some of Baron's investments related to this trend are: Visa, Inc., Mastercard, Inc., Adyen NV ( ADYEY ), Block, Inc. ( SQ ), and Pine Labs Pvt., Ltd.
- The growing demand for data to inform decision-making - as the volume and variety of data continue to expand, organizations increasingly rely on data-driven insights to gain a competitive edge, manage risk, and improve customer experiences. Aggregating and processing big data, the development of advanced technologies, such as machine learning, artificial intelligence, and cloud computing, and the rising need for automation and efficiency have led to massive shifts in the financial industry and the emergence of businesses centered around them. Some of Baron's investments related to this trend are: MSCI Inc., FactSet Research Systems, Inc., Morningstar, Inc. ( MORN ), and Moody's Corporation.
- The electronification of capital markets - the shift towards the adoption of electronic systems, digital technologies, and automated processes in various aspects of capital markets enables greater transparency, cost reduction, higher efficiency, advanced risk management, and enhanced liquidity and market accessibility, among other benefits. Some of Baron's investments related to this trend are: CME Group, Inc. ( CME ), MarketAxess Holdings, Inc. ( MKTX ), Tradeweb Markets, Inc. ( TW ), and Hong Kong Exchanges and Clearing Limited ( HKXCF ).
Our financial-related investments in emerging markets additionally focus on credit penetration and consumer financing opportunities. Since emerging economies do not have the widespread credit scoring that developed economies have, there is significant growth potential for consumer financing as income per capita rises and the middle class grows. In our view, the market leaders in banking and consumer financing in emerging economies are strongly positioned to benefit over the long term from this opportunity. In India, for example, we are finding particularly attractive investment opportunities in banks and consumer credit companies. We don't see the same growth opportunities in China.
The secular trends we focus on in financial services span across multiple industries, so not all financial-related businesses that we identify are classified by GICS in the Financials sector. On March 17, the Global Industry Classification Standard (GICS), which is the industry standard for security classification, was revised materially. One of the biggest changes reclassified
199 global securities from the Information Technology sector as data processing & outsourced services, to the Financials sector in the newly created sub-industry called transaction & payment processing services.
Thirty of the reclassified securities were constituents of the Russell 3000 Index. Several Baron Funds, including Baron Opportunity Fund, Baron Fifth Avenue Growth Fund, Baron Global Advantage Fund, and Baron FinTech Fund saw their exposure to the Financials sector change meaningfully. The pre- and post-change exposures to Financials of the Baron Funds are shown in Appendix 1. Despite the changes in the GICS classification, most of our Funds have additional exposure to financial-related stocks classified outside of the Financials sector, which is shown in the chart below.
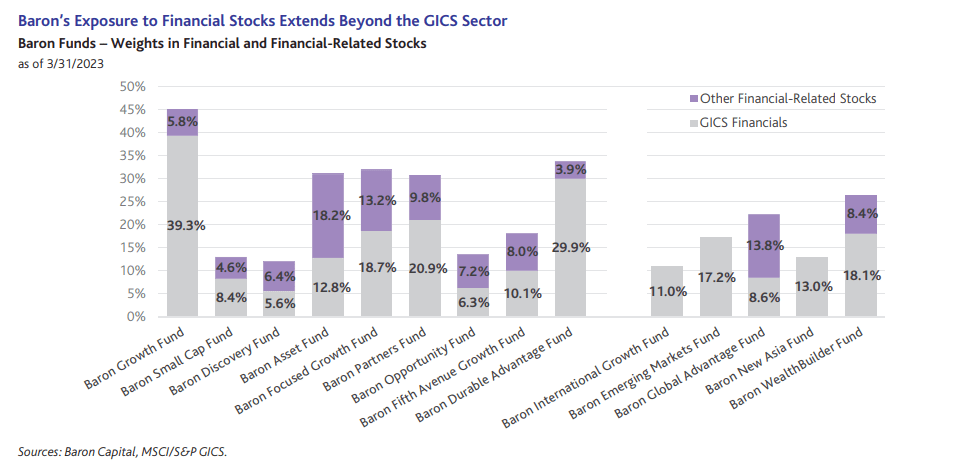
Some examples of financial-related investments that are not classified in the GICS Financials sector are:
-
Verisk Analytics, Inc. ( VRSK ), a leading provider of risk information to insurance companies that enables them to better understand and manage their risks and optimize their decision-making processes.
-
Guidewire Software, Inc. ( GWRE ), a leading provider of core systems software to the global property and casualty insurance industry, and a small player in a vast addressable market that has been benefiting from the inevitable need for property and casualty insurers to upgrade 30-year-old systems.
-
Fair Isaac Corporation ( FICO ), a data and analytics company focused on predicting consumer behavior through re-sellable algorithms (FICO Scores) and software (Applications and Decision Management Software).
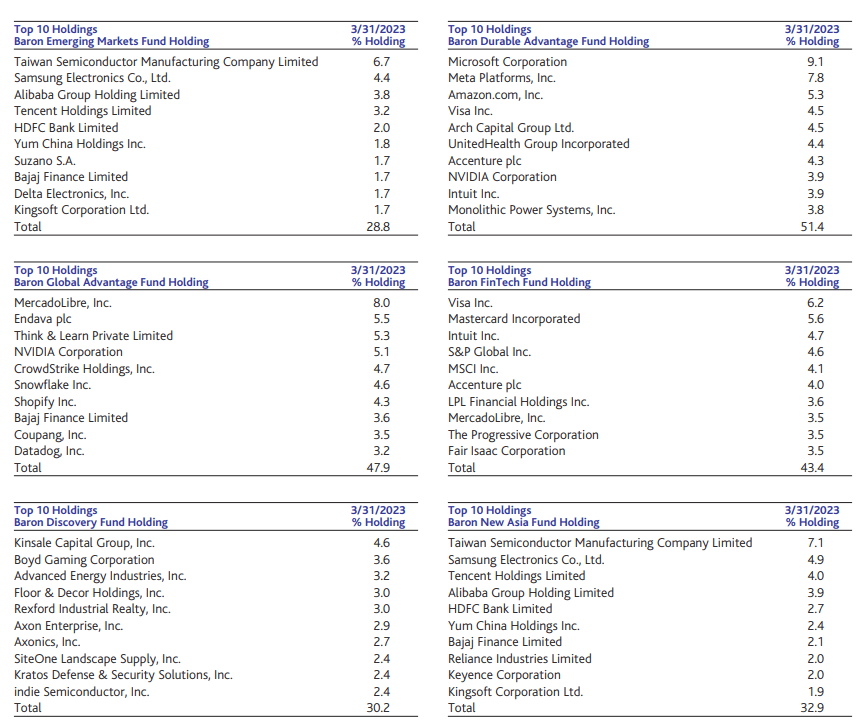
As of 3/31/2023, the top 20 investments in financial companies across Baron's mutual funds had a combined value of $7.6 billion and represented 22.6% of all investments in the Baron Funds, as shown in the next table. Our aggregate cost for these investments was approximately $4.2 billion and over time they have generated $8.2 billion in realized and unrealized gains for our shareholders, including dividends. For more information about these companies, please see Appendix 2 to this letter for business descriptions and our investment premises.
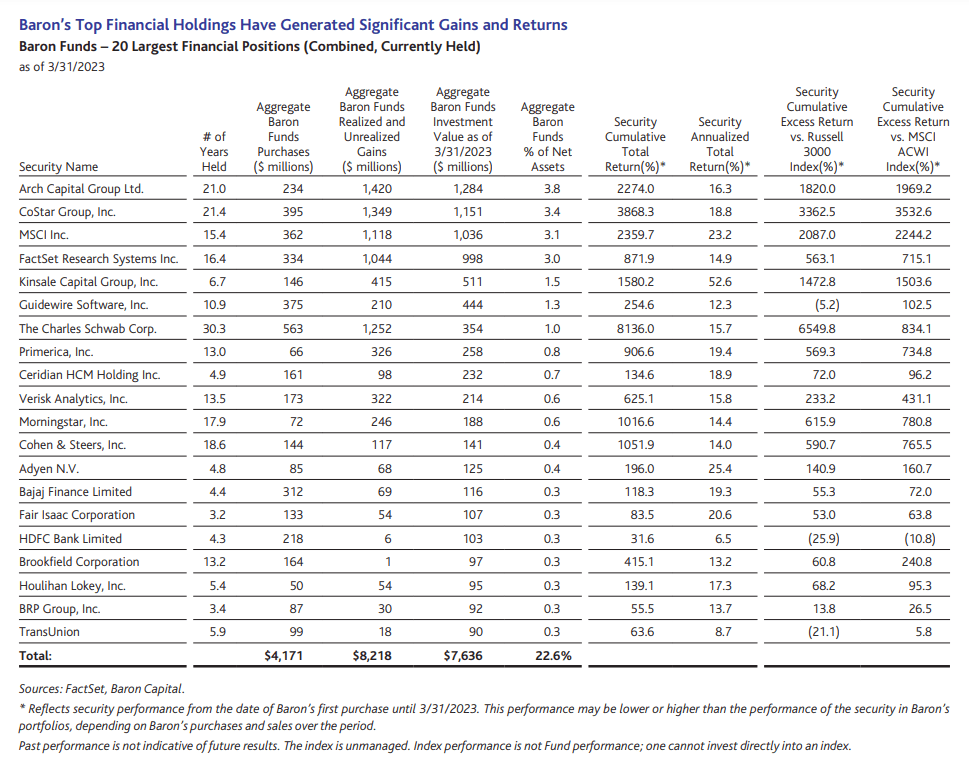
Our conviction and successful track record in financial and financial-related companies were among the key reasons behind Baron's decision to launch Baron FinTech Fund at the end of 2019. The Fund is managed by one of Baron's most experienced professionals in financial services - Josh Saltman, who has been at Baron for over 12 years and has over 17 years of research experience.
Baron FinTech Fund is a non-diversified fund that invests primarily in companies of any market capitalization that develop or use innovative technologies related in a significant way to financial services. The Fund invests principally in U.S. securities but may invest up to 35% in non-U.S. securities. Its primary benchmark is the FactSet Global FinTech Index. As the chart below shows, the Fund is largely invested in capital-light, service-oriented, and technology-driven financial-related companies and is significantly different from its benchmark.
Since its inception on December 31, 2019, the Fund has generated a cumulative return of 18.73%, significantly above the benchmark's -6.81%. Similar to other Baron sector funds, the portfolio manager of Baron FinTech Fund has a distinct approach to investing, which you can learn more about in his quarterly letter.
Our view is that the financial industry is in the middle of a long secular change, driven by technological disruption, innovation, and changing customer needs. This will give rise to new investment opportunities and broaden the outcomes, but it is also making the financial space more complex to navigate. While on the surface, the sector may seem cyclical and dependent on macroeconomic factors and interest rates, we have found many growth investment opportunities because we are focused on competitive advantages and exceptional management teams, and not on exogenous factors. We believe that, with the help of a skilled active manager, investors can take advantage of the long-term upside potential in the financial industry.
Sincerely,
Linda S. Martinson, Chairman, President, and COO
Investors should consider the investment objectives, risks, and charges and expenses of the investment carefully before investing. The prospectus and summary prospectuses contain this and other information about the Funds. You may obtain them from the Funds' distributor, Baron Capital, Inc., by calling 1-800-99BARON or visiting www.BaronFunds.com. Please read them carefully before investing.
Baron FinTech Fund's annualized returns for the Institutional Shares as of March 31, 2023: 1-year, (16.09)%; 3-year, 10.71%, Since Inception, 5.42%. Annual expense ratio for the Institutional Shares as of December 31, 2022, was 1.20%, but the net expense ratio was 0.95% (net of Adviser's fee waivers).
The FactSet Global FinTech Index's annualized returns as of March 31, 2023: 1-year, (17.67)%; 3-year, 8.67%; since Fund inception, (2.15)%.
The performance data quoted represents past performance. Past performance is no guarantee of future results. The investment return and principal value of an investment will fluctuate; an investor's shares, when redeemed, may be worth more or less than their original cost. The Adviser reimburses or may reimburse certain Funds expenses pursuant to a contract expiring on August 29, 2033, unless renewed for another 11-year term and the Funds' transfer agency expenses may be reduced by expense offsets from an unaffiliated transfer agent, without which performance would have been lower. Current performance may be lower or higher than the performance data quoted. For performance information current to the most recent month end, visit www.BaronFunds.com or call 1-800-99BARON.
The Fund's 3-year historical performance was impacted by gains from IPOs and there is no guarantee that these results can be repeated or that the Fund's level of participation in IPOs will be the same in the future.
Risks: Securities issued by medium-sized companies may be thinly traded and may be more difficult to sell during market downturns. In addition to general market conditions, technology companies, including internet-related and information technology companies, as well as companies propelled by new technologies, may present the risk of rapid change and product obsolescence, and their successes may be difficult to predict for the long term. Technology companies may also be adversely affected by changes in governmental policies, competitive pressures and changing demand. In addition to general market conditions, FinTech companies may be adversely impacted by government regulations, economic conditions and deterioration in credit markets. Companies in the Information Technology sector are subject to rapid changes in technology product cycles; rapid product obsolescence; government regulation; and increased competition, both domestically and internationally, including competition from foreign competitors with lower production costs. The IT services industry can be significantly affected by competitive pressures, such as technological developments, fixed-rate pricing, and the ability to attract and retain skilled employees, and the success of companies in the industry is subject to continued demand for IT services. Non-U.S. investments may involve additional risks to those inherent in U.S. investments, including exchange-rate fluctuations, political or economic instability, the imposition of exchange controls, expropriation, limited disclosure and illiquid markets. In addition to the general stock market risk that securities may fluctuate in value, investments in developing countries may have increased risks due to a greater possibility of settlement delays; currency and capital controls; interest rate sensitivity; corruption and crime; exchange rate volatility; and inflation or deflation.
The Baron Focused Growth Fund and Baron Partners Funds are non-diversified which means, in addition to increased volatility of the Funds' returns, they will likely have a greater percentage of their assets in a single issuer or a small number of issuers, including in a particular industry than a diversified fund. Single issuer risk is the possibility that factors specific to an issuer to which the Fund is exposed will affect the market prices of the issuer's securities and therefore the net asset value of the Fund. As of the date of the latest prospectus supplement, about 27% of Baron Focused Growth Fund's and about 49% of Baron Partners Fund's assets are invested in Tesla stock. Therefore, the Funds are exposed to the risk that were Tesla stock to lose significant value, which could happen rapidly, the Funds' performance would be adversely affected. Specific risks associated with investing in small and medium-sized companies include that the securities may be thinly traded and more difficult to sell during market downturns. Specific risks associated with leverage include increased volatility of the Fund's returns and exposure of the Fund to greater risk of loss in any given period.
The discussion of market trends is not intended as advice to any person regarding the advisability of investing in any particular security. The views expressed in this document reflect those of the respective writer. Some of our comments are based on management expectations and are considered "forward-looking statements." Actual future results, however, may prove to be different from our expectations. Our views are a reflection of our best judgment at the time and are subject to change at any time based on market and other conditions and Baron has no obligation to update them.
Portfolio holdings as a percentage of net assets as of March 31, 2023 for securities mentioned are as follows: Arch Capital Group Ltd. - Baron Asset Fund (3.3%), Baron Durable Advantage Fund (4.5%), Baron Focused Growth Fund (6.7%), Baron Growth Fund (8.2%), Baron International Growth Fund (2.3%), Baron Partners Fund (6.4%*); Bajaj Finance Limited - Baron Emerging Markets Fund (1.7%), Baron Global Advantage Fund (3.6%), Baron International Growth Fund (0.6%), Baron New Asia Fund (2.1%); Block, Inc. - Baron Fifth Avenue Growth Fund (2.2%), Baron FinTech Fund (1.8%), Baron Global Advantage Fund (1.7%); Brookfield Corporation - Baron Durable Advantage Fund (3.6%), Baron Real Estate Fund (6.3%), Baron Real Estate Income Fund (4.8%); BRP Group, Inc. - Baron Discovery Fund (1.0%), Baron FinTech Fund (0.9%), Baron Small Cap Fund (1.8%); Ceridian HCM Holding Inc. - Baron Asset Fund (2.6%), Baron Discovery Fund (2.1%), Baron Opportunity Fund (1.7%), Baron Small Cap Fund (1.6%), Baron Technology Fund (3.0%); CME Group, Inc. - Baron Durable Advantage Fund (2.6%), Baron FinTech Fund (2.1%); Cohen & Steers, Inc. - Baron Growth Fund (1.6%), Baron Partners Fund (0.3%*); CoStar Group, Inc. - Baron Asset Fund (3.7%), Baron FinTech Fund (1.5%), Baron Focused Growth Fund (4.4%), Baron Growth Fund (4.7%), Baron Opportunity Fund (2.8%), Baron Partners Fund (7.3%*), Baron Real Estate Fund (4.0%), Baron Technology Fund (2.1%); FactSet Research Systems Inc. - Baron Asset Fund (3.4%), Baron FinTech Fund (2.9%), Baron Focused Growth Fund (4.6%), Baron Growth Fund (6.6%), Baron Partners Fund (4.4%*); Fair Isaac Corporation - Baron Asset Fund (2.3%), Baron FinTech Fund (3.5%); Fidelity National Information Services, Inc. - Baron Asset Fund (0.0%); Guidewire Software, Inc. - Baron Asset Fund (2.6%), Baron Discovery Fund (1.6%), Baron FinTech Fund (2.2%), Baron Focused Growth Fund (4.3%), Baron Growth Fund (1.0%), Baron Opportunity Fund (1.6%), Baron Partners Fund (1.1%*), Baron Small Cap Fund (2.4%); HDFC Bank Limited - Baron Emerging Markets Fund (2.0%), Baron International Growth Fund (0.7%), Baron New Asia Fund (2.7%); Hong Kong Exchanges and Clearing Limited - Baron Emerging Markets Fund (0.3%), Baron New Asia Fund (0.8%); Houlihan Lokey, Inc. - Baron FinTech Fund (2.0%), Baron Growth Fund (0.5%), Baron Small Cap Fund (1.3%); Kinsale Capital Group, Inc. - Baron Discovery Fund (4.6%), Baron FinTech Fund (1.7%), Baron Growth Fund (4.0%), Baron Small Cap Fund (3.5%); Mastercard Incorporated - Baron Durable Advantage Fund (3.7%), Baron Fifth Avenue Growth Fund (5.4%), Baron FinTech Fund (5.6%), Baron Opportunity Fund (2.9%), Baron Technology Fund (2.2%); Moody's Corporation - Baron Durable Advantage Fund (2.4%), Baron FinTech Fund (2.5%); Morningstar, Inc. - Baron Growth Fund (2.5%); MSCI Inc. - Baron Asset Fund (0.4%), Baron Durable Advantage Fund (3.1%), Baron FinTech Fund (4.1%), Baron Focused Growth Fund (4.6%), Baron Growth Fund (11.3%), Baron Partners Fund (1.8%*); Pine Labs Pte. Ltd. - Baron Emerging Markets Fund (1.2%); Primerica, Inc. - Baron Growth Fund (3.4%); S&P Global Inc. - Baron Durable Advantage Fund (3.3%), Baron FinTech Fund (4.6%); The Charles Schwab Corp. - Baron Asset Fund (2.0%), Baron FinTech Fund (1.5%), Baron Partners Fund (3.8%*); TransUnion - Baron Asset Fund (2.0%), Baron FinTech Fund (1.3%); Verisk Analytics, Inc. - Baron Asset Fund (4.0%), Baron FinTech Fund (2.3%), Baron Focused Growth Fund (3.4%); Visa Inc. - Baron Durable Advantage Fund (4.5%), Baron FinTech Fund (6.2%), Baron Opportunity Fund (3.4%), Baron Technology Fund (2.2%).
* % of Long investments.
As of March 31, 2023, Baron Funds did not hold any shares of Citigroup, Inc., JPMorgan Chase & Co., Bank of America Corp., Wells Fargo & Co, and Bloomberg L.P.
Portfolio holdings are subject to change. Current and future portfolio holdings are subject to risk.
The S&P 500 Index measures the performance of 500 widely held large-cap U.S. companies. The Nasdaq Composite Index is the market capitalization-weighted index of approximately 3,000 common equities listed on the Nasdaq stock exchange. The Russell 2000® Index measures the performance of small-sized U.S. companies. The Russell 2000® Growth Index measures the performance of small-sized U.S. companies that are classified as growth. The Russell 3000® Index measures the performance of the broad segment of the U.S. equity universe comprised of the largest 3000 U.S. companies representing approximately 98% of the investable U.S. equity market. The Russell 3000® Growth Index measures the performance of the broad growth segment of the U.S. equity universe comprised of the largest 3000 U.S. companies representing approximately 98% of the investable U.S. equity market. The Russell Midcap® Index measures the performance of medium-sized U.S. companies.
The Russell Midcap® Growth Index measures the performance of medium-sized U.S. companies that are classified as growth. All rights in the FTSE Russell Index (the "Index") vest in the relevant LSE Group company which owns the Index. Russell® is a trademark of the relevant LSE Group company and is used by any other LSE Group company under license. Neither LSE Group nor its licensors accept any liability for any errors or omissions in the indexes or data and no party may rely on any indexes or data contained in this communication. The MSCI EM (Emerging Markets) Index is designed to measure equity market performance of large and mid-cap securities across 24 Emerging Markets countries. The MSCI ACWI ex USA Index captures large and mid-cap representation across 22 of 23 Developed Markets countries (excluding the US) and 26 Emerging Markets countries. MSCI is the source and owner of the trademarks, service marks, and copyrights related to the MSCI Indexes. The FactSet Global FinTech IndexTM is an unmanaged and equal-weighted index that measures the equity market performance of companies engaged in Financial Technologies, primarily in the areas of software and consulting, data and analytics, digital payment processing, money transfer, and payment transaction-related hardware, across 30 developed and emerging markets. The indexes and the Funds include reinvestment of dividends, net of withholding taxes, which positively impact the performance results. The indexes are unmanaged. Index performance is not Fund performance; one cannot invest directly in an index.
Price/Earnings Ratio (next 12 months) is a valuation ratio of a company's current share price compared to its mean forecasted 4-quarter sum earnings per share over the next twelve months. If a company's EPS estimate is negative, it is excluded from the portfolio-level calculation. Price/Book Ratio is a ratio used to compare a company's stock price to its tangible assets, and it is calculated by dividing the current closing price of the stock by the latest quarter's book value per share. Diversification does not guarantee a profit or protect against a loss.
BAMCO, Inc. is an investment adviser registered with the U.S. Securities and Exchange Commission (SEC). Baron Capital, Inc. is a broker-dealer registered with the SEC and member of the Financial Industry Regulatory Authority, Inc. (FINRA).
Appendix 1: Baron Funds Financials' Exposure Before and After GICS Structure Revisions*
% of Net Assets as of 3/17/2023
| Weight in Financials (%) |
| Old GICS Structure |
| Revised GICS Structure |
| Change |
| Baron Growth Fund |
| 39.23 |
| 39.23 |
| - |
| Baron Small Cap Fund |
| 6.63 |
| 8.36 |
| 1.73 |
| Baron Discovery Fund |
| 5.52 |
| 5.52 |
| - |
| Baron Asset Fund |
| 13.06 |
| 13.36 |
| 0.30 |
| Baron Focused Growth Fund |
| 17.45 |
| 17.45 |
| - |
| Baron Partners Fund |
| 20.27 |
| 21.77 |
| 1.49 |
| Baron Opportunity Fund |
| - |
| 6.41 |
| 6.41 |
| Baron Fifth Avenue Growth Fund |
| - |
| 10.80 |
| 10.80 |
| Baron Durable Advantage Fund |
| 21.11 |
| 29.46 |
| 8.35 |
| Baron International Growth Fund |
| 11.23 |
| 11.54 |
| 0.31 |
| Baron Emerging Markets Fund |
| 15.45 |
| 17.45 |
| 2.00 |
| Baron Global Advantage Fund |
| 3.83 |
| 8.97 |
| 5.13 |
| Baron Real Estate Fund |
| 9.80 |
| 9.80 |
| - |
| Baron Real Estate Income Fund |
| 5.45 |
| 5.45 |
| - |
| Baron Health Care Fund |
| - |
| - |
| - |
| Baron FinTech Fund |
| 37.50 |
| 63.51 |
| 26.01 |
| Baron Technology Fund |
| - |
| 4.64 |
| 4.64 |
| Baron New Asia Fund |
| 13.27 |
| 13.27 |
| - |
| Baron Capital Group, Inc. Assets Under Management |
| 18.63 |
| 19.80 |
| 1.17 |
| Russell 3000 vs. |
| 10.92 |
| 13.44 |
| 2.52 |
Source: Baron Capital.
* Effective on 3/17/2023
Appendix 2: Baron Funds Top 20 Financials-Related Holdings & Investment Premises
as of 3/31/2023
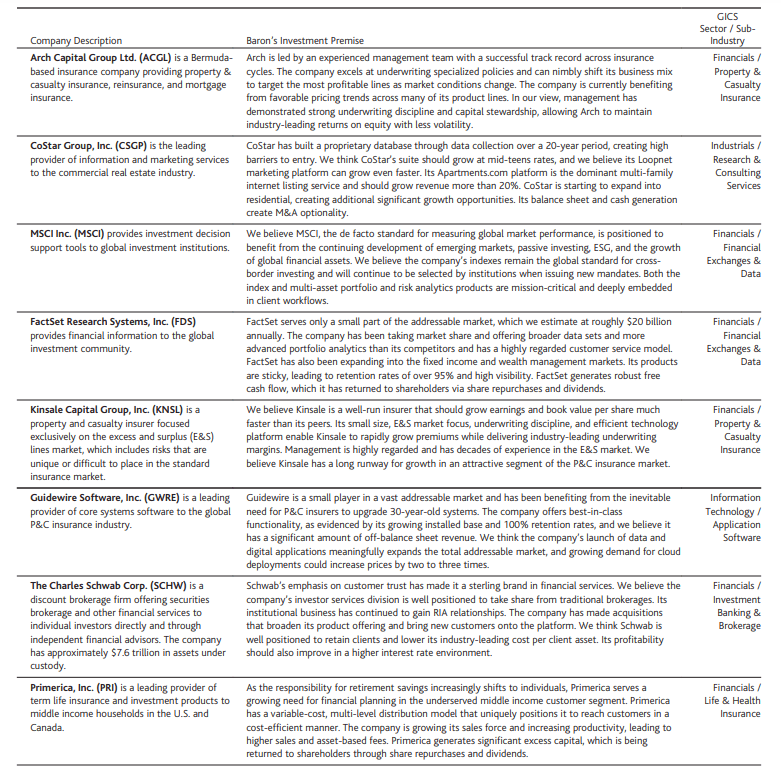
Appendix 2: Baron Funds Top 20 Financials-Related Holdings & Investment Premises-(Continued)
as of 3/31/2023
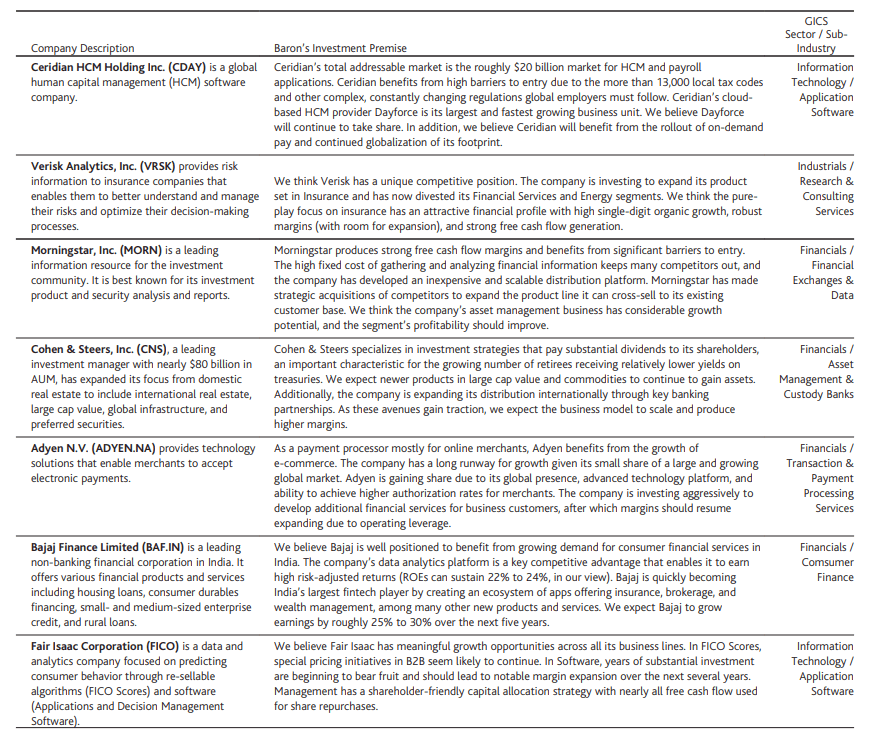
Appendix 2: Baron Funds Top 20 Financials-Related Holdings & Investment Premises-(Continued)
as of 3/31/2023
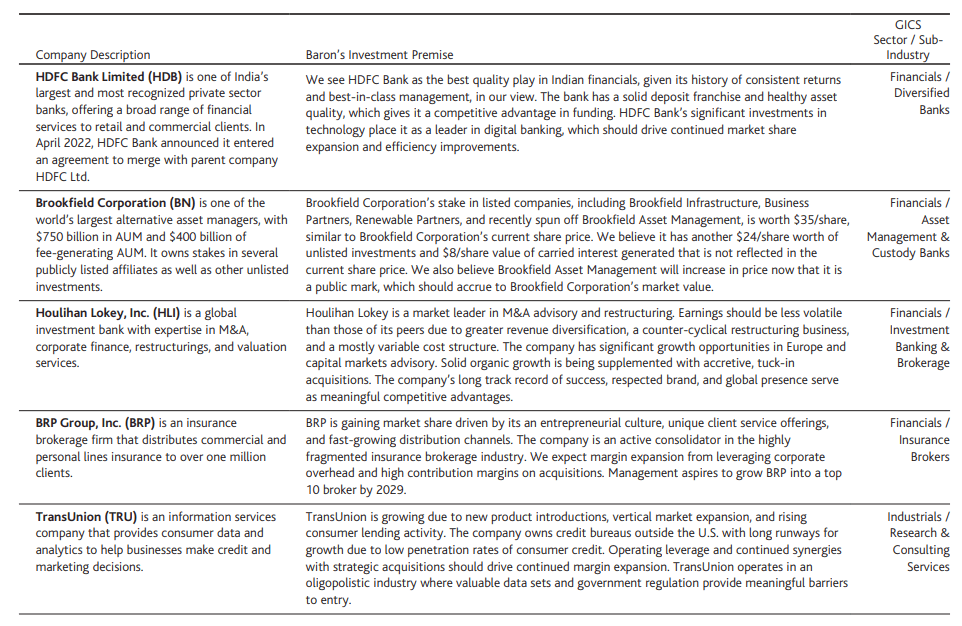
1 https://www.bls.gov/iag/tgs/iag52.htm
2 Value factor descriptors and weights in MSCI Barra's US Total Market Model for Long-Term Investors: (i) Book-to-Price (85%), (ii) Sales-to-Price (5%), (iii) Cash Flow-to-Price (5%), and (iv) Structural valuation factor (5%).
3 Our analysis is based on the 10th and 90th percentiles to mitigate the effects of outliers.
Editor's Note: The summary bullets for this article were chosen by Seeking Alpha editors.
For further details see:
Baron Funds Q1 2023 Report - Letter From Linda