ACGLO - Baron WealthBuilder Fund Q3 2023 Shareholder Letter
2023-11-10 10:20:00 ET
Summary
- Baron is an asset management firm focused on delivering growth equity investment solutions known for a long-term, fundamental, active approach to growth investing.
- Baron WealthBuilder Fund declined 4.83% in the most recent quarter, trailing the S&P 500 Index and the MSCI ACWI Index.
- Year-to-date, the Fund's performance modestly trails the Benchmark but exceeds the Global Index.
- The Fund has outperformed its indexes since its inception, with an annualized return of 11.26%.
Dear Baron Wealthbuilder Fund Shareholder: Performance
After a strong first half, Baron WealthBuilder Fund® (the Fund) declined in the most recent quarter. The Fund fell 4.83% (Institutional Shares) and trailed both its primary S&P 500 Index ( SP500, SPX, the Benchmark) and the MSCI ACWI Index (the Global Index) during the quarter. Those indexes declined 3.27% and 3.40%, respectively. The Morningstar Aggressive Allocation Category average (the Peer Group) declined 3.25% in the period.*
Year-to-date, the Fund’s performance modestly trails the Benchmark, but exceeds that of the Global Index. The Fund has appreciated 12.85%. The Benchmark and the Global Index have appreciated 13.07% and 10.06%, respectively. The Peer group increased 6.21% over this same period.
Despite a challenging and turbulent market for growth equities since the Fund’s founding, the Fund has outperformed its indexes since its inception. Since inception, the Fund has had an annualized return of 11.26%. This compares to the Benchmark’s and Global Index’s annualized returns of 10.48% and 6.29%, respectively.
Table I. Performance Annualized for periods ended September 30, 2023
| Baron Wealth Builder Fund Retail Shares 1,2 |
| Baron Wealth Builder Fund Institutional Shares 1,2 |
| Baron Wealth Builder Fund TA Shares 1 |
| S&P 500 Index 1 |
| MSCI ACWI Index 1 |
| Three Months3 |
| (4.93)% |
| (4.83)% |
| (4.84)% |
| (3.27)% |
| (3.40)% |
| Nine Months3 |
| 12.54% |
| 12.85% |
| 12.78% |
| 13.07% |
| 10.06% |
| One Year |
| 13.75% |
| 14.13% |
| 14.06% |
| 21.62% |
| 20.80% |
| Three Years |
| 2.71% |
| 3.01% |
| 2.96% |
| 10.15% |
| 6.89% |
| Five Years |
| 10.26% |
| 10.55% |
| 10.51% |
| 9.92% |
| 6.46% |
| Since Inception (December 29, 2017) |
| 10.99% |
| 11.26% |
| 11.25% |
| 10.48% |
| 6.29% |
| Performance listed in the above table is net of annual operating expenses. The gross annual expense ratio for the Retail Shares, Institutional Shares, and TA Shares as of December 31, 2022 was 1.40%, 1.14%, and 1.15%, respectively, but the net annual expense ratio was 1.36%, 1.11%, and 1.11% (includes acquired fund fees of 1.06%, net of expense reimbursements), respectively. The performance data quoted represents past performance. Past performance is no guarantee of future results. The investment return and principal value of an investment will fluctuate; an investor’s shares, when redeemed, may be worth more or less than their original cost. The Adviser reimburses certain Fund expenses pursuant to a contract expiring on August 29, 2034, unless renewed for another 11-year term and the Fund’s transfer agency expenses may be reduced by expense offsets from an unaffiliated transfer agent, without which performance would have been lower. BAMCO, Inc. (‘BAMCO” or the “Adviser”) has agreed that, pursuant to a contract expiring on August 29, 2034, unless renewed for another 11-year term, it will reimburse certain expenses of the Fund, limiting net annual operating expenses (portfolio transaction costs, interest, dividend, acquired fund fees and expenses and extraordinary expenses are not subject to the operating expense limitation) to 0.30% of average daily nest assets of Retail Shares, 0.05% of average daily net assets of Institutional Shares and 0.05% of average daily net assets of TA Shares, without which performance would have been lower. Current performance may be lower or higher than the performance data quoted. For performance information current to the most recent month end, visit Baron Funds - Asset Management for Growth Equity Investments or call 1-800-99-BARON. * As of 9/30/2023, the annualized returns of the Morningstar Aggressive Allocation Category average were 14.83%, 6.33%, 4.86%, and 4.64% for the 1-, 3-, 5-year, and since inception (12/29/2017) periods, respectively. 1 The S&P 500 Index measures the performance of 500 widely held large cap U.S. companies. The MSCI ACWI Index Net ((USD)) is an unmanaged, free float-adjusted market capitalization weighted index reflected in US dollars that measures the equity market performance of large- and mid-cap securities across developed and emerging markets. MSCI is the source and owner of the trademarks, service marks and copyrights related to the MSCI Indexes. The MSCI ACWI Index Net ((USD)) and the Fund include reinvestment of dividends, net of foreign withholding taxes, while the S&P 500 Index includes reinvestment of dividends before taxes. Reinvestment of dividends positively impacts performance results. The indexes are unmanaged. Index performance is not Fund performance; one cannot invest directly into an index. 2 The performance data in the table does not reflect the deduction of taxes that a shareholder would pay on Fund distributions or redemption of Fund shares. 3 Not annualized. |
In the third quarter, there was significant market volatility. Investors continued to speculate whether interest rate hikes will continue and how long rates will remain at current levels. There was mixed data about domestic employment, inflation, and major foreign economies. These macro factors have particularly weighed on valuations for small- and mid-cap growth businesses, which are heavily represented in the portfolio.
Investors continued to favor select mega-cap growth businesses. As Alex Umansky points out in the Baron Fifth Avenue Growth Fund September 30, 2023 letter, these companies are “very profitable, they have no or low debt, so they’re not highly levered, they have high returns on invested capital.” Essentially, they are viewed as safe bellwethers during an uncertain environment and also have improved prospects stemming from artificial intelligence advances. The seven largest technology-focused stocks (Microsoft, Apple, NVIDIA, Amazon, Meta, Tesla, and Alphabet) in the market-cap weighted S&P 500 Index represented 27.5% of the Benchmark and accounted for 85% of the Benchmark’s year-to-date return. With 417 underlying holdings in the Fund, Baron WealthBuilder is underweight all of these holdings except Tesla.
All but one of Baron WealthBuilder’s underlying funds declined in the period. Larger-cap strategies tended to retain value better than smaller-cap portfolios. Non-U.S. strategies also had higher rates of decline in the period. Our real estate strategies were negatively impacted by overarching macroeconomic trends and investor sentiment.
Although our style of investing was largely out of favor during this period, we did have pockets of good performance in often overlooked growth segments. The Financials sector has an average portfolio weight of 18.3%. It is only 12.7% of the Benchmark. The returns of our stocks in this sector were 3.40%, while Financials in the Benchmark returned -1.13%. Additionally, the underlying funds had exposure to an array of financial- related businesses that also performed quite well. Out of the top six contributors to performance in the quarter, five ( Guidewire Software, Inc. , FactSet Research Systems Inc. , Arch Capital Group Ltd. , MSCI Inc. , and Kinsale Capital Group, Inc. ) were financial-related businesses. Higher interest rates and improved insurance prices should boost the earnings of unique insurers like Arch Capital ( ACGL ) and Kinsale ( KNSL ) for years to come. Technology companies servicing financial end markets also performed particularly well in the period. This group includes FactSet ( FDS ), MSCI , and Guidewire ( GWRE ). Their end markets are highly regulated and vital. Our competitively advantaged businesses that serve these markets are generally insulated from difficult macroeconomic environments. The businesses owned in the Fund continued to execute on their growth opportunities. There was a perception that FactSet and MSCI’s clients were under significant pressure. While client spending has moderated slightly, retention has remained high for both companies. FactSet has expanded its product offering, added different types of users, and managed expense growth appropriately. We expect FactSet to maintain steady growth in various channels while also expanding margins. MSCI’s business has also been more resilient than many anticipated. New MSCI offerings in private assets information should expand its addressable market. And finally, Guidewire is nearing the end of its costly technological cloud migration. New deals are improving meaningfully, and infrastructure and research & development costs are being reallocated towards product development. We believe margins should increase over time.
Vertiv Holdings Co ( VRT ) was the only non-financial holding in the top six. This business is benefiting from the AI revolution that is also driving the stock prices of many technology behemoths. Vertiv provides cooling and power management for data centers, essential infrastructure to enable AI. AI has higher energy density and requires more cooling than other data center use cases. Vertiv’s total addressable market is expanding. The company recently exceeded investors’ revenue and earnings expectations and provided an upbeat prospect for its growth.
While these holdings helped blunt some of the market pressures, it was not able to overcome the downdraft in the rest of the underlying funds. The biggest detractors were steadier growth businesses like IDEXX Laboratories, Inc. ( IDXX ) and CoStar Group, Inc. ( CSGP ) Consumers, feeling the pressure from a slowing job market and higher inflation, may pause future discretionary purchases of IDEXX’s veterinary lab services. Negative sentiment for the real estate segment (of which CoStar is a data provider) impacted stock prices. But the most significant valuation contraction occurred when there was not a clear catalyst to revitalize growth. Iridium Communications Inc. ’s ( IRDM ) stock price decline was particularly pronounced and was the second largest detractor in the quarter. The satellite company’s future growth is moderating. Tailwinds for the more mature Voice and Data service, which requires expensive hardware, is abating. Internet of Things services, while still exhibiting solid growth, had declining average revenue per user. A shift towards individual customers from industrial use cases is pressuring average user fees. Government services have already been contracted for the next few years. We had anticipated growth would be reinvigorated by its direct-to-device offering. However, Apple entered a deal with a competitor. While Iridium partnered with Qualcomm, this service has yet to be contracted in with major device manufacturers. It is unclear when these deals will be announced or if consumers will be willing to pay for the service. The uncertainty has given some investors pause. We remain confident that the service will eventually be widely available and become a standard offering in future personal devices. However, the timeline for a potentially ubiquitous offering is uncertain.
We encourage you to read the various quarterly letters found on our website and in our full report to gain a deeper understanding of the funds that make up Baron WealthBuilder Fund.
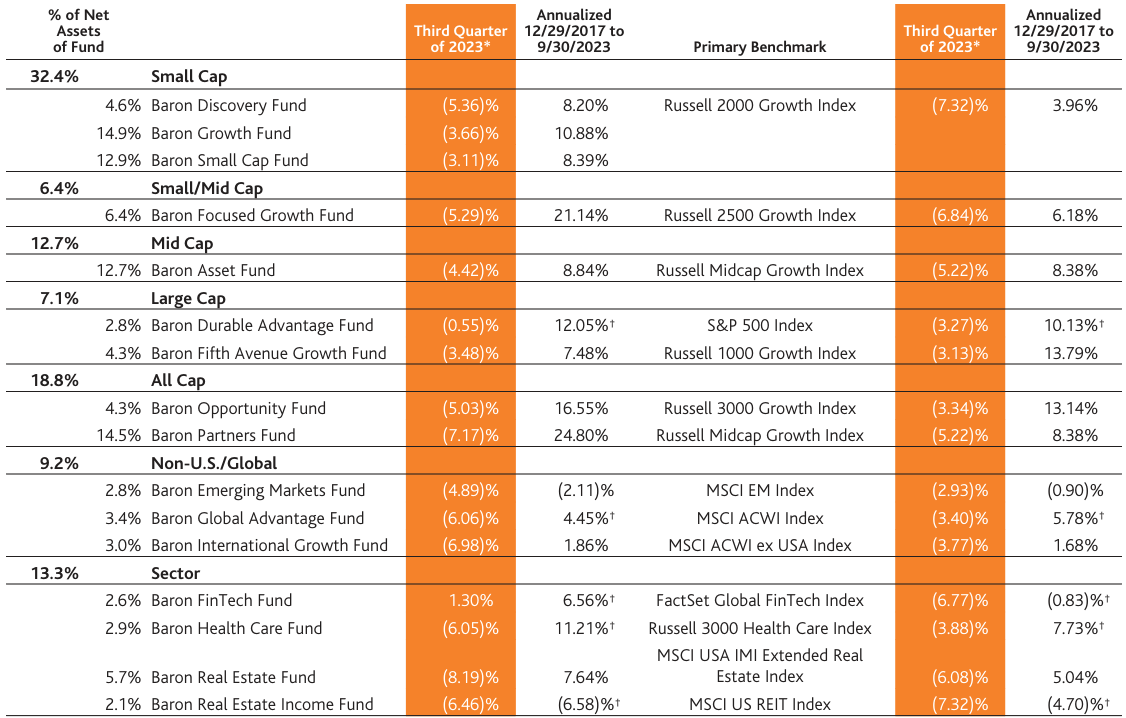
Table II. Baron Funds Performance as of September 30, 2023 - Institutional Share Class Data
| * Not annualized. † Performance is calculated from the time the Fund was added to Baron WealthBuilder Fund: Baron Durable Advantage Fund – 3/13/2018; Baron Global Advantage Fund – 1/9/2018; Baron FinTech Fund – 2/27/2020; Baron Health Care Fund – 10/18/2018; and Baron Real Estate Income Fund – 5/17/2021. Performance data quoted represents past performance. Past performance is no guarantee of future results. The indexes are unmanaged. The index performance is not Fund performance; one cannot invest directly into an index. |
Fund of Funds Structure and Investment Strategy
The Fund is a compilation of our Baron Funds and provides broad equity exposure. All underlying Baron Funds follow a consistent investment philosophy and process. We do not try to mimic the indexes, and we do not alter our strategy to coincide with short-term macro events that we regard as unpredictable. We remain focused on underlying business fundamentals.
We believe small- and mid-cap growth stocks offer attractive return potential relative to their risk over the long term. Small- and mid-cap businesses represent 67.4% of the Fund (compared to only 17.8% for the Benchmark). While our small- and mid-cap growth investments have been successful over our Firm’s 41-year history, these styles are occasionally out of favor. Today’s environment is one of those times. Large-cap growth companies outperformed small-cap growth companies in the quarter and in many instances over the last decade. Since inception of the Fund, the 1-year rolling monthly returns of the Russell 1000 Growth Index have outperformed the Russell 2000 Growth Index 74% of the time. This includes four out of the past five calendar years, and 2023 is shaping up to be no different.
Rather than only examining the Fund’s performance over a quarter or a year, we believe it is equally important to understand how the Fund has performed over the course of an economic cycle. The COVID-19 Pandemic and subsequent Macro-Induced Market Rotation has been very difficult for small- and mid-sized growth companies. Investors have favored larger-cap, value-oriented businesses that are deemed safer during a time of uncertainty. We believe this offers a great opportunity for long-term investors to invest in small- and mid-cap growth businesses at attractive prices. Markets first peaked in late February 2020 before rapidly dropping as the economy braced for the COVID-19 Pandemic. It recovered quickly followed by another sizable drop based on macroeconomic factors. Over the three years of the COVID-19 Pandemic ended 12/31/2022, the Russell 2000 Growth Index, a small-cap growth index, gained only 1.96% on a cumulative basis. The Russell Midcap Growth Index fared better with a cumulative 3-year return of 12.00%. With that backdrop, the Fund performed better and appreciated 28.11%. We believe protecting and growing clients’ assets during this challenging period positions long-term investors well for meaningful appreciation once the macro landscape changes. Table III provides a more complete look at how the Fund and various indexes performed during the pandemic and its aftermath.
We do not yet know if the challenges caused by the COVID-19 Pandemic will persist. Volatility has remained high, but we are hopeful that interest rate increases, policy factors, and COVID-19 hangovers are ending. Growth has recently begun to outperform value. But safer large caps have continued to perform better than smaller companies. So far, we are optimistic that companies will again be valued on their fundamentals rather than on macroeconomic concerns. We have started to see the performance of some individual securities diverge. This divergence of returns, we believe, should favor growth investors. As discussed, the Fund’s performance has kept pace with the large-cap Benchmark since the start of the year. However, the Fund’s return has continued to meaningfully exceed small- and mid- cap growth indexes.
Table III. Cumulative performance throughout the pandemic and its aftermath
| Pre-COVID |
| COVID Panic |
| COVID New Normal |
| Macro Induced Market Rotation |
| COVID Pandemic Cycle |
| Conclusion of COVID Pandemic Cycle to Present |
| 12/31/2019 to 2/19/2020 |
| 2/19/2020 to 3/23/2020 |
| 3/23/2020 to 11/18/2021 |
| 11/18/2021 to 12/31/2022 |
| 12/31/2019 to 12/31/2022 |
| 12/31/2022 to 9/30/2023 |
| Baron WealthBuilder Fund (Institutional Shares) |
| 13.84% |
| (38.48)% |
| 179.85% |
| (34.64)% |
| 28.11% |
| 12.85% |
| S&P 500 Index |
| 5.08% |
| (33.79)% |
| 115.86% |
| (16.91)% |
| 24.79% |
| 13.07% |
| MSCI ACWI Index |
| 2.74% |
| (33.64)% |
| 102.32% |
| (18.44)% |
| 12.50% |
| 10.06% |
| Russell 2000 Growth Index |
| 5.09% |
| (38.46)% |
| 129.58% |
| (31.34)% |
| 1.96% |
| 5.24% |
| Russell Midcap Growth Index |
| 6.97% |
| (35.71)% |
| 134.05% |
| (30.42)% |
| 12.00% |
| 9.88% |
| Performance data quoted represents past performance. Past performance is no guarantee of future results. The indexes are unmanaged. The index performance is not Fund performance; one cannot invest directly into an index. |
Table IV. Performance based characteristics since inception through September 30, 2023
| Baron WealthBuilder Fund (Institutional Shares) |
| S&P 500 Index |
| Morningstar Allocation 85% + Equity Category |
| Alpha (%) – Annualized |
| (0.37) |
| 0.00 |
| (4.61) |
| Beta |
| 1.18 |
| 1.00 |
| 0.92 |
| Sharpe Ratio |
| 0.41 |
| 0.48 |
| 0.17 |
| Standard Deviation (%) – Annualized |
| 23.18 |
| 18.03 |
| 16.98 |
| Upside Capture (%) |
| 109.51 |
| 100.00 |
| 80.39 |
| Downside Capture (%) |
| 110.08 |
| 100.00 |
| 97.46 |
| Source: FactSet SPAR. Except for Standard Deviation and Sharpe Ratio, the performance based characteristics above were calculated relative to the S&P 500 Index. |
Table V. Sector exposures as of September 30, 2023
For further details see:
Baron WealthBuilder Fund Q3 2023 Shareholder Letter