NEM - Barrick Gold: A Solid Gold Producer Trading At A Discount
2023-09-04 11:44:04 ET
Summary
- Barrick Gold released its second quarter 2023 results, reporting a decrease in net earnings income compared to the previous year.
- The company is on track to achieve its 2023 production guidance for gold and copper, with a strong performance expected in the second half of the year.
- I recommend buying GOLD between $15.55 and $15.1, with lower potential support at $14.85.
Introduction
Toronto-based Barrick Gold (GOLD) released its second quarter 2023 results on August 8, 2023.
Note: This article updates my May 21, 2022 article . I have followed GOLD on Seeking Alpha since April 2015.
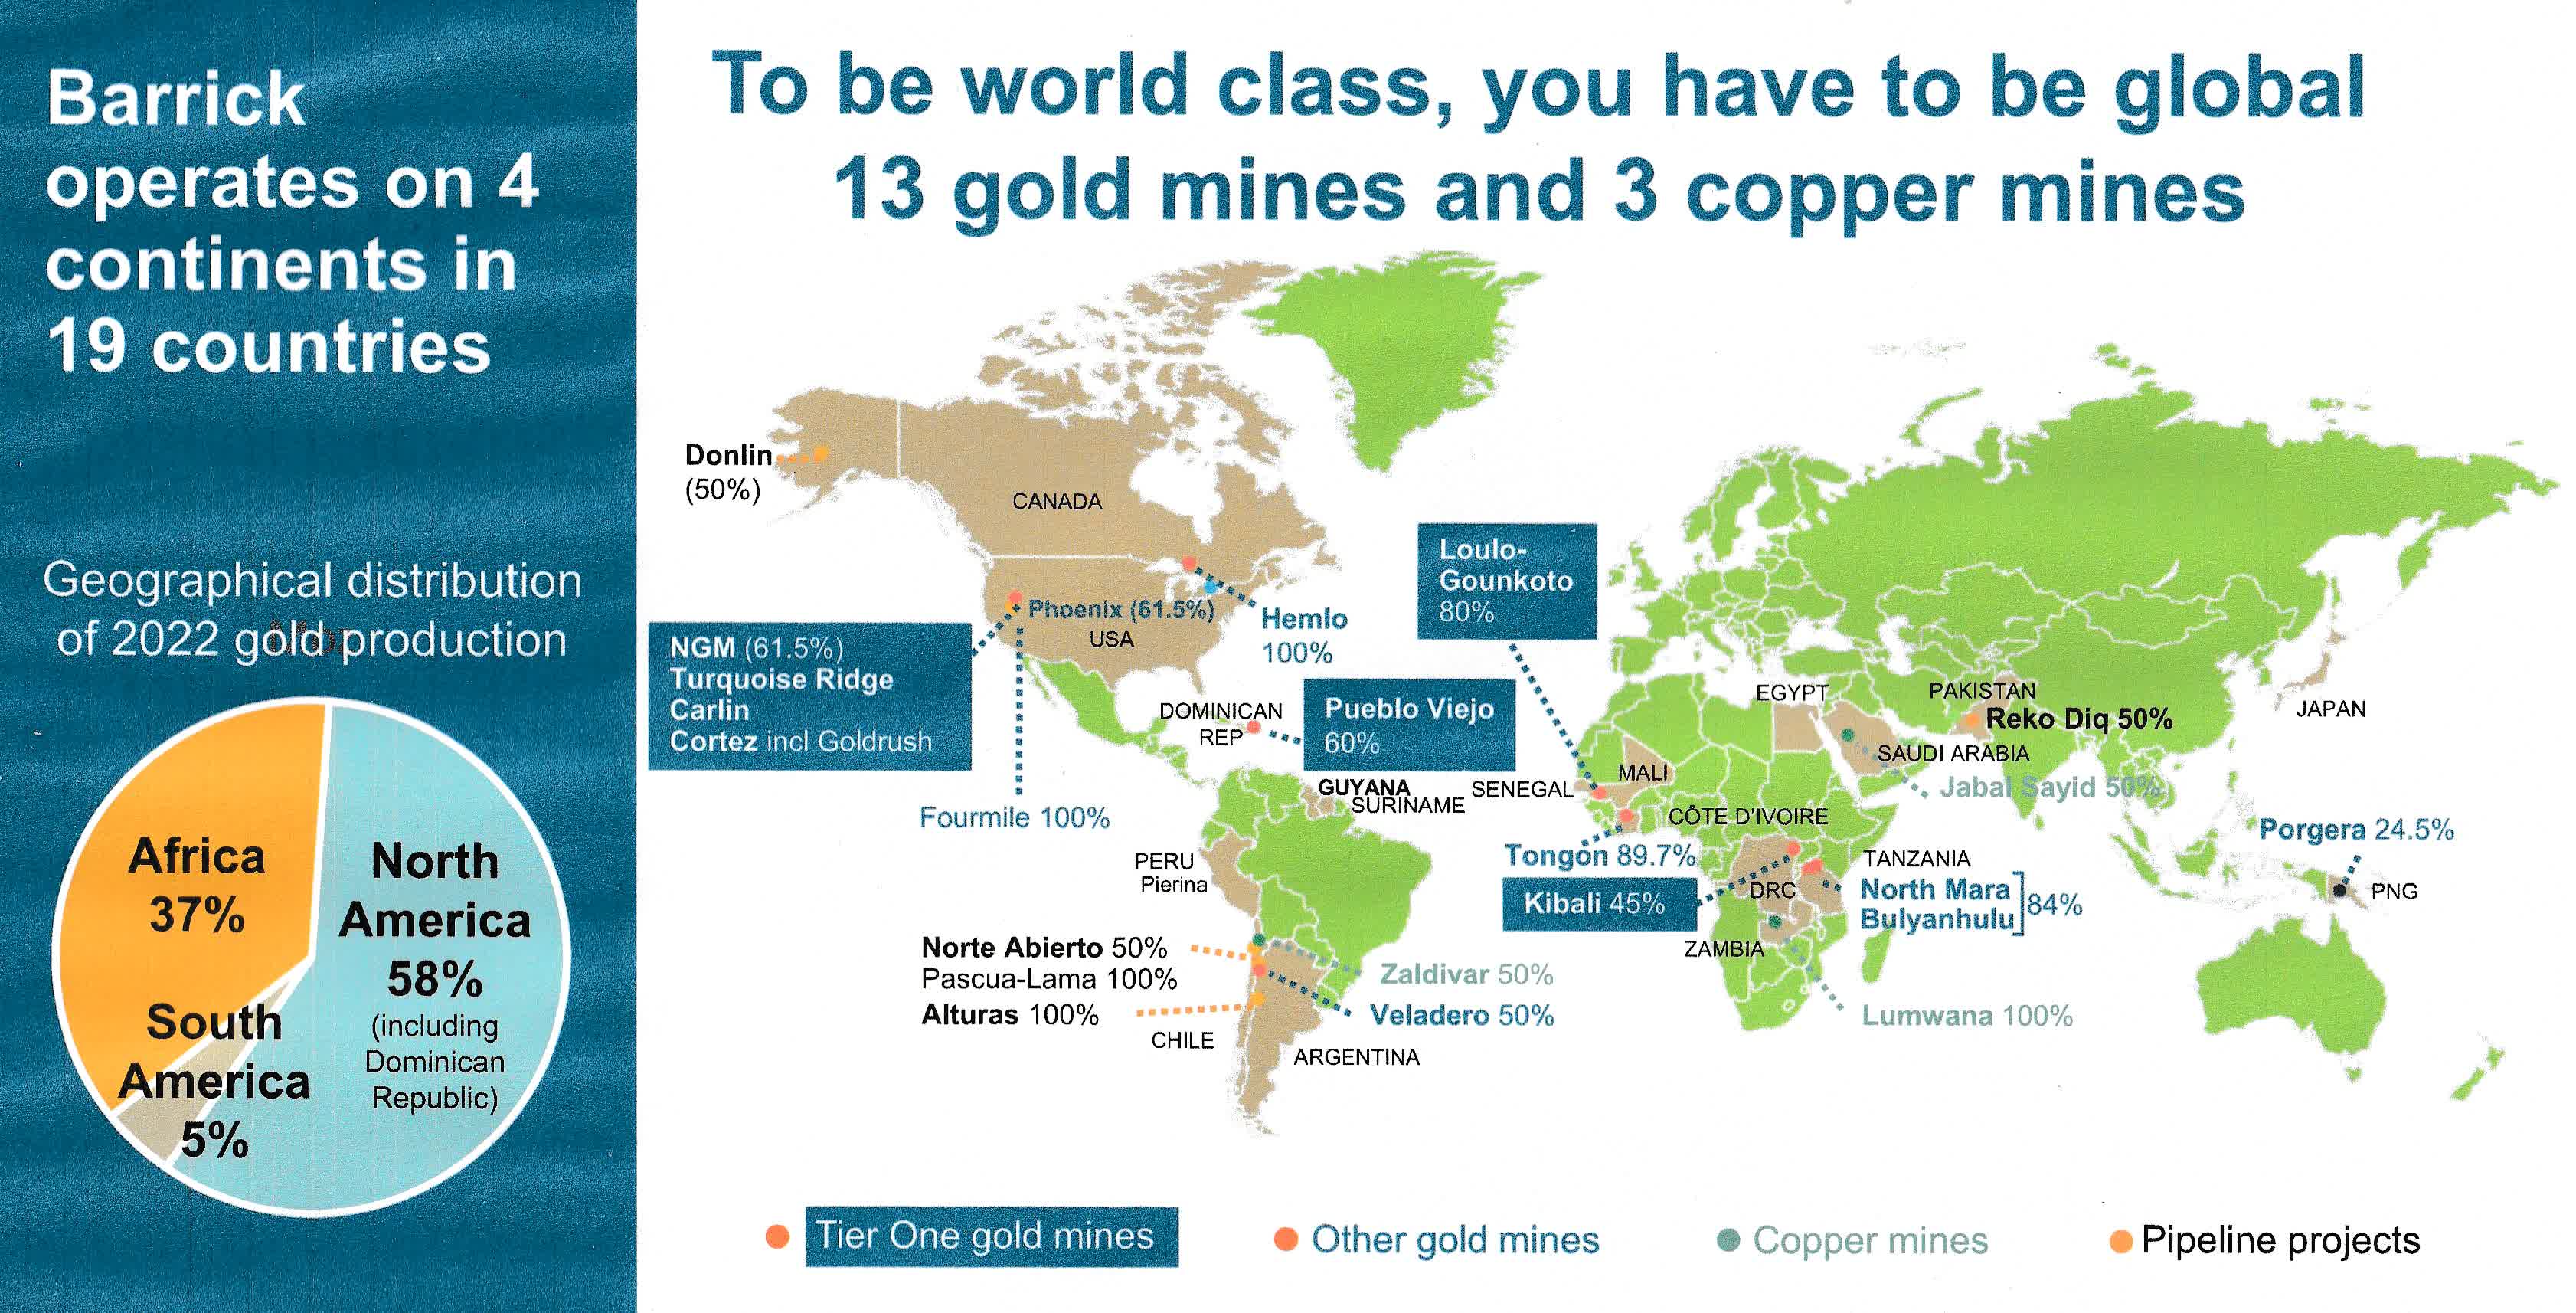
GOLD Assets Map (GOLD Presentation)
Barrick Gold published a great presentation in August showing the company's geographical distribution of 2022 gold and copper production. North and South America represented 63% of the total output, and Central and East Africa represented 37% , with 13 gold mines and 3 copper mines.
CEO Mark Bristow said in the conference call :
[W]e have a clear path to increasing our gold equivalent ounces by 25% towards the end of '29. And that is a very significant and a standout point because as you know, many of our peers have been forced into M&A because they just haven't been able to replace the ounces that they've mined.
1 - 2Q23 results snapshot
Barrick reported a net earnings income of $305 million or $0.17 per diluted share in 2Q23, down from $488 million or $0.27 in the year-ago quarter.
In the three months ended June 30, 2023, we generated $832 million in operating cash flow, compared to $776 million in the prior quarter. The increase of $56 million was primarily due to an increase in realized gold prices1 , lower total cash costs/C1 cash costs per ounce/pound, as well as higher gold and copper sales volumes, partially offset by a decrease in realized copper prices. ( Press release )
Production for the second quarter was 1,009K oz (sold 1,001K oz) of gold and 107 Mlbs of Copper (sold 101 Moz) . Copper production increased by 21.6% year over year. The average realized copper price was $3.70 , down 11.9% YoY. Porgera was excluded from our 2023 guidance.
The resolution of this tax dispute satisfies one of the conditions to the reopening of the Porgera mine under the Commencement Agreement, and has allowed the parties to work toward the reopening of the mine by the end of 2023. (Press release)
The company is on track to achieve 2023 Guidance of 4.2 to 4.6 Moz of Gold and 420 to 470 Mlb of Copper, with a strong performance expected in H2 2023.
The ramp up of the plant expansion at Pueblo Viejo is anticipated to positively impact the third quarter of 2023 as well as higher grades from Cortez and Carlin open pits due to mine sequencing. As a result, we expect the Company's gold production in the second half of 2023 to be stronger than the first half. (Press release)
The average market price for gold in 2Q23 was $1,972 per ounce , up from $1,861 in 2Q22. Production increased sequentially.
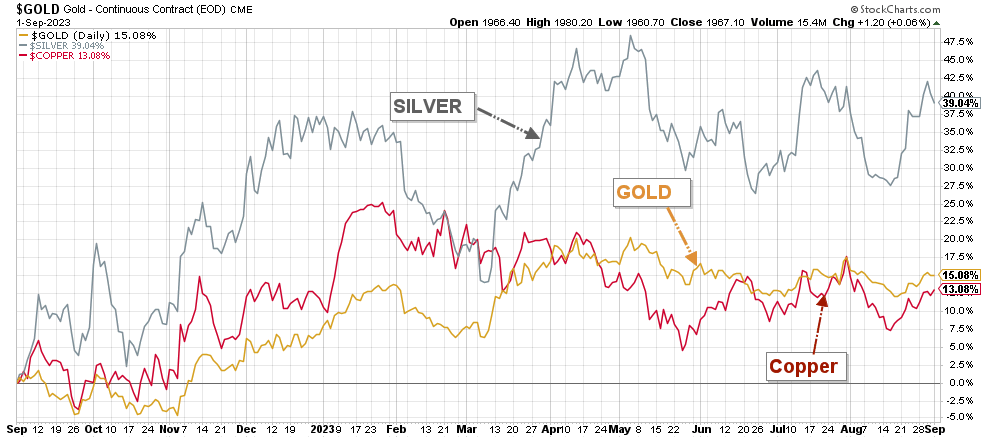
GOLD 1-Year Charat Gold Silver Copper (Fun Trading )
2 - Stock performance
Barrick Gold is one of the three gold miners that I consider my core long-term "gold miners," together with Newmont ( NEM ) and Agnico Eagle ( AEM ).
GOLD is up 8% in one year, underperforming Agnico Eagle. However, NEM is lagging and is down 6% on a one-year basis.
Note: I recommend reading my recent article on AEM by clicking here and my recent article on NEM by clicking here .
3 - Investment thesis
As I have said in my preceding articles, the investment thesis has not changed for many years, and I still recommend keeping a long-term GOLD core position.
Agnico Eagle, Newmont Corporation, and Barrick Gold Corporation have been my selected gold miners for years.
GOLD is highly correlated to the gold price, even if the company produces a significant Copper amount.
It looks like the Gold price is slowly turning bullish, reacting to the FED signal of a potential definite pause in early 2024, with eventually one more 25-point increase in December this year.
So far, September continues what we have experienced in the last several months. Gold is slowly going up again.
However, the Federal Reserve will continue to have a major influence on what happens next. Recently, the market has been speculating that the Federal Reserve will be softening its monetary policy after the annual inflation rate in the US accelerated to 3.2% in July 2023 from 3% in June, but below forecasts of 3.3%. I will not be surprised if Gold crosses $2,000 again before the end of 2023.
Gold and Silver's prices are up 15% and 39% YoY, whereas Copper is up 13% .
GOLD 1-Year Chart Gold, Silver, Copper (Fun Trading StockCharts)
Thus, because of the wild fluctuations in the price of gold, I recommend trading short-term LIFO at a minimum of 30% of your GOLD position. I believe it is crucial and will help you to reduce the risk and increase your return significantly by generating recurring short-term gains.
CEO Mark Bristow said in the conference call:
I think I felt I should start on a good news story. And that is that -- and I'm sure you all know this, certainly those sitting in the hall here, that we saw the average gold price for the last quarter at an all-time high. And it's interesting, a lot of people are suggesting that the gold price is not performing. It's performing extremely well. And for me, the more interesting part is that some see this as driven by a forecast decline in interest rates.
Barrick Gold - Balance Sheet History until 2Q23 and Production Data: The Raw Numbers
| Barrick Gold |
| 2Q22 |
| 3Q22 |
| 4Q22 |
| 1Q23 |
| 2Q23 |
| Total Revenues in $ billion |
| 2.859 |
| 2.527 |
| 2.774 |
| 2,643 |
| 2,833 |
| Net Income in $ billion |
| 0.488 |
| 241 |
| -735 |
| 120 |
| 305 |
| EBITDA $ billion |
| 1.557 |
| 1.169 |
| -194 |
| 1,088 |
| 1,290 |
| EPS diluted in $/share |
| 0.27 |
| 0.14 |
| -0.42 |
| 0.07 |
| 0.17 |
| Cash from operations in $ million |
| 0.924 |
| 0.758 |
| 0.795 |
| 0.776 |
| 0.832 |
| Capital Expenditure in $ million |
| 755 |
| 0.792 |
| 0.891 |
| 0.688 |
| 0.769 |
| Free Cash Flow in $ million |
| 169 |
| -34 |
| -96 |
| 88 |
| 63 |
| Total cash $ billion |
| 5.78 |
| 5.24 |
| 4.44 |
| 4.38 |
| 4.16 |
| Long-term Debt in $ billion |
| 5.14 |
| 5.10 |
| 4.78 |
| 4.78 |
| 4.77 |
| Dividend per share in $ |
| 0.20 |
| 0.15 |
| 0.10 |
| 0.10 |
| 0.10 |
| Shares outstanding (diluted) in billion |
| 1.777 |
| 1.768 |
| 1.759 |
| 1.755 |
| 1.755 |
| Gold Production |
| 2Q22 |
| 3Q22 |
| 4Q22 |
| 1Q23 |
| 2Q23 |
| Gold Production K Oz |
| 1,043 |
| 988 |
| 1,120 |
| 952 |
| 1,009 |
| Copper Production Mlbs |
| 120 |
| 123 |
| 96 |
| 88 |
| 107 |
| AISC $/Oz by-product |
| 1,212 |
| 1,269 |
| 1,242 |
| 1,370 |
| 1,355 |
| Gold price realized $/Oz |
| 1,871 |
| 1,722 |
| 1,728 |
| 1,902 |
| 1,972 |
Data Source: Company press release
Part I - Barrick Gold - Balance Sheet Analysis
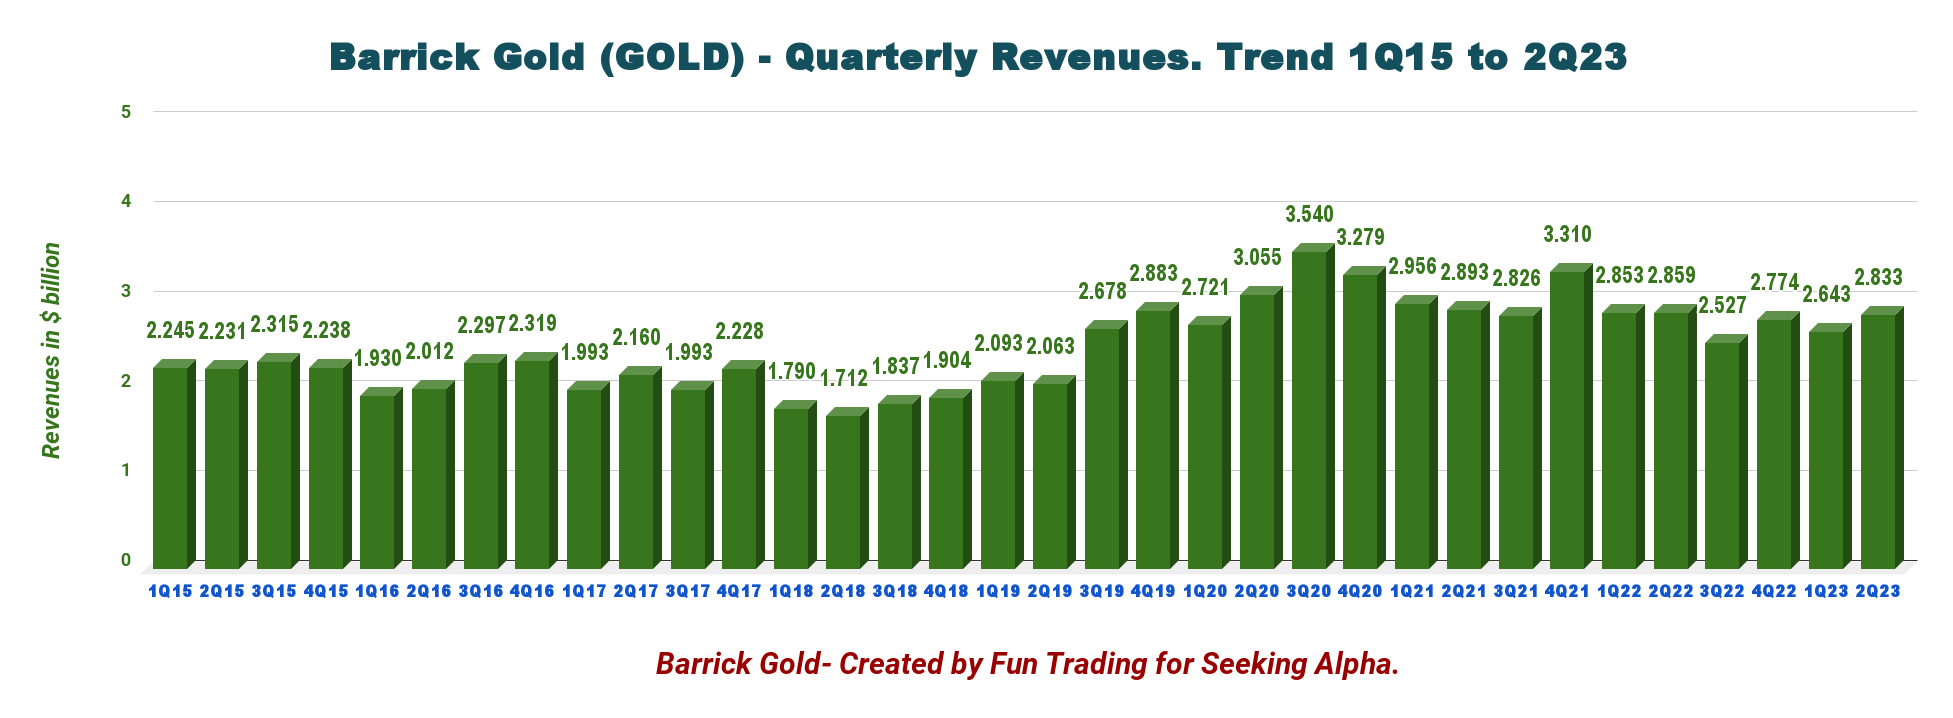
1 - Revenue details. GOLD earned $2,833 billion in 2Q23
GOLD Quarterly Revenue History (Fun Trading)
Barrick reported its second quarter 2023 results on August 8, 2023. Barrick recorded total sales of $2,833 million , down 1% year-over-year. Gold revenue represents 91.2% of the total revenue in 2Q23.
| Revenue per metal in 2Q23 |
| USD |
| Gold |
| 2,584 |
| Copper |
| 189 |
| Other Sales |
| 60 |
| Total |
| 2833 |
The company's net income was $305 million , or $0.17 per diluted share, in the second quarter of 2023, compared to an income of $488 million, or $0.27 per share, in the year-ago quarter.
After adjusting for items not indicative of future operating earnings, adjusted net earnings were $336 million .
Net cash from operating activities decreased 10% year-over-year to $832 million compared to $924 million a year ago, with a gold price reaching $1,972 per ounce this quarter.
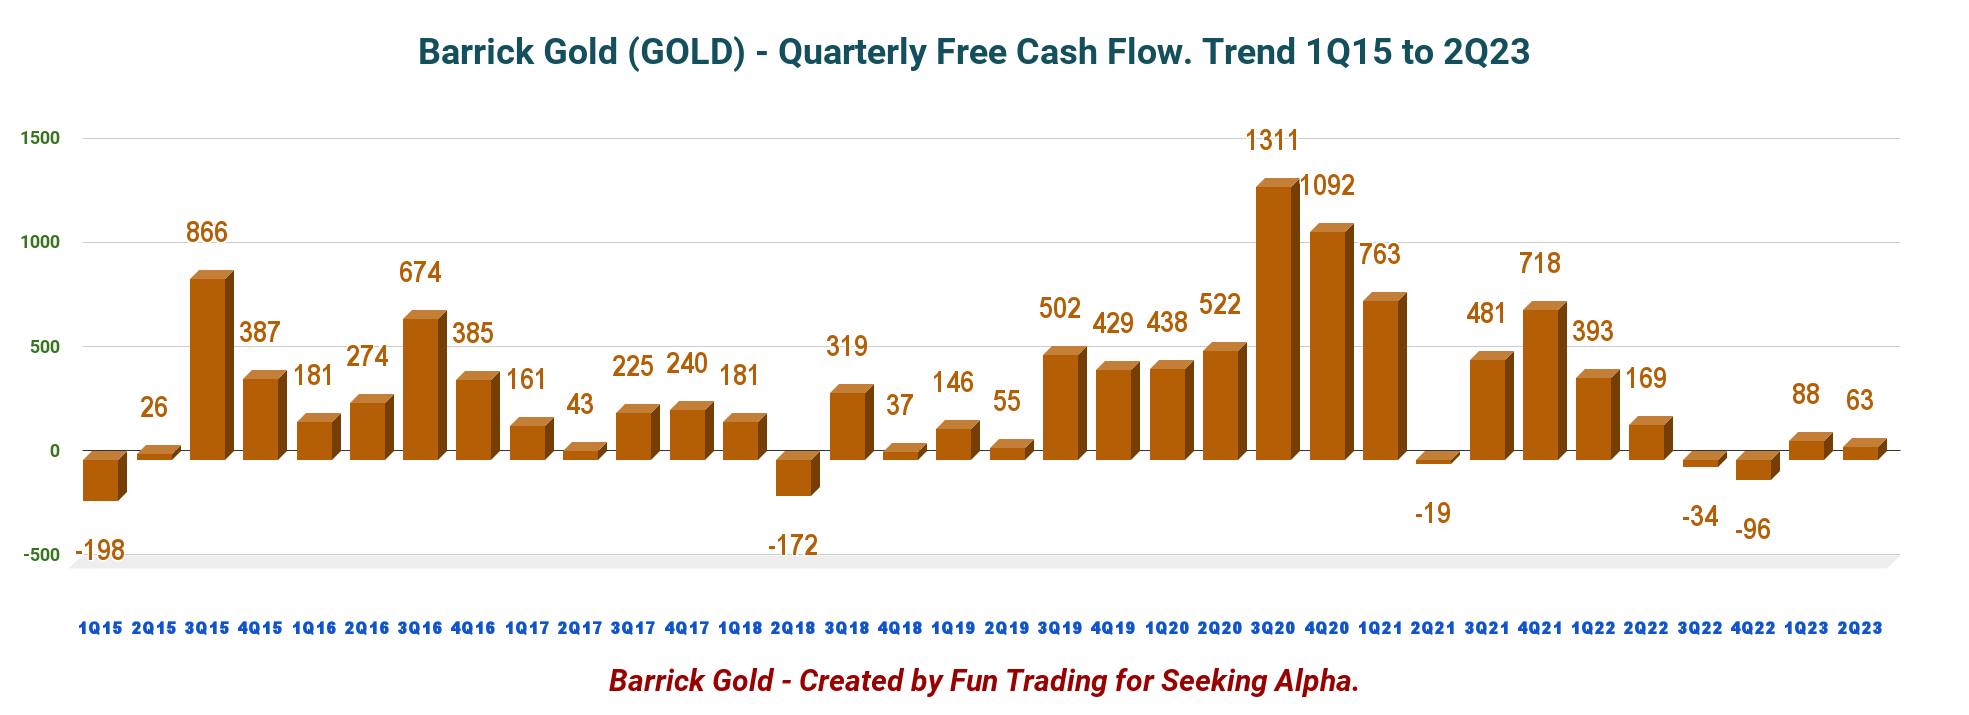
2 - Free cash flow was a loss of $63 million in 2Q23
GOLD Quarterly Free Cash Flow History (Fun Trading)
Note: The generic free cash flow is the cash from operations minus CapEx.
The free cash flow for the quarter was $63 million , and the trailing 12-month free cash flow is $21 million . FCF is expected to increase in H2 2023.
Barrick Gold declared a quarterly dividend of $0.10 per share, consistent with the company's dividend policy. It has a dividend yield of 2.48% .
The company has a share buyback program but has not purchased shares.
At the February 14, 2023 meeting, the Board of Directors authorized a new share buyback program for the purchase of up to $1 billion of Barrick's outstanding shares over the next 12 months. As at June 30, 2023, we have not purchased any shares under this program in 2023.
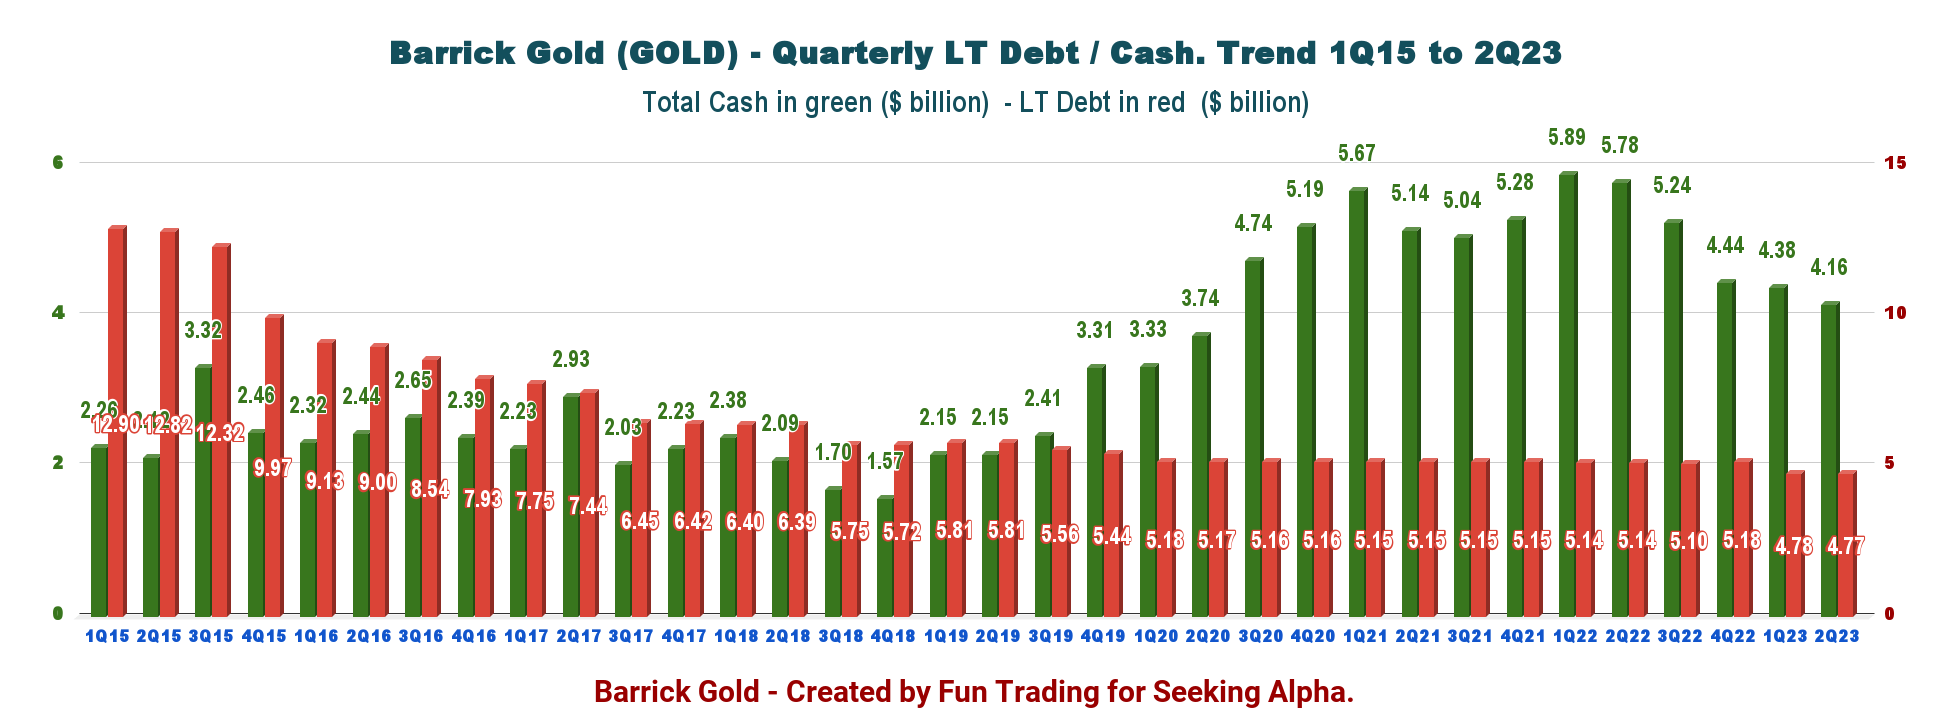
3 - N et debt was $617 million, and cash on hand of $4,157 million in 2Q23
GOLD Quarterly Cash versus Debt History (Fun Trading)
Total debt was down to $4,774 million at the end of the second quarter, and the total cash was $4,157 million . The company has an excellent debt position with a net debt of $617 million .
Part II - 2Q23 Gold Production and Commentary
The company reported second-quarter production for gold of 1,009K Au ounces (sold 1,001K Oz) and 107M Cu Lbs (sold 88M Cu Lbs) .
The average price for gold in the second quarter was $1,972 per ounce, while the average copper price was $3.70 per pound. AISC was high this quarter at $1,355 per ounce.
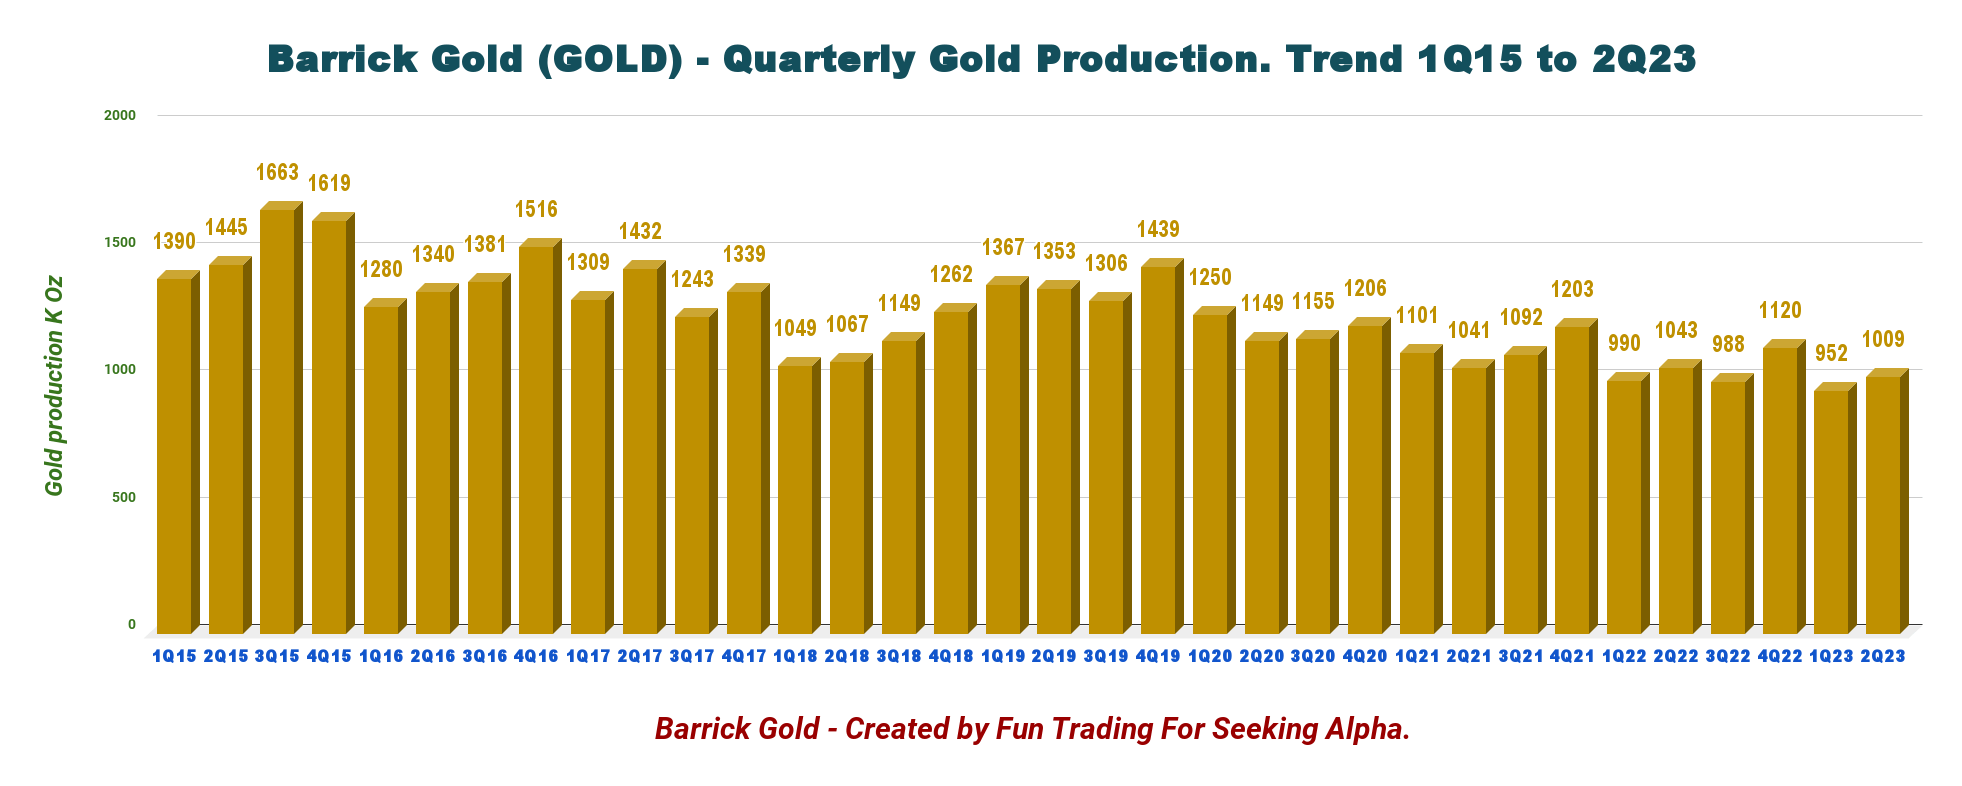
1 - Gold production details and historical charts
2Q23 production increased sequentially to 1,009K Au Oz due to higher gold sales volume primarily due to a stronger performance from Carlin following significant planned maintenance activity undertaken in the first four months of the year. Also, higher grades at Kibali helped.
This was partially offset by lower production at Cortez due to mine sequencing, Turquoise Ridge due to planned autoclave maintenance, and Pueblo Viejo, where tie-in work and commissioning of the plant expansion project impacted production, as shown below:
GOLD Quarterly Gold Production History (Fun Trading)
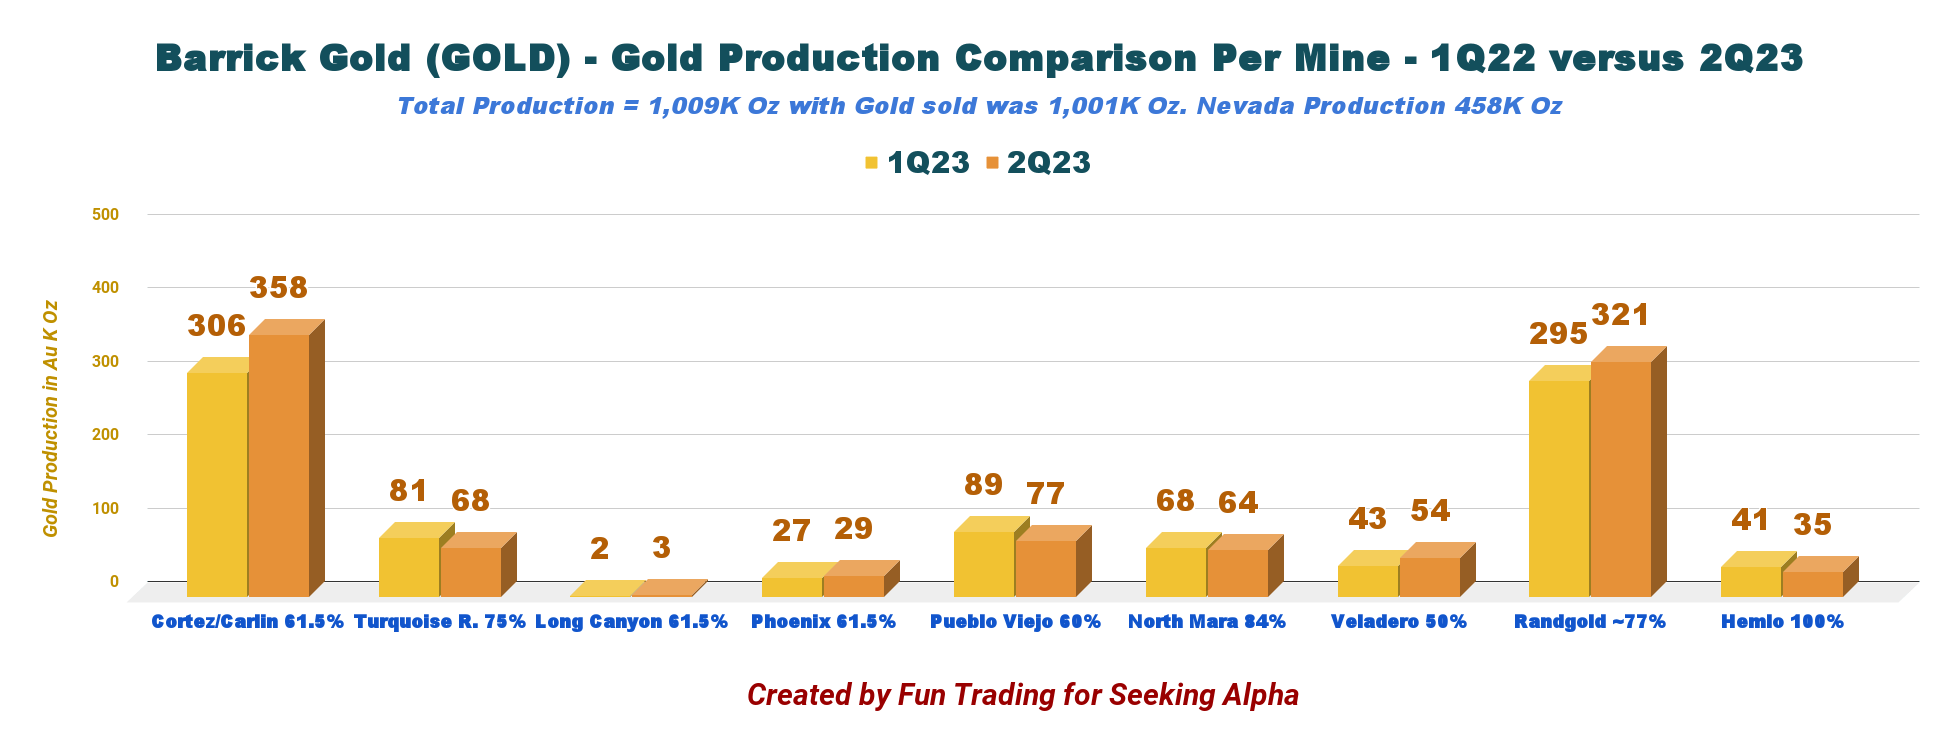
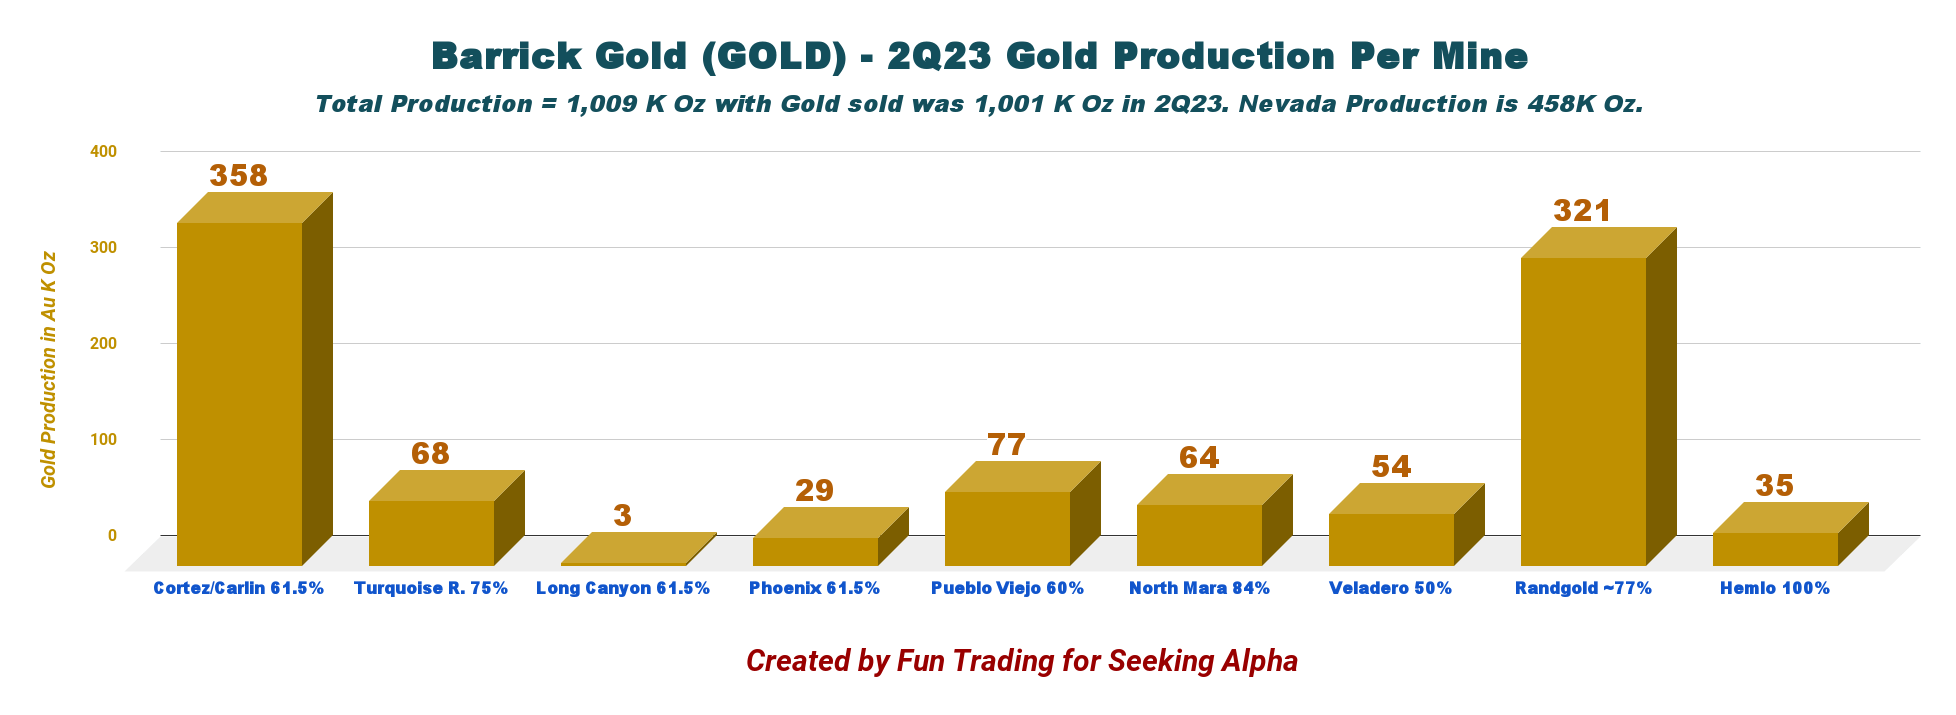
Below is shown production per mine.
Note: JV Nevada represents five gold mines: Cortez, Carlin, Turquoise, Long Canyon, and Phoenix. Also, Randgold represents four mines: Loulo-Gounkoto, Kibali, Tongon, and Bulyanhulu.
GOLD 2Q23 Gold Production per Mine (Fun Trading)
Note: The Porgera Mine is expected to restart production at the end of 2023.
On June 20, 2023, the PNG IRC, the Commissioner General, Barrick and BNL entered into a settlement agreement to resolve a dispute regarding tax assessments issued by the IRC against BNL. The resolution of this tax dispute satisfies one of the conditions to the reopening of the Porgera mine under the Commencement Agreement, and has allowed the parties to work toward the reopening of the mine by the end of 2023 . (Press release)
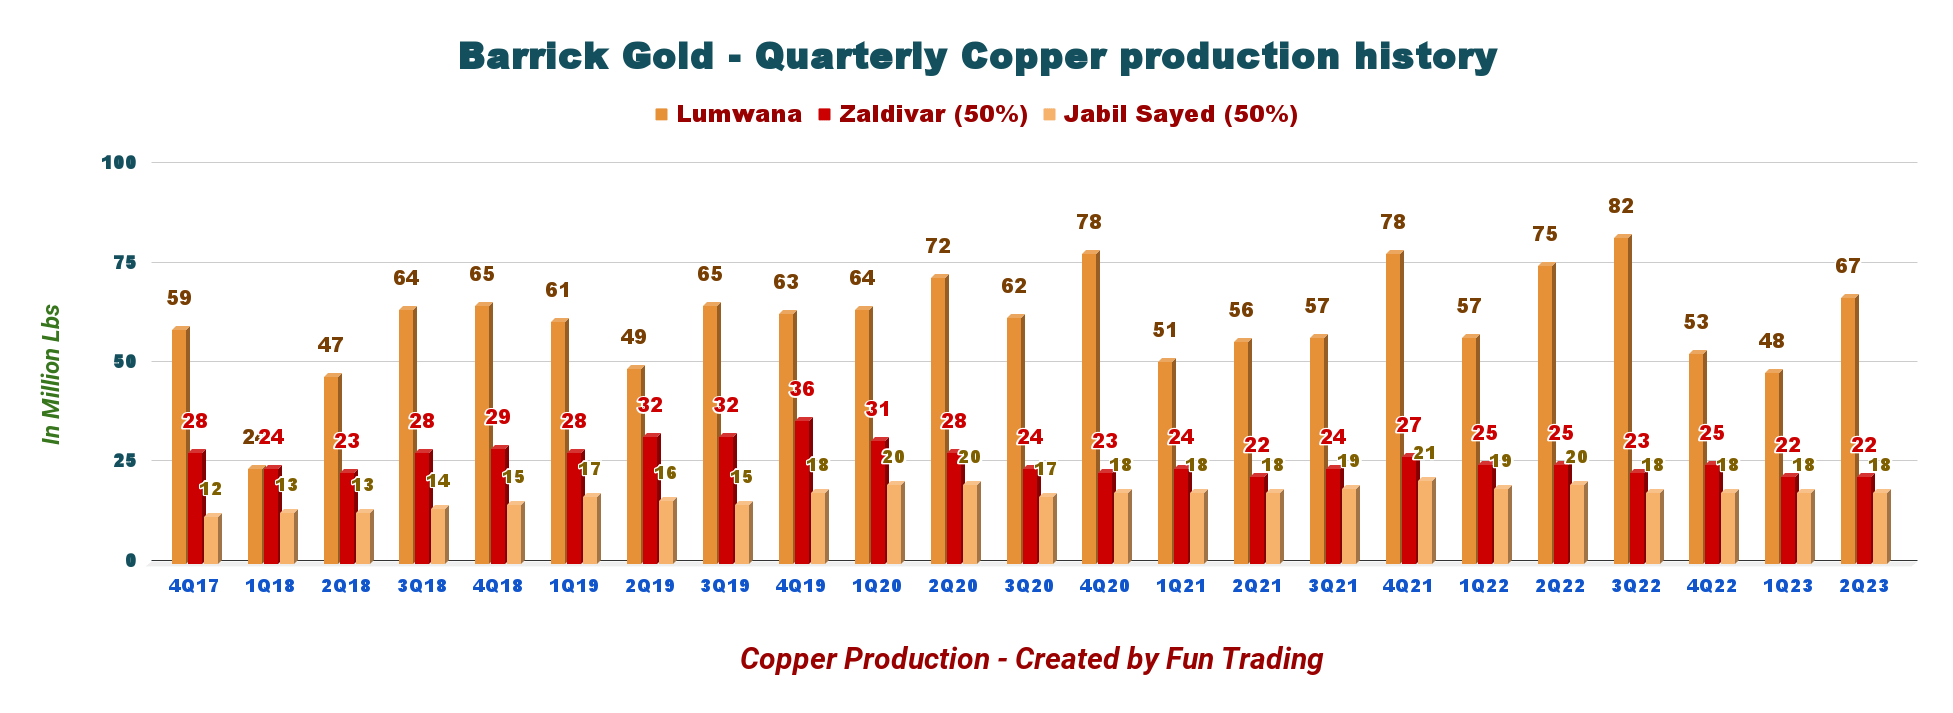
2 - Copper production per mine and quarter ending the second quarter of 2023
2Q23 copper production was 107 Mlbs and sold 101 Mlbs. The increase in copper sales volumes was driven by higher grades processed at Lumwana due to improved mining rates from the new fleet.
GOLD Copper Production per Mine History (Fun Trading)
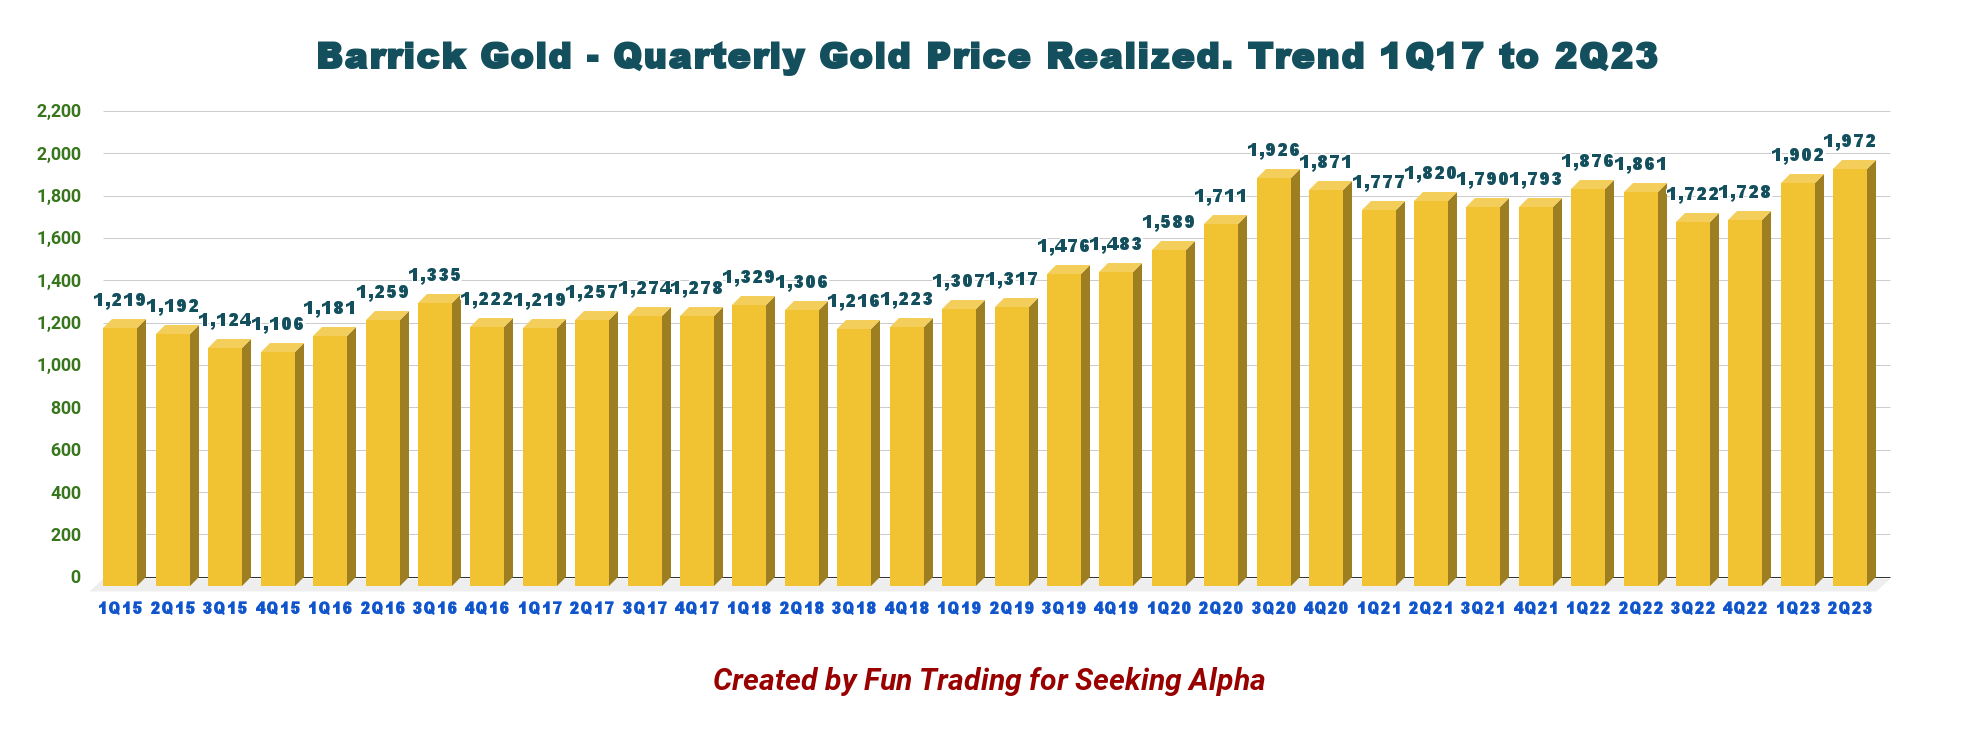
3 - Gold and copper prices realized
The average market price for gold in the second quarter was a solid $1,972 per ounce and $3.70 per pound for copper.
3.1 - Gold price history
GOLD Quarterly Gold Price History (Fun Trading)
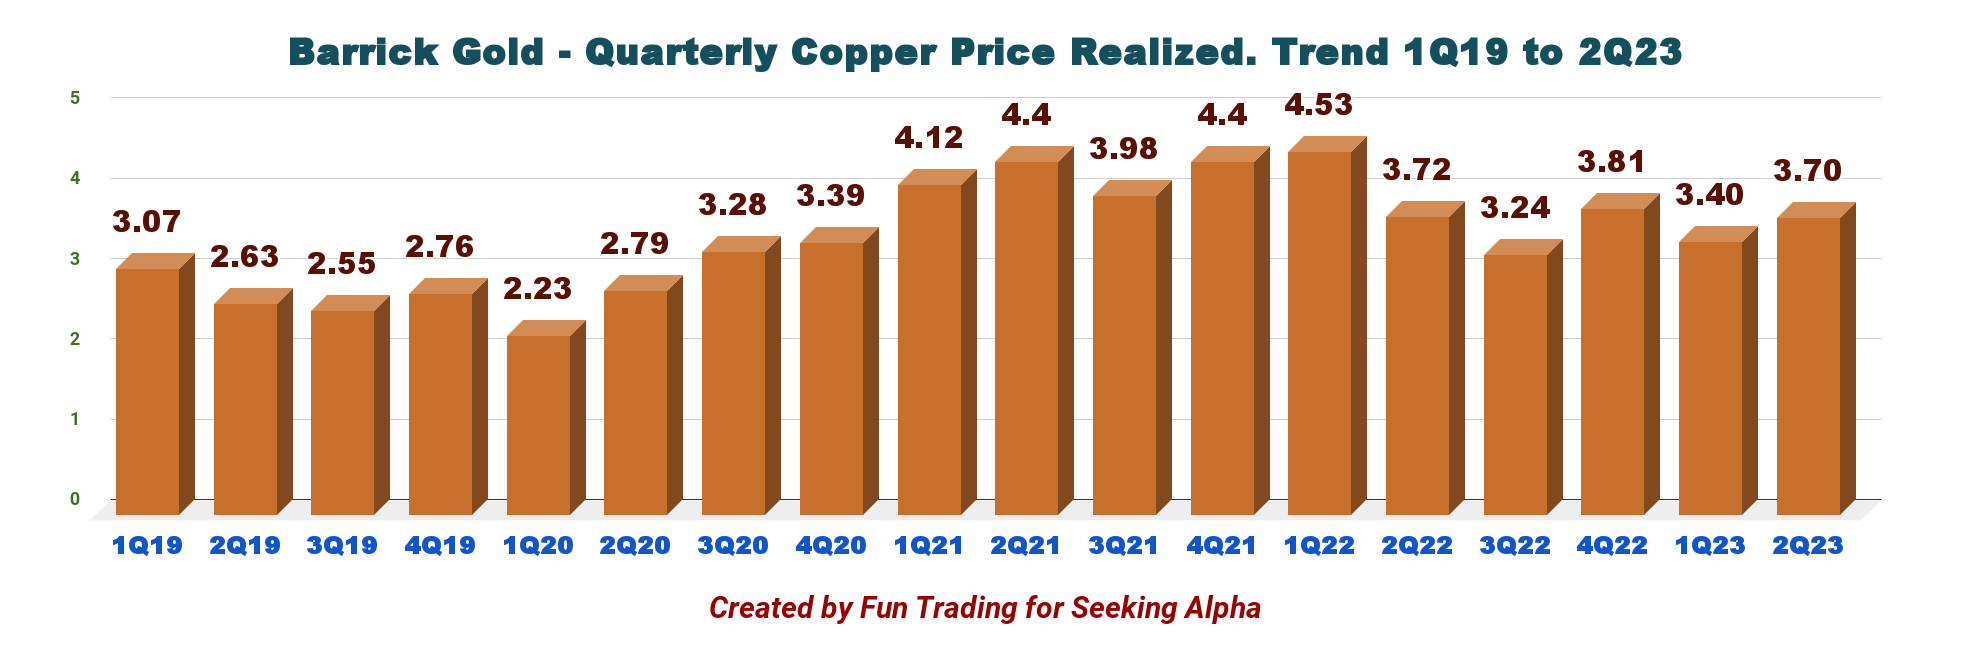
3.2 - Copper price realized
GOLD Quarterly Copper Price History (Fun Trading)
The copper price in the second quarter of 2023 was nearly the same YoY. The average market price for copper in 2Q23 was $3.70 per pound .
The copper price is directly correlated to China's economy. The copper price outlook is not bullish at the moment.
Upbeat sentiment on the post-pandemic reopening of China propelled gains early in the year, but investors later dumped industrial metals after tepid economic progress by the world's second-biggest economy.
I recommend reading my recent article about the Reko Diq project in Pakistan by clicking here .
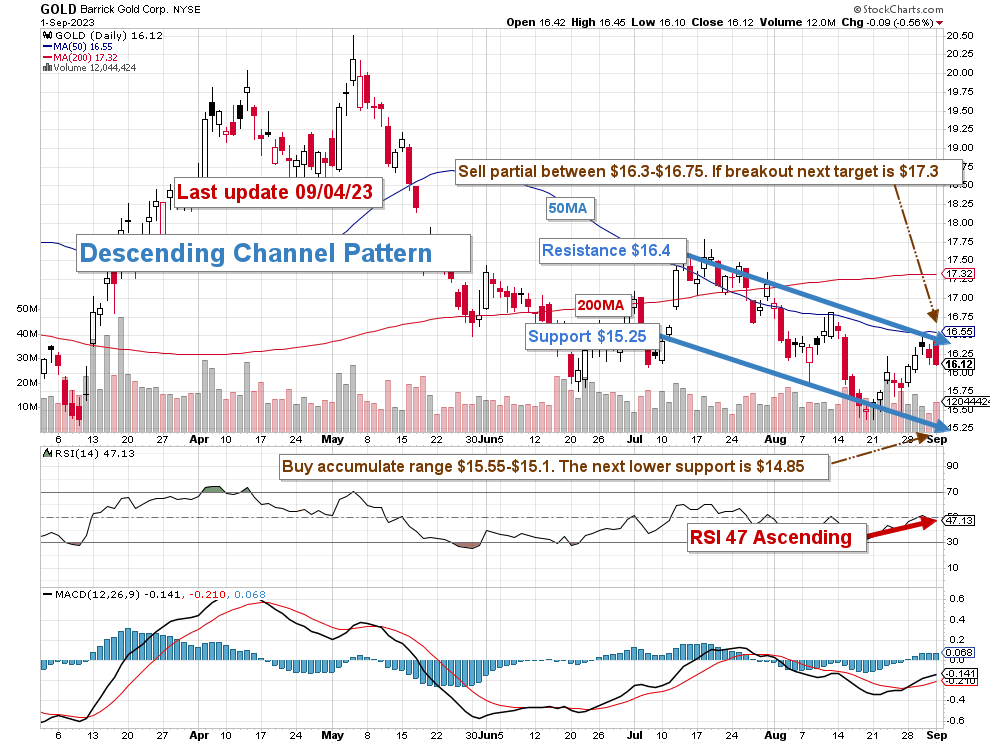
Part III - Technical Analysis and Commentary
GOLD TA Chart Short-Term (Fun Trading StockCharts)
Note: The chart is adjusted for the dividend.
GOLD forms a descending channel pattern, with resistance at $16.4 and support at $15.25 .
Descending channel patterns are short-term bearish in that a stock moves lower within a descending channel, but they often form within longer-term uptrends as continuation patterns. Higher prices usually follow the descending channel pattern but only after an upside penetration of the upper trend line.
The overall strategy is to keep a core long-term position and use about 40% to trade LIFO while waiting for a higher final price target for your core position between $23 and $25 and pocketing the dividend.
The trading strategy is to sell between $16.3 and $16.75 , possibly higher resistance at $17.3 . I suggest accumulating between $15.55 and $15.1 , with lower potential support at $14.85 .
Watch the gold price like a hawk.
Warning: The TA chart must be updated frequently to be relevant. It is what I am doing in my stock tracker. The chart above has a possible validity of about a week or two. Remember, the TA chart is a tool only to help you adopt the right strategy. It is not a way to foresee the future. No one and nothing can.
For further details see:
Barrick Gold: A Solid Gold Producer Trading At A Discount