ABX:CC - Barrick Gold: The Gold Sector Is Out Of Favor But It Is Momentary
Summary
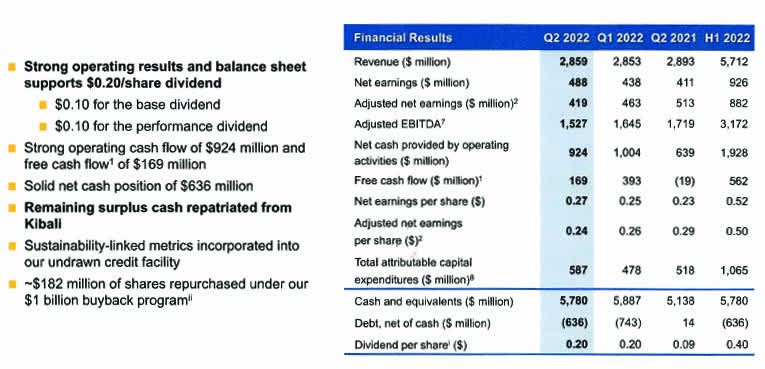
- Barrick reported its second quarter 2022 results on August 8, 2022. Barrick recorded total sales of $2,859 million, down 1.2% year-over-year.
- The company reported second quarter production for gold of 1,043K Au ounces (sold 1,040K Oz) and 120M Cu Lbs (sold 113M Cu Lbs).
- I suggest accumulating between $14.8 and $14.2, with lower potential support at $13.6.
Introduction
Toronto-based Barrick Gold ( GOLD ) released its second quarter 2022 results on August 8, 2022.
Note: This article is an update of my article published on August 1, 2022 . I have followed GOLD on Seeking Alpha since April 2015.
1 - 2Q22 results snapshot
GOLD 2Q22 Balance sheet (Barrick Gold Presentation)
Barrick reported net earnings of $488 million or $0.27 per diluted share in 2Q22, up from $411 million or $0.23 in the year-ago quarter, beating analysts' expectations.
Production for the second quarter was 1,043K oz (sold 1,040K oz) of gold and 120 Mlbs of Copper (sold 113 Moz). Copper production increased 25% year over year. However, the average realized copper price was down 19% YoY.
The average market price for gold in 2Q22 was $1,871 per ounce, while the average copper price was $3.72 per pound.
GOLD Quarterly gold production per mine 1Q22 versus 2Q22 (Fun Trading)
Barrick Gold indicated that it remains on track to deliver within the 2022 production guidance despite higher costs due to global energy prices and inflationary pressures across the global supply chain.
The Cost of sales increased around 10% year over year to $1,216 per ounce.
2 - Stock performance
Barrick Gold is one of the three gold miners that I consider as my core long-term "gold miners," together with Newmont ( NEM ) and Agnico Eagle ( AEM ).
We can see that Barrick is underperforming Newmont and Agnico Eagle. GOLD is down 30% in one year. The entire gold industry is selling off after the FED indicated that it would continue to hike interest rates until rampant inflation subsides significantly.
3 - Investment thesis
The investment thesis has not changed for many years and aligns with my previous statement about GOLD as one of my gold producers of choice. Thus, I recommend keeping a long-term GOLD core position.
However, the gold price is turning more volatile, and I expect this trend to continue throughout 2022.
Recently, Jay Powell said that successfully lowering inflation would probably result in lower economic growth for "a sustained period." The result is that gold is now weakening and closed at $1,696 per ounce yesterday, and the gold miners suffered a massive selloff the past few weeks.
Thus, using about 40% of your GOLD position to trade the stock LIFO short term is highly recommended.
CEO Mark Bristow said in the conference call :
Our exploration teams continue to replenish reserves, depleted by mining and in pursuit of our new Tier 1 discoveries and our growth opportunities. We've expanded our footprint across nearly all the world's major gold and copper regions. On every front, we're closing in on our goal of becoming the world's most valued mining company.
Barrick Gold - Balance Sheet 2Q'22 and Production Data: The Raw Numbers
| Barrick Gold |
| 2Q21 |
| 3Q21 |
| 4Q21 |
| 1Q22 |
| 2Q22 |
| Total Revenues in $ billion |
| 2.893 |
| 2.826 |
| 3.310 |
| 2.853 |
| 2.859 |
| Net Income in $ billion |
| 0.411 |
| 0.347 |
| 0.726 |
| 0.438 |
| 0.488 |
| EBITDA $ billion |
| 1.613 |
| 1.563 |
| 2.151 |
| 1.553 |
| 1.557 |
| EPS diluted in $/share |
| 0.23 |
| 0.20 |
| 0.41 |
| 0.25 |
| 0.27 |
| Cash from operations in $ million |
| 639 |
| 1,050 |
| 1,387 |
| 1.004 |
| 0.924 |
| Capital Expenditure in $ million |
| 658 |
| 569 |
| 669 |
| 611 |
| 755 |
| Free Cash Flow in $ million |
| -19 |
| 481 |
| 718 |
| 393 |
| 169 |
| Total cash $ billion |
| 5.14 |
| 5.04 |
| 5.28 |
| 5.89 |
| 5.78 |
| Long-term Debt in $ billion |
| 5.15 |
| 5.15 |
| 5.15 |
| 5.14 |
| 5.14 |
| Dividend per share in $ |
| 0.23 |
| 0.23 |
| 0.20 |
| 0.20 |
| 0.20 |
| Shares outstanding (diluted) in billion |
| 1.779 |
| 1.779 |
| 1.779 |
| 1.779 |
| 1.777 |
| Gold Production |
| 2Q21 |
| 3Q21 |
| 4Q21 |
| 1Q22 |
| 2Q22 |
| Gold Production K Oz |
| 1,041 |
| 1,092 |
| 1,203 |
| 990 |
| 1,043 |
| Copper Production Mlbs |
| 96 |
| 100 |
| 126 |
| 101 |
| 120 |
| AISC $/Oz by-product |
| 1,087 |
| 1,034 |
| 971 |
| 1,164 |
| 1,212 |
| Gold price realized $/Oz |
| 1,820 |
| 1,790 |
| 1,793 |
| 1,876 |
| 1,871 |
Data Source: Company press release
Part I - Barrick Gold - Balance Sheet Analysis
1 - Revenue details. GOLD earned $2.859 billion in 2Q'22
GOLD Quarterly revenues history (Fun Trading)
Barrick reported its second quarter 2022 results on August 8, 2022. Barrick recorded total sales of $2,859 million, down 1.2% year-over-year. The company's net earnings were $488 million, or $0.27 per diluted share in the second quarter of 2022, compared to $411 million, or $0.23 per share in the year-ago quarter. After adjusting for items not indicative of future operating earnings, adjusted net earnings were $419 million.
Net cash provided by operating activities increased 44.6% year-over-year to $924 million compared to $639 million a year ago, with a gold price reaching $1,871 per ounce this quarter. The Cost of sales was $1,850 million this quarter.
2 - Free cash flow was $169 million in 2Q'22
Gold Quarterly Free cash flow history (Fun Trading)
Note: The generic free cash flow is the cash from operations minus CapEx.
The free cash flow for the quarter was $169 million, and the trailing 12-month free cash flow is $1,761 million, which covers the dividend payout.
Barrick Gold declared a $0.20 per share quarterly dividend. It includes a $0.10 per share performance component in line with its new dividend policy.
GOLD Dividend policy Presentation (Barrick Gold)
The company repurchased $182 million in shares under the $1 billion share buyback program during the second quarter.
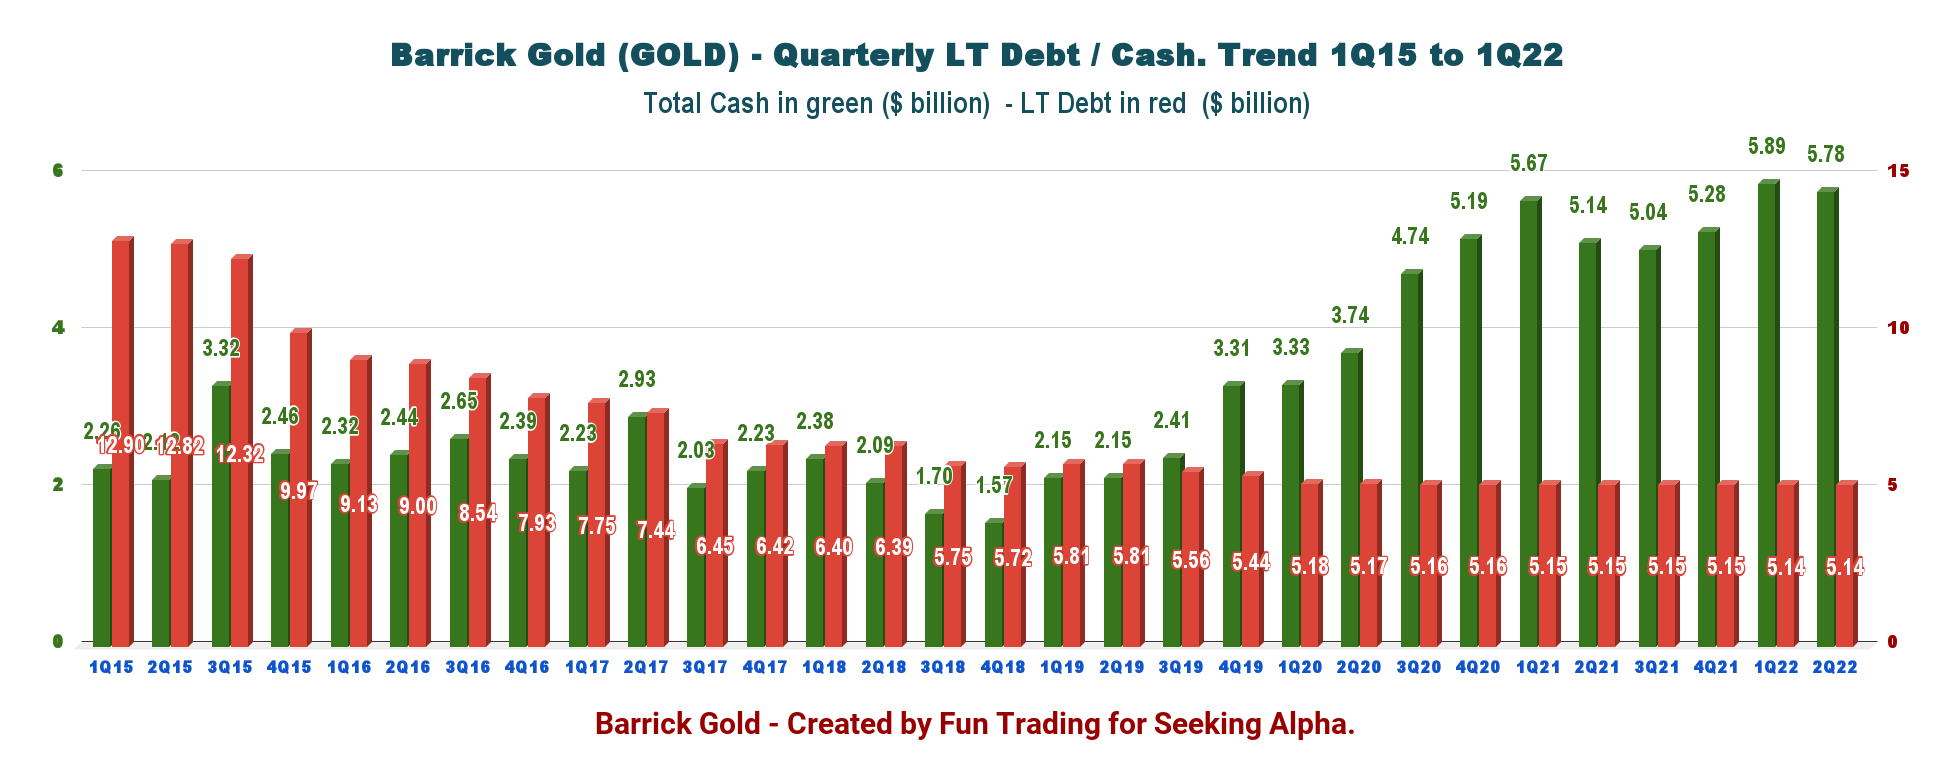
3 - No more n et debt and cash on hand of $5,780 million in 2Q'22
GOLD Quarterly Cash versus Debt history (Fun Trading)
Total debt was $5.144 billion at the end of the second quarter, and the total cash was $5,780 million. The company has an excellent debt position with net cash of $636 million.
Part II - 1Q'22 Gold Production and Commentary
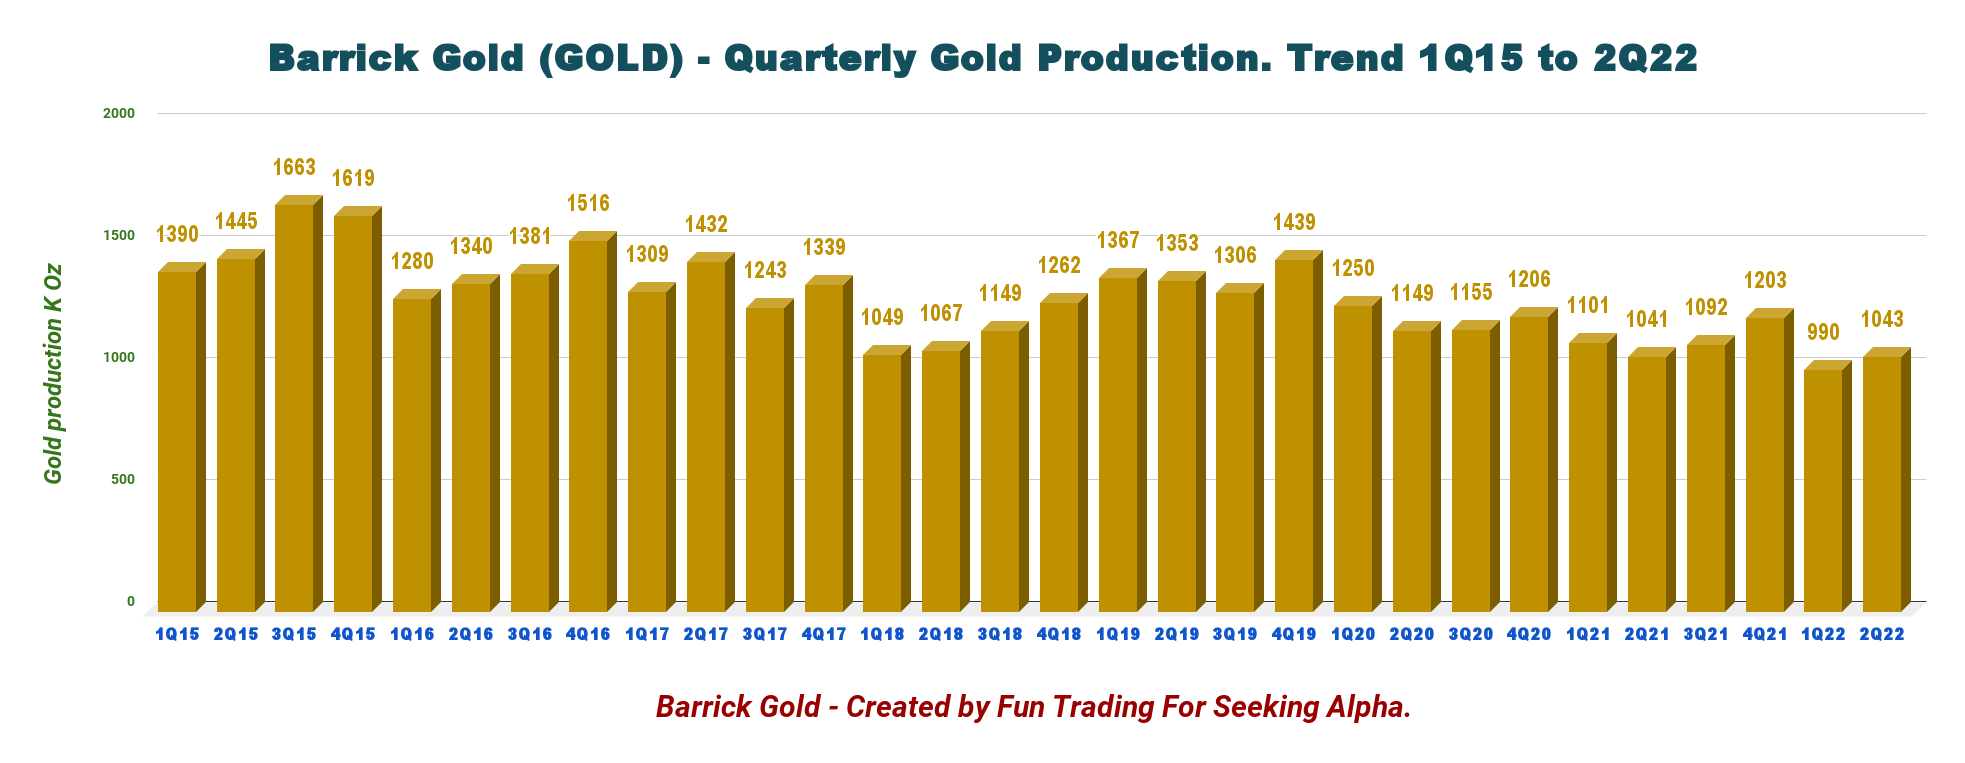
The company reported second-quarter production for gold of 1,043K Au ounces (sold 1,040K Oz) and 120M Cu Lbs (sold 113M Cu Lbs).
The average price for gold in the second quarter was $1,871 per ounce, while the average copper price was $3.72 per pound. AISC increased to $1,212 per ounce due to inflationary pressures despite higher production sold.
1 - Gold production details and historical charts
Note: This part is an update of my article published on August 1, 2022.
Production this quarter was not particularly stellar, but it was better sequentially, as shown below:
GOLD Quarterly Gold production history (Fun Trading)
Barrick's gold production in 2022 is expected to increase through the year, and with the 2Q22 performance, the company remains on track to achieve 2022 gold and copper guidance.
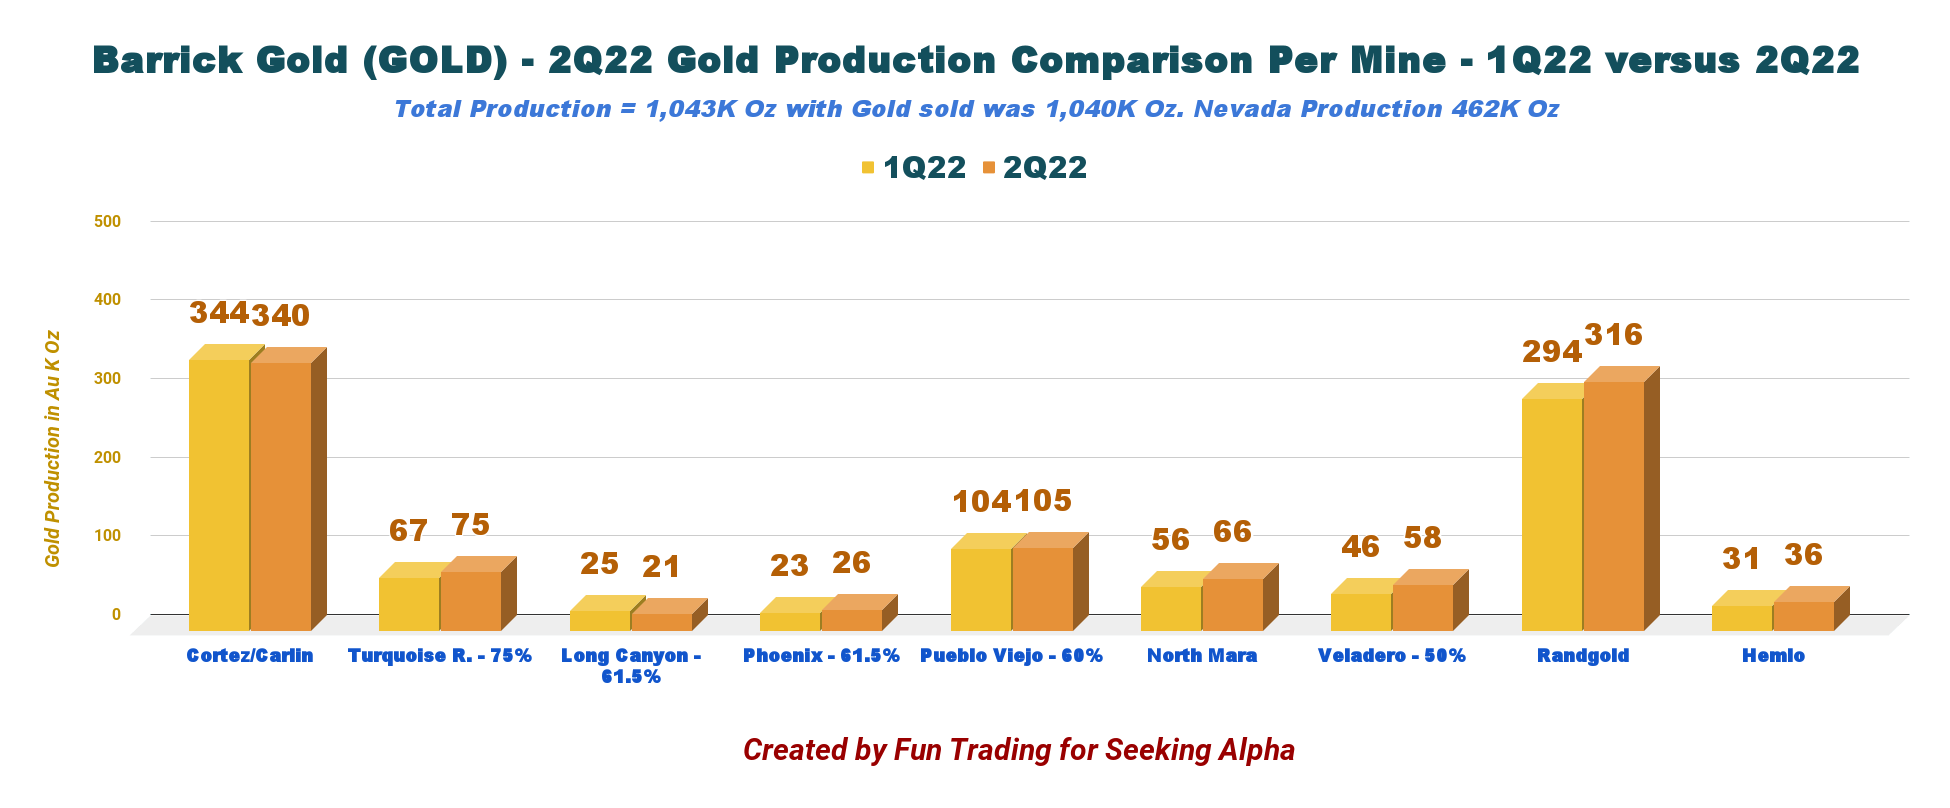
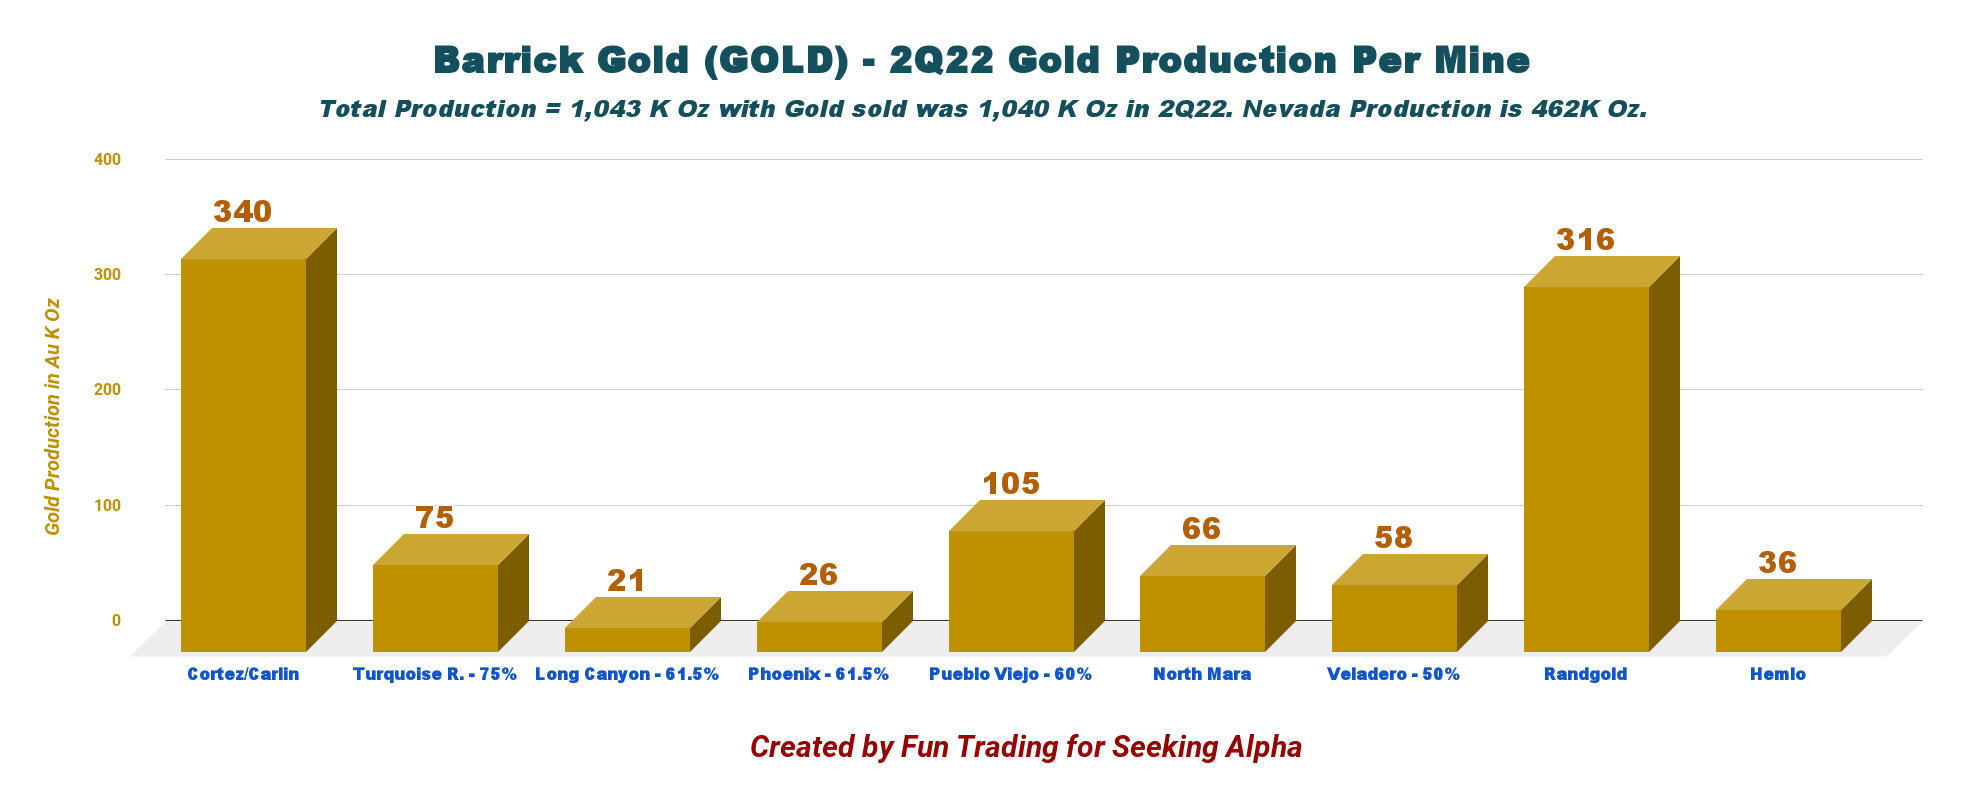
Below is shown production per mine.
Note: JV Nevada represents five gold mines: Cortez, Carlin, Turquoise, Long Canyon, and Phoenix.
GOLD Quarterly production per mine 2Q22 (Fun Trading)
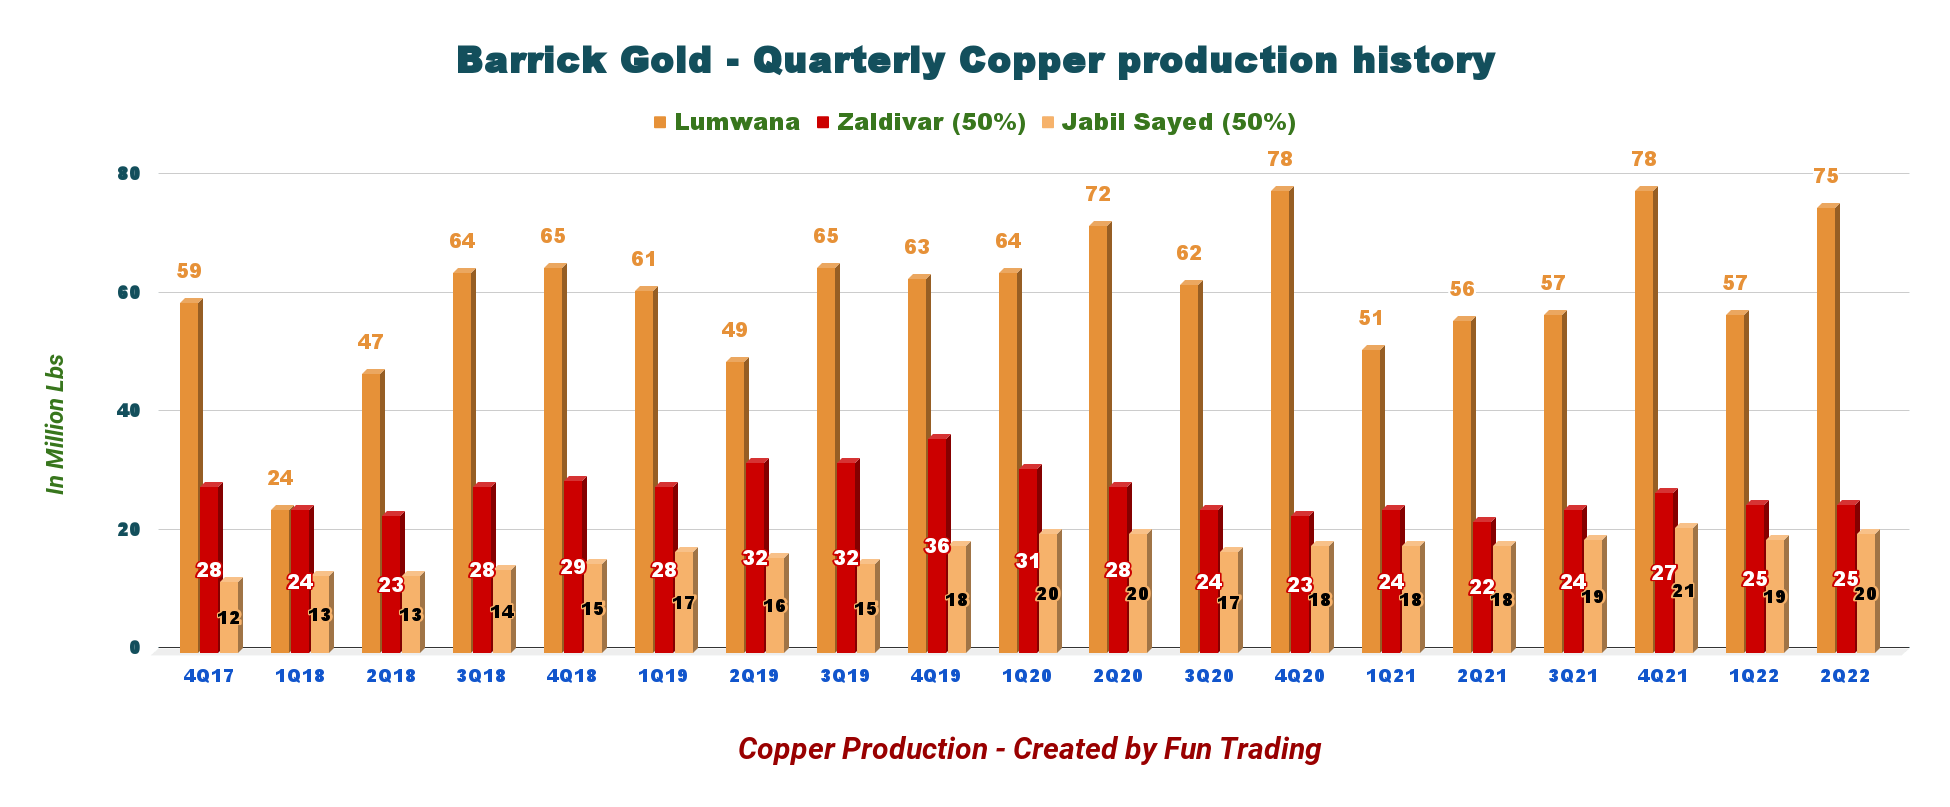
2 - Copper production per mine and quarter ending the second quarter of 2022
GOLD Quarterly Copper production per mine history (Fun Trading)
2Q22 copper production was 18.8% higher than in 1Q22 with 120 Mlbs and sold 113 Mlbs. In 2Q22, Barrick produced 120 Mlbs and sold 113 Mlbs. It was a good production quarter, but the copper price dropped significantly.
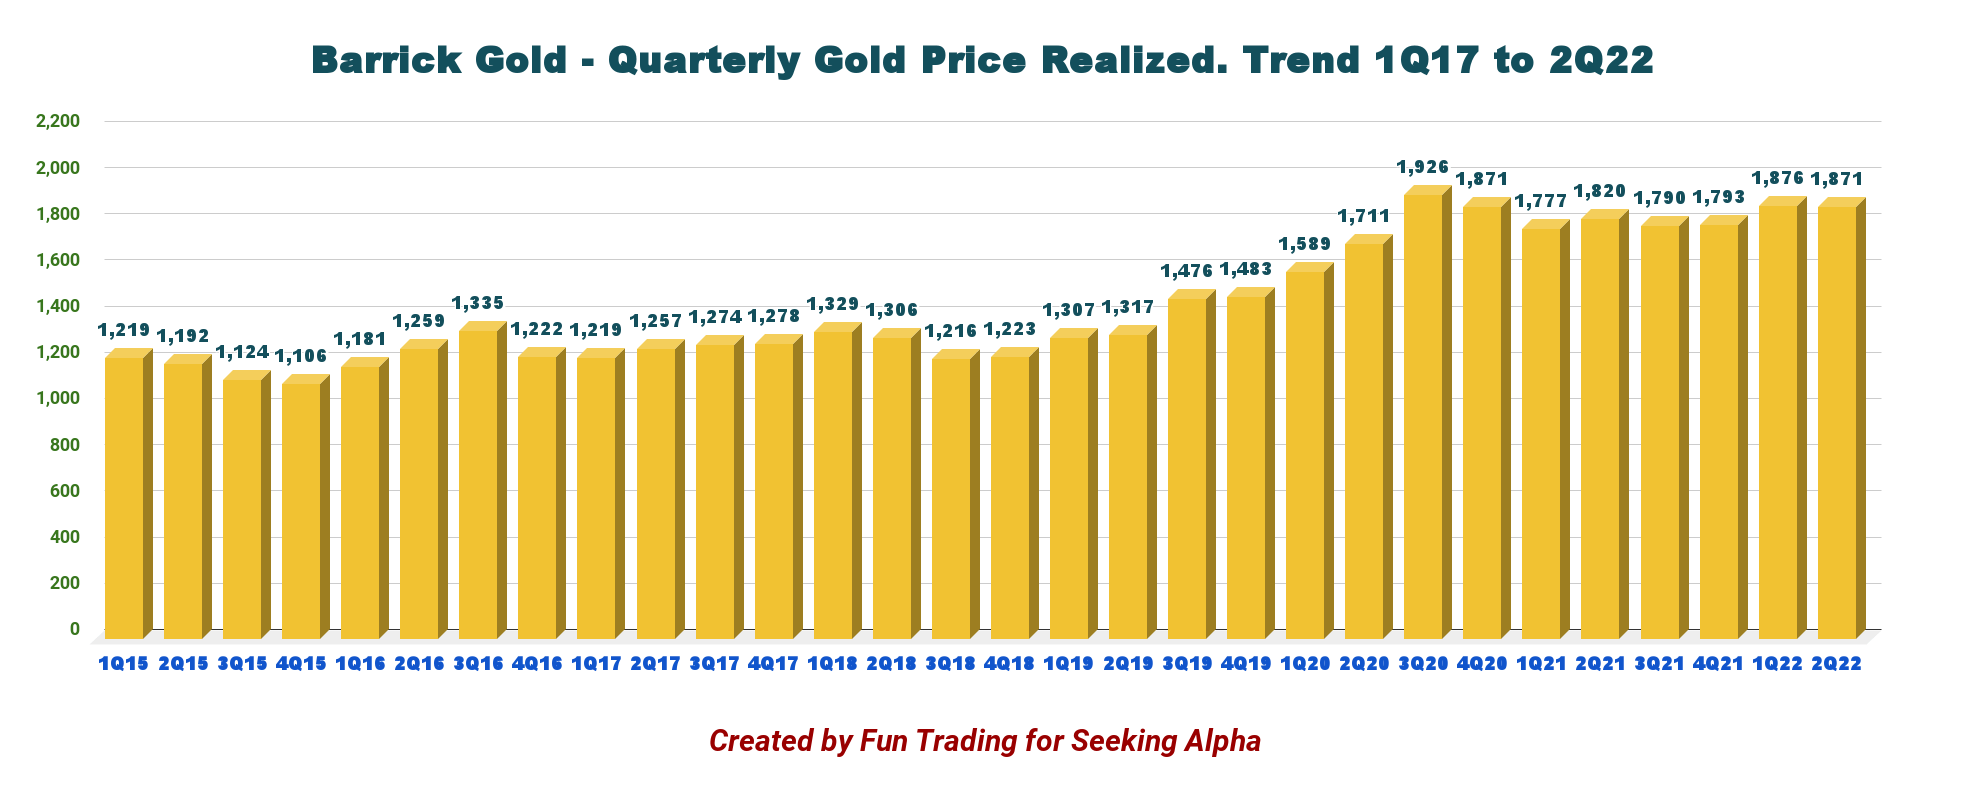
3 - Gold and copper prices realized
The average market price for gold in the second quarter was a solid $1,871 per ounce and $3.72 per pound for copper.
3.1 - Gold price history
GOLD Quarterly gold price history (Fun Trading)
The gold price realized was $1,871 per ounce in 2Q22, nearly unchanged sequentially. However, the gold price weakened significantly with the market starting in April when the FED decided to turn hawkish and is now below $1,700 per ounce.
3.2 - Copper price realized will be lower this quarter
GOLD Quarterly Copper price history (Fun Trading)
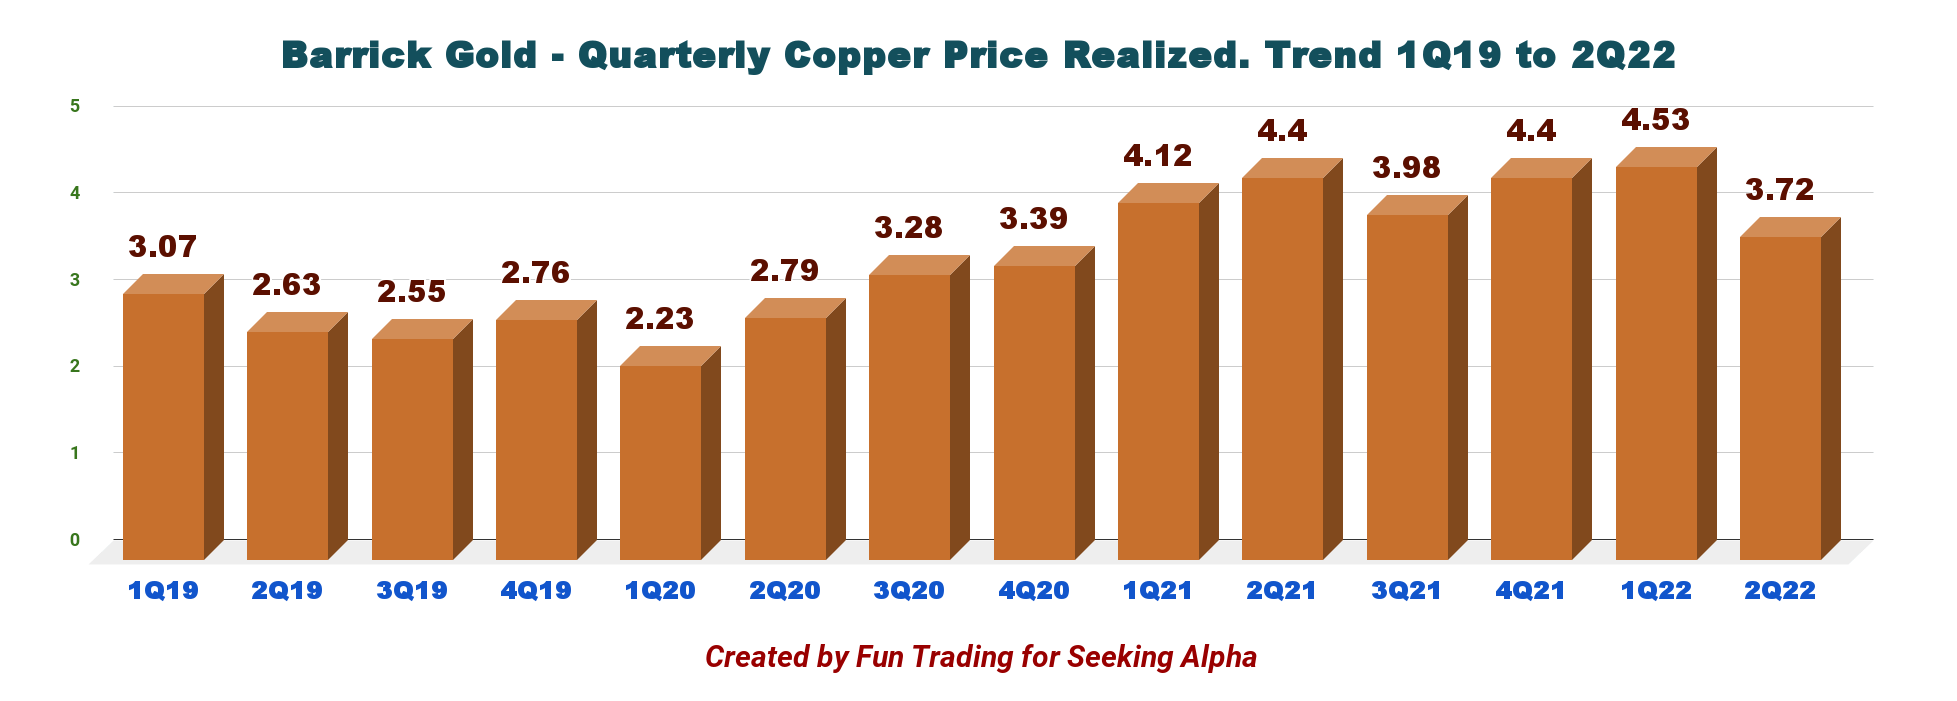
Unfortunately, the copper price received by Barrick fell this quarter. The copper price in the second quarter of 2022 was 4.9% lower sequentially. The average market price for copper in 2Q22 was $3.72 per pound.
If we look at the one-year chart for copper, we can see how quickly and sharply the price of copper had dropped since April, when the FED indicated that it would hike interest aggressively to fight rampant inflation.
Since then, the FED has hiked two times 75-point and is about to hike 50-point or 75-point again in September, and copper prices have fallen dramatically.
Part III - Technical Analysis and Commentary
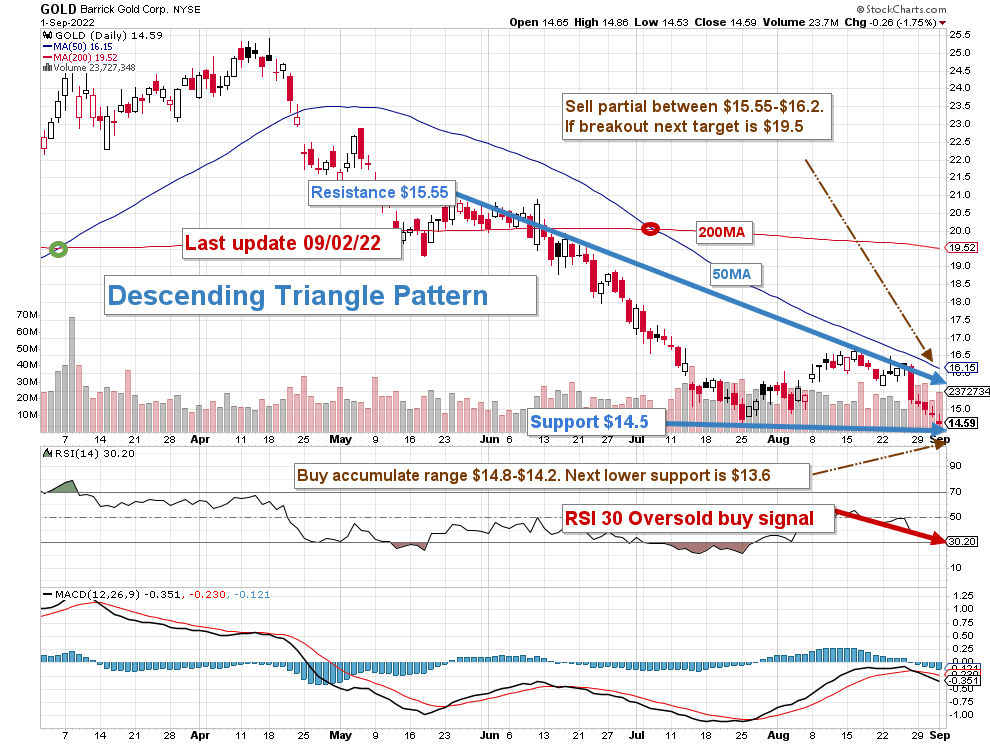
GOLD TA Chart short-term (Fun Trading StockCharts)
Note: The chart is adjusted for the dividend.
GOLD forms a descending triangle pattern with resistance at $15.55 and support at $14.5. A descending triangle pattern is often considered a bearish continuation pattern. However, a descending triangle pattern can also be bullish under a reversal pattern. RSI (14) is oversold at 30, indicating that we may be about to reverse.
The overall strategy that I promote in my marketplace, "The Gold And Oil Corner," is to keep a core long-term position and use about 40% to trade LIFO (see note below) while waiting for a higher final price target for your core position between $24 and $25 and pocketing the dividend in the meantime.
The trading strategy is to sell 20% above $15.55 and another 15% gradually until $17 and $19.5.
I suggest accumulating between $14.8 and $14.2, with lower potential support at $13.6.
Watch gold price like a hawk.
Note: The LIFO method is prohibited under International Financial Reporting Standards (IFRS), though it is permitted in the United States by Generally Accepted Accounting Principles (GAAP). Therefore, only US traders can apply this method. Those who cannot trade LIFO can use an alternative by setting two different accounts for the same stock, one for the long term and one for short-term trading.
Warning: The TA chart must be updated frequently to be relevant. It is what I am doing in my stock tracker. The chart above has a possible validity of about a week. Remember, the TA chart is a tool only to help you adopt the right strategy. It is not a way to foresee the future. No one and nothing can.
Author's note: If you find value in this article and would like to encourage such continued efforts, please click the "Like" button below as a vote of support. Thanks.
For further details see:
Barrick Gold: The Gold Sector Is Out Of Favor, But It Is Momentary