CEFD - BDCX And CEFD: Structurally Disadvantaged Products Avoid
2023-03-28 08:29:51 ET
Summary
- BDCX and CEFD are ETNs offered by UBS that provide exposure to BDCs and CEFs respectively.
- They both offer high distribution yields, with trailing 12 month yields of 17.4% and 16.4% respectively.
- Despite the high yields, I think investors should avoid these ETNs. They charge outrageous fees (~4% total expense) and have leverage reset features that disadvantage long-term investors.
- Compared to similar unlevered products, BDCX and CEFD provide more than 150% downside capture with less than 150% upside returns.
A few months ago, I wrote a cautious review of the ETRACS Monthly Pay 2x Leveraged US Small Cap High Dividend ETN ( SMHB ). Due to the asset class the ETN was betting on and the 'loss rebalancing' structure of the ETN, investors were almost guaranteed to underperform over the long run. Since my article, the SMHB ETN has lost 38%, justifying my warning (Figure 1).
Figure 1 - SMHB has declined dramatically since my cautious article (Seeking Alpha)
Was SMHB a special case, or does other high yielding ETNs from UBS like the ETRACS Quarterly Pay 1.5X Leveraged MVIS BDC Index ETN ( BDCX ) and the ETRACS Monthly Pay 1.5X Leveraged Closed-End Fund Index ETN ( CEFD ) suffer from similar issues?
Despite paying 17.4% and 16.4% distribution yields, I think investors should avoid both BDCX and CEFD. In my opinion, these UBS ETNs are structurally set up to underperform. First, both products currently charge ~4% total expense ratios. More importantly, both have leverage reset features that disadvantage long-term investors.
Comparing BDCX and CEFD against unlevered ETFs that focus on Business Development Corps ("BDCs") and Closed-End Funds ("CEFs") respectively, we find that the UBS ETNs have more than 150% downside capture with less than 150% upside returns versus their respective asset classes.
Fund Overviews
The ETRACS Quarterly Pay 1.5X Leveraged MVIS BDC Index ETN ("BDCX") provides 1.5x levered exposure to the MVIS US Business Development Companies Index ("BDC Index") while the ETRACS Monthly Pay 1.5X Leveraged Closed-End Fund Index ETN ("CEFD") is levered to the S-Network Composite Closed-End Fund Index ("CEF Index").
Index Construction
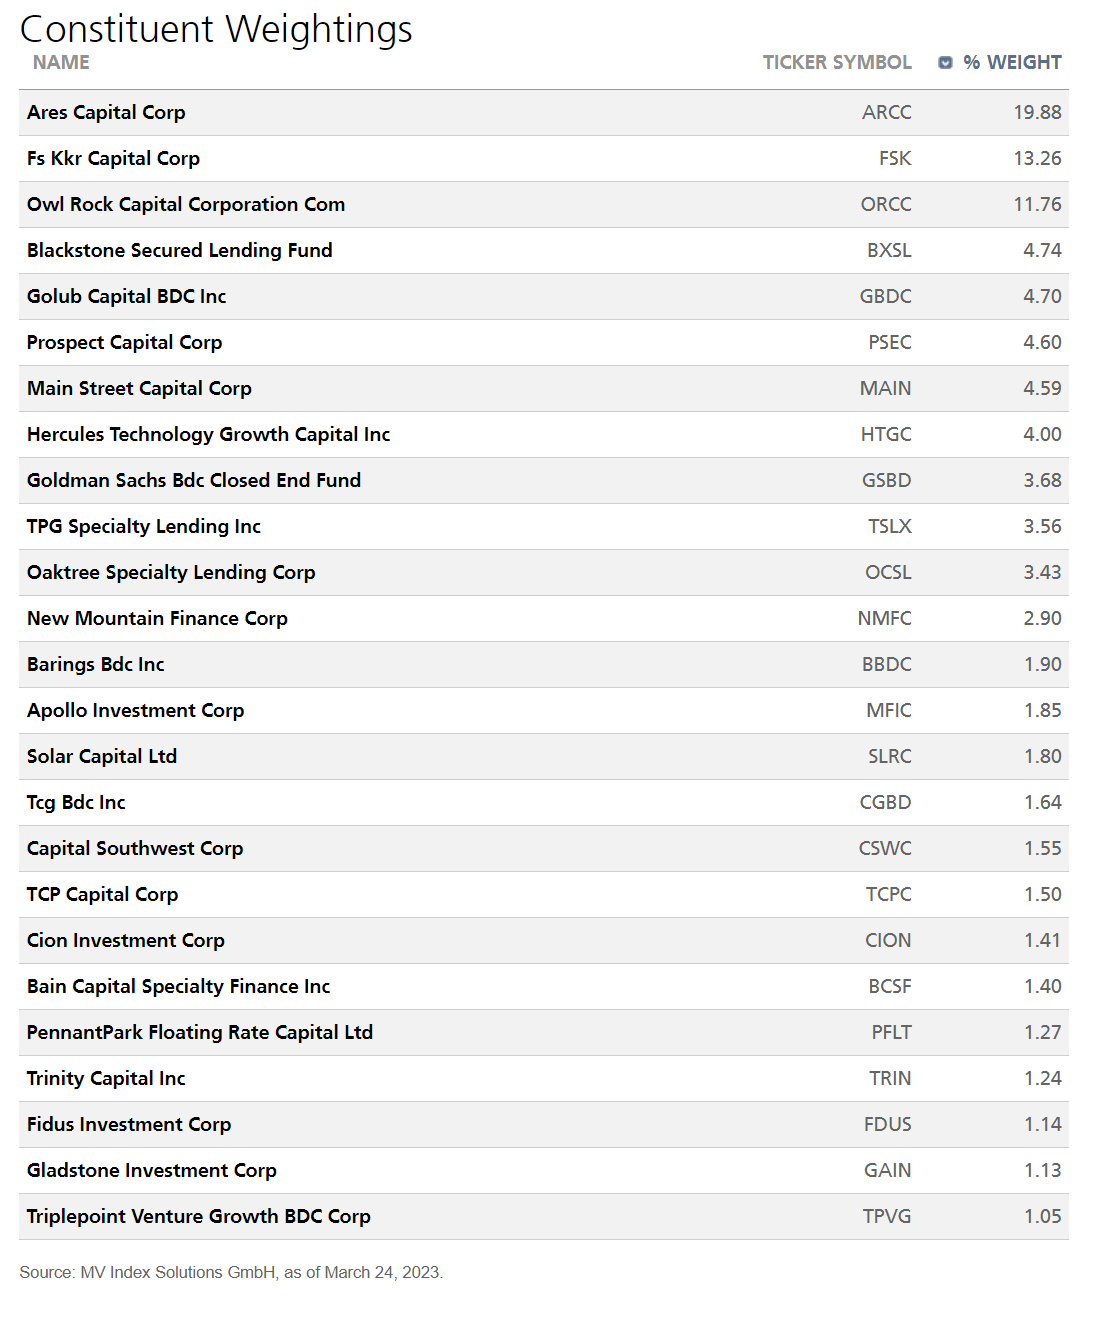
The BDC Index measures the performance of the largest and most liquid business development companies that are incorporated in the U.S with more than $150 million in market capitalization and daily trading value greater than $1 million. Securities in the BDC Index are weighted by free-float market capitalization with the largest 5 to 10 companies (having individual weight > 4.5% and collectively called the 'Large-Weights') aggregated and capped at 50%. Individual weights in the 'Large-Weights' group are capped at 20% with 5% minimums. All other eligible securities are grouped into a 'Small-Weights' group where individual security weight is capped at 4.5%.
As of March 24th, 2023, the BDC Index has 25 constituents with individual security weights shown in Figure 2.
Figure 2 - BDCX index constituents (etracs.ubs.com)
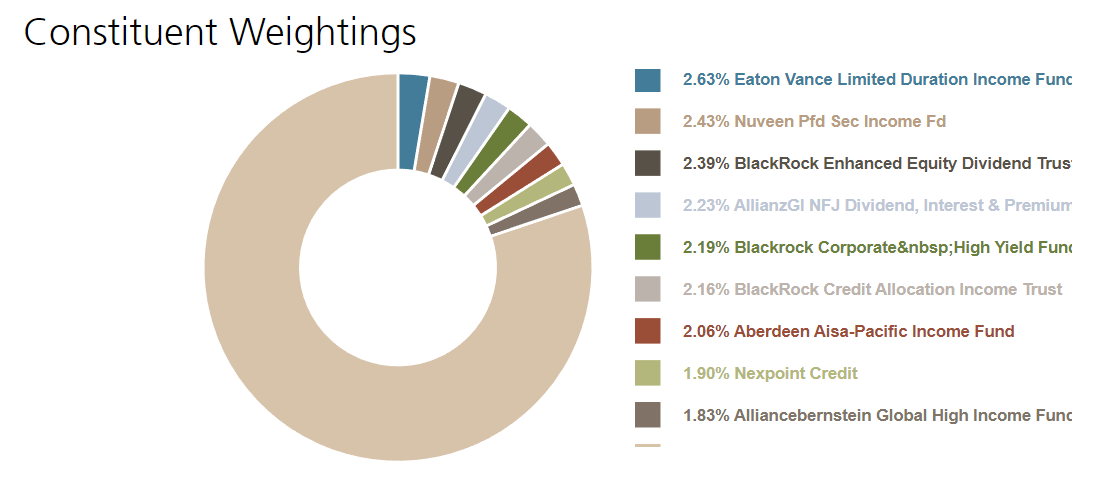
On the other hand, the CEF Index measures the performance of an index of closed-end funds. The CEF Index is split into 3 sectors: Investment Grade Fixed Income, High Yield Fixed Income, and Option Income. To qualify for the index, CEFs must have a minimum of $100 million in market cap and trade at less than 20% premium to NAV. CEFs also must have total expense ratio less than (US Federal Funds Effective Rate + 100 bps) × 0.5 + 150 bps and have $500,000 in daily trading liquidity.
Index weights for the CEF Index are based on adjusted net assets, which takes the reported net assets and grosses up those funds trading at a discount (i.e. net assets are multiplied by a factor of 1.3 for CEFs trading at a greater than 6% discount) and grossed down for those trading at a premium (i.e. net assets are multiplied by a factor of 0.7 for CEFs trading at a premium greater than 6%). Individual security weight is capped at 8% with excess weights redistributed to other constituents. Securities with weights greater than 5% are also collectively capped at 45%.
The resultant CEF Index has 118 constituents as of March 24, 2023 with the top 10 weights adding up to 21.6% of the Index (Figure 3).
Figure 3 - CEF index constituents (etracs.ubs.com)
ETN vs. ETFs
As noted in my prior article, exchange traded notes ("ETNs") are unsecured debt securities issued by an investment bank (in this case, UBS) that tracks an underlying index and trade on an exchange like a stock. At maturity, the ETN will pay the return of the index, less any fees.
A key distinction between ETNs and exchange traded funds ("ETFs") is that an ETF actually owns a portfolio of securities so an ETF investor has claims to the fund's portfolio. On the other hand, an ETN simply provides investors with returns of the underlying index, similar to a contact for difference , and does not confer ownership of the reference index.
As a result, investors in ETNs are exposed to the risk that the issuer defaults and does not honour the contractual total return payout. While this risk is usually very small, it is not zero. Investors should be mindful of the issuer risk, especially with the recent difficulties in the banking sector (UBS forced deal to acquired Credit Suisse).
Returns
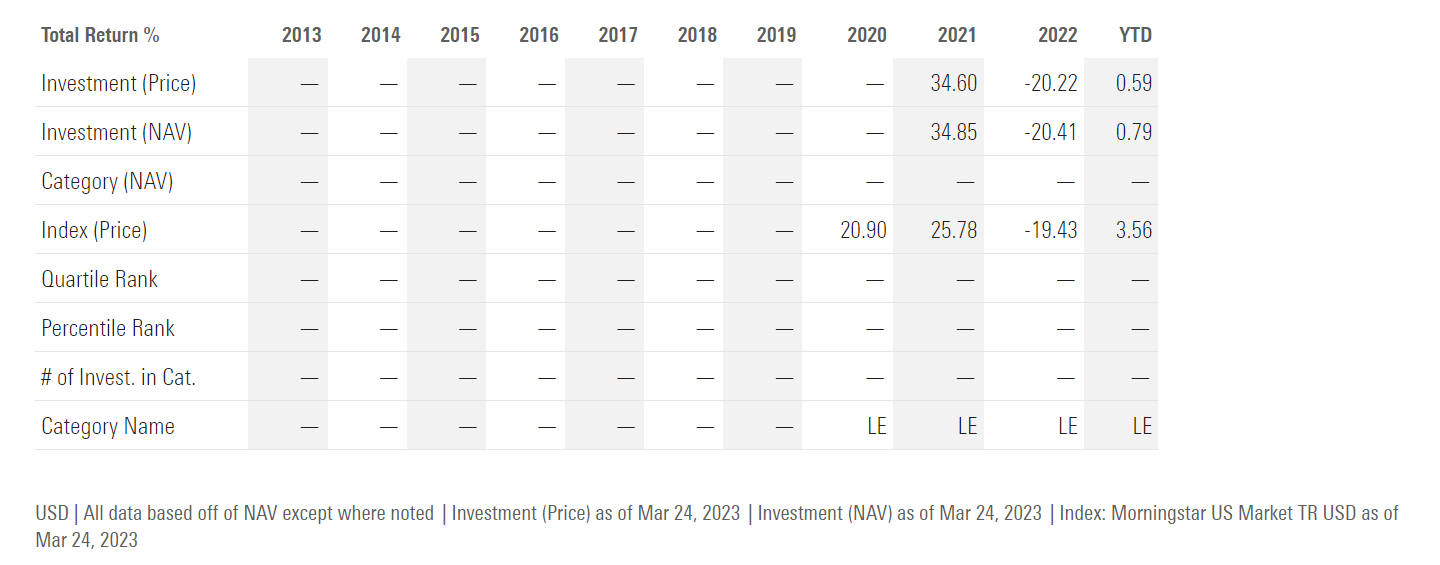
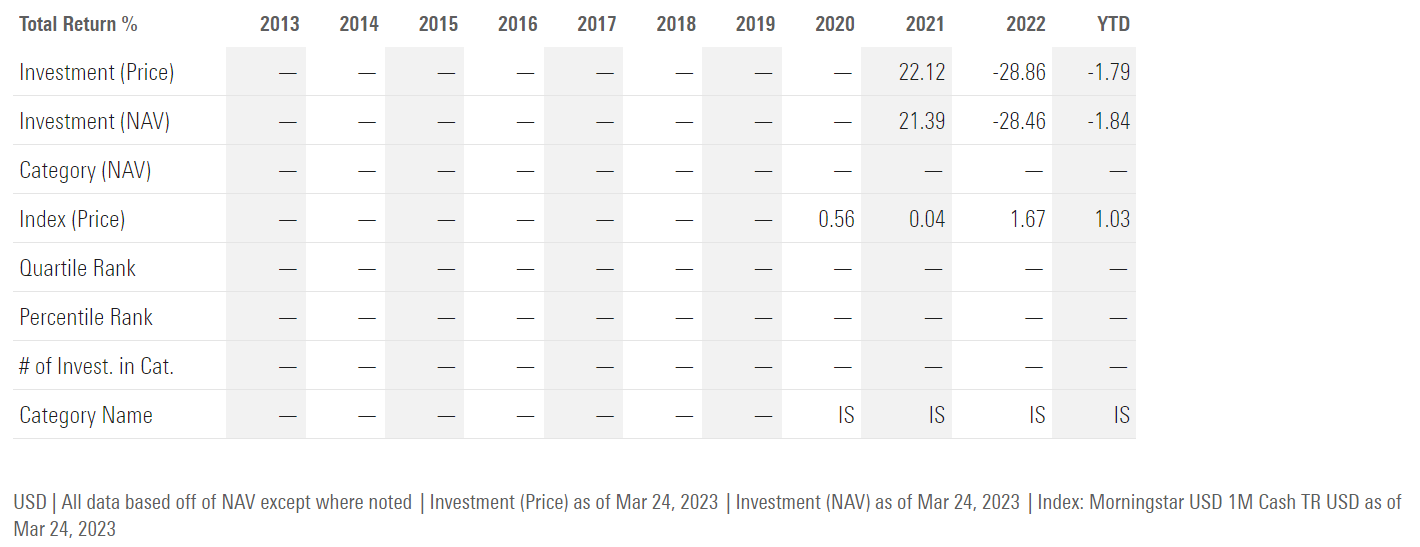
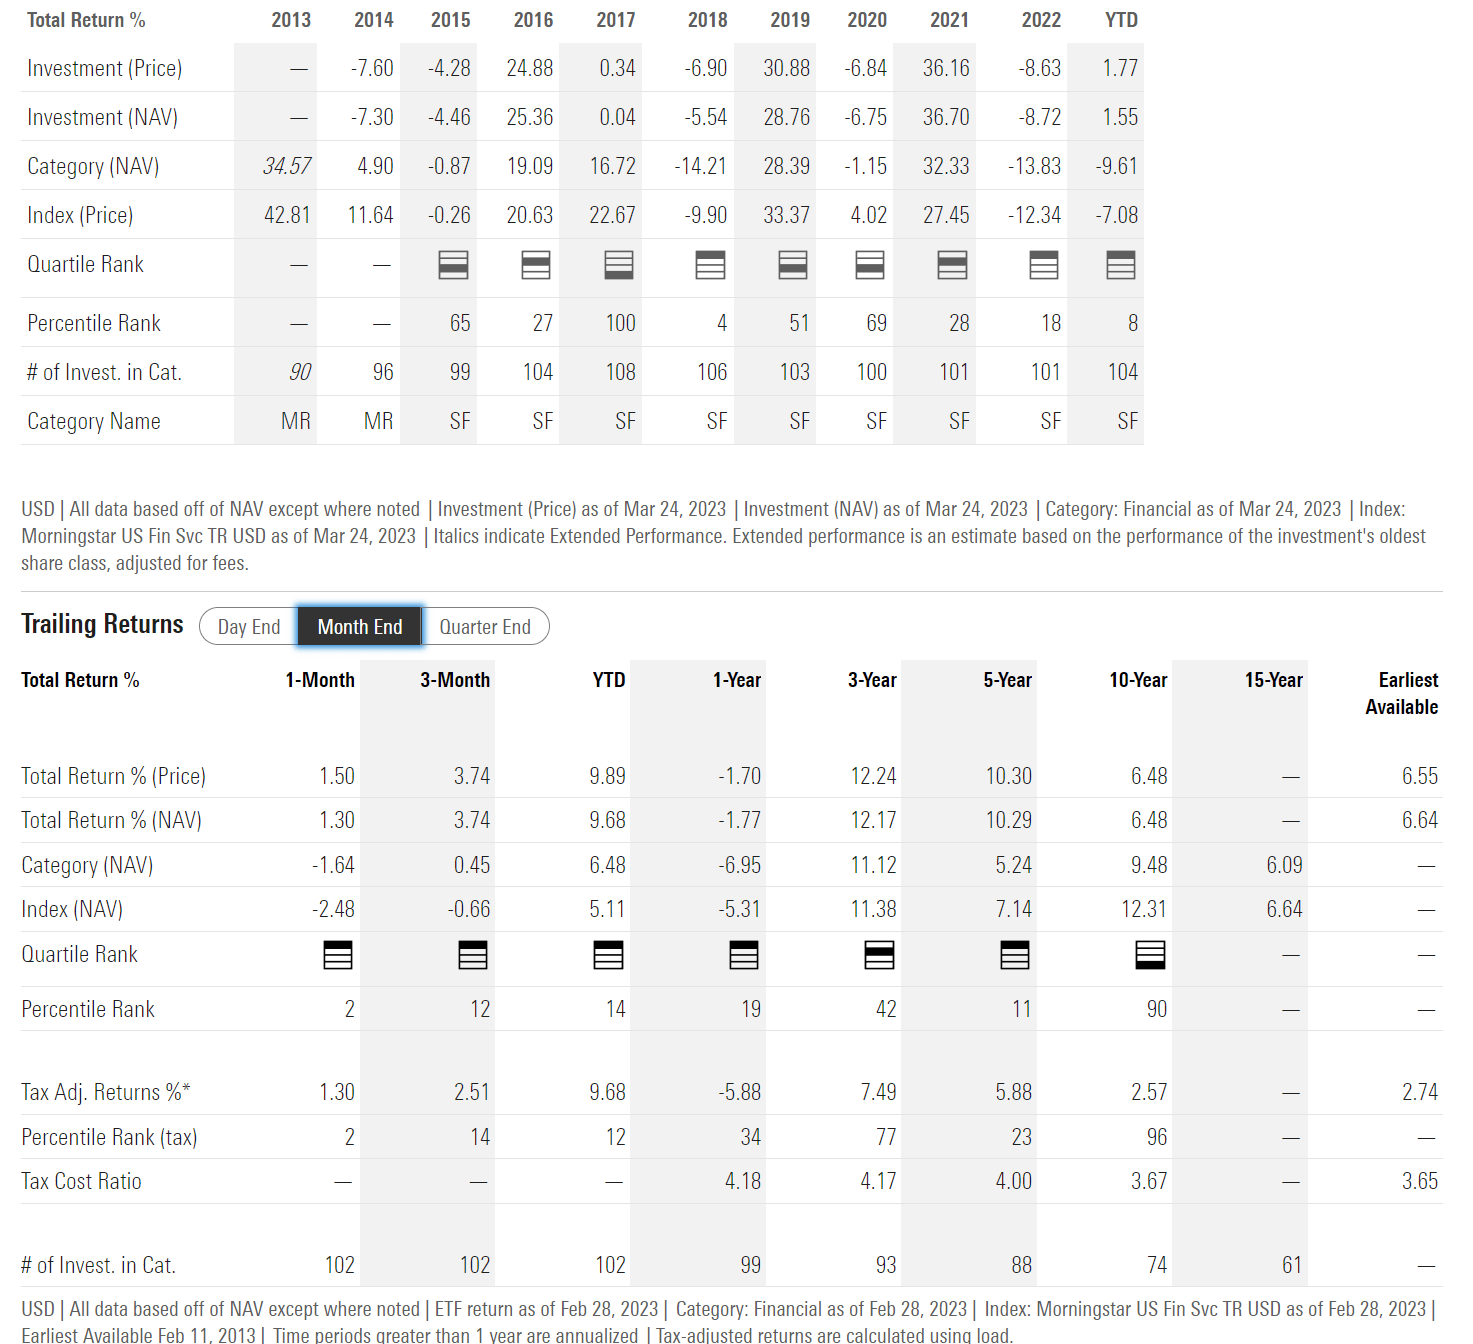
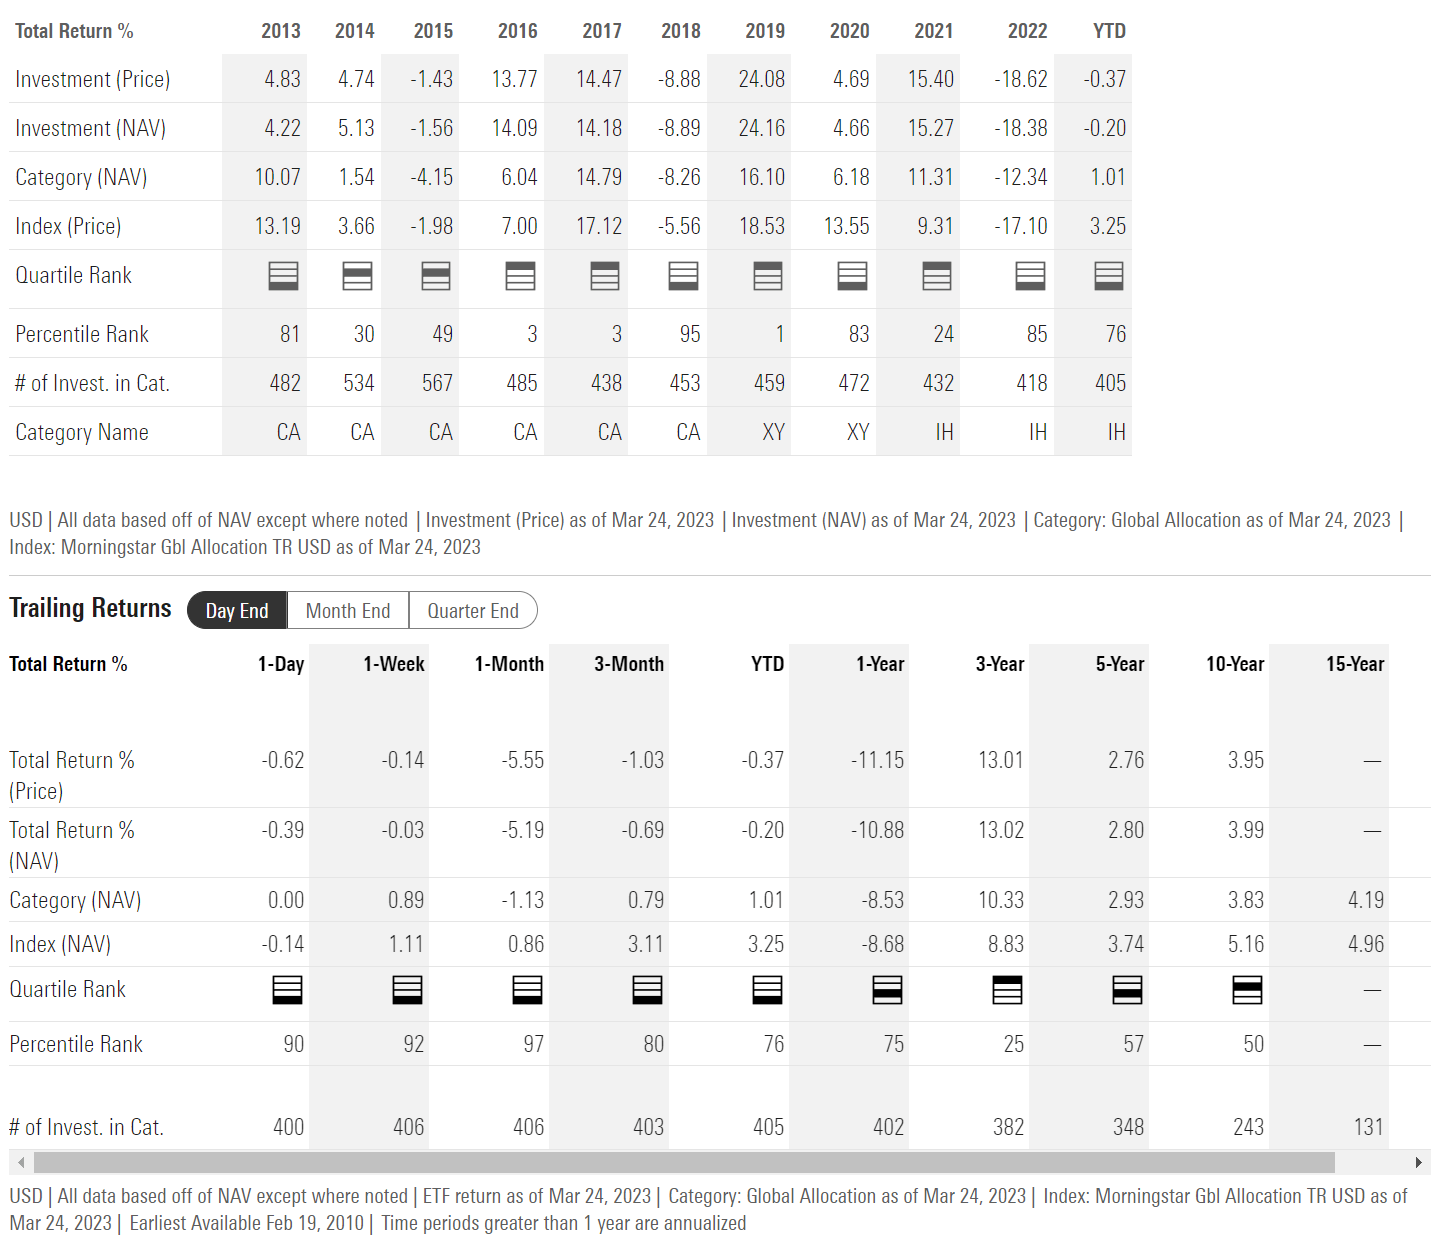
Figure 4 shows the historical returns of BDCX while figure 5 shows the historical returns of CEFD. Both ETNs were launched in 2020 and so does not have long operating histories.
Figure 4 - BDCX historical returns (morningstar.com)
Figure 5 - CEFD historical returns (morningstar.com)
Note, both BDCX and CEFD had poor performances in 2022 and have been roughly flat so far in 2023. However, YTD returns are a little misleading as both funds had strong starts to 2023, only to see most of their YTD gains evaporate in a matter of days as credit conditions tightened following the recent regional and international banking crisis (Figure 6).
Figure 6 - BDCX and CEFD have seen strong YTD gains evaporate in recent weeks (Seeking Alpha)
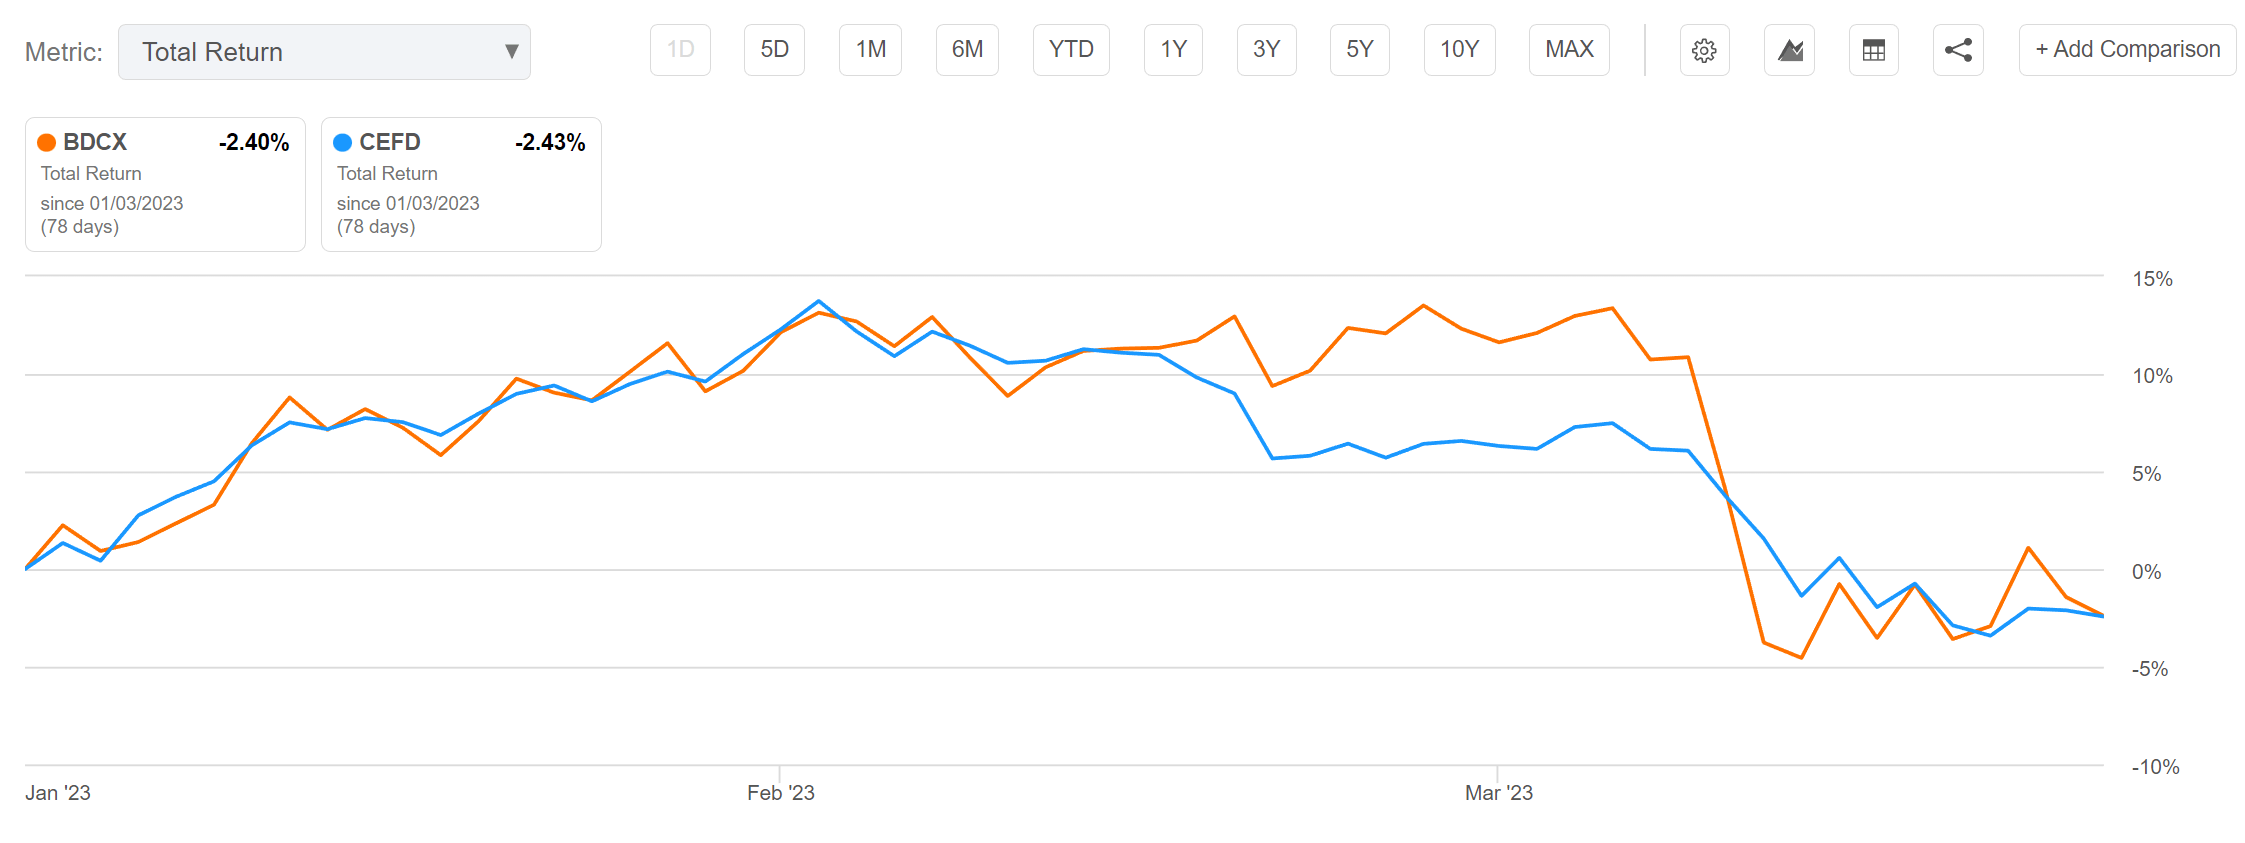
As I have written in prior articles on the VanEck BDC Income ETF (NYSEARCA: BIZD ) and the Invesco CEF Income Composite Portfolio ETF ( PCEF ), both BDCs and fixed income CEFs are highly sensitive to credit conditions. So it is no wonder that both BDCX and CEFD have suffered steep losses in recent days due to credit contagion from the bank failures.
Distributions & Yield
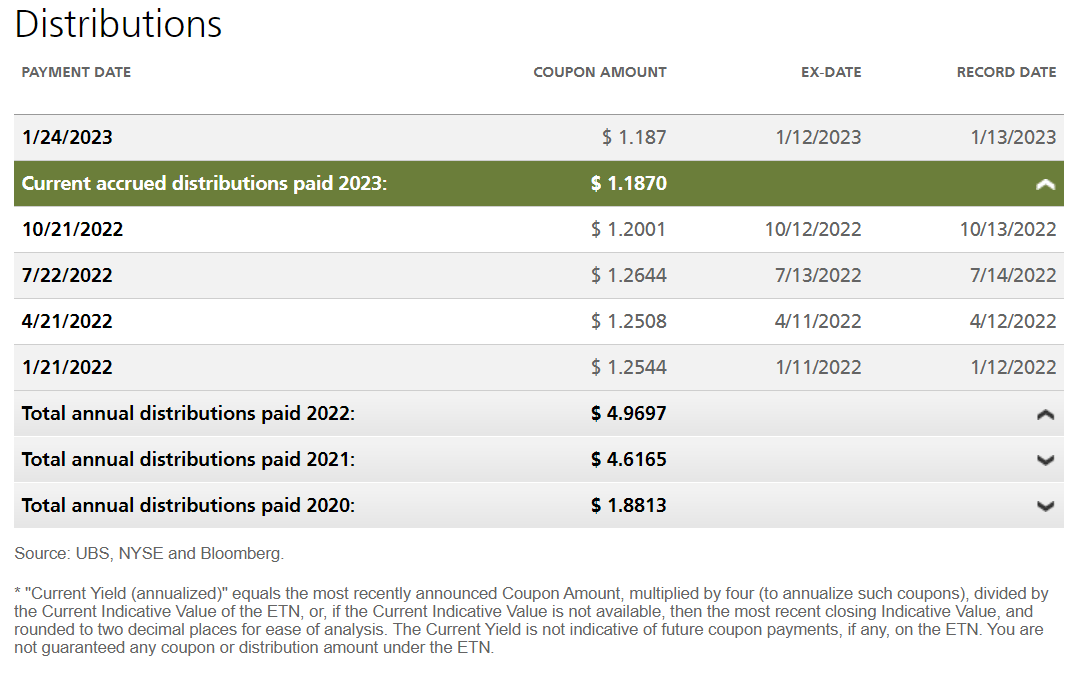
The main attraction of the two ETNs are their distribution yields. BDCX has paid a trailing 12 month distribution of $4.902 or 17.4% trailing yield (Figure 7).
Figure 7 - BDCX pays a quarterly distribution yielding 17.4% (etracs.ubs.com)
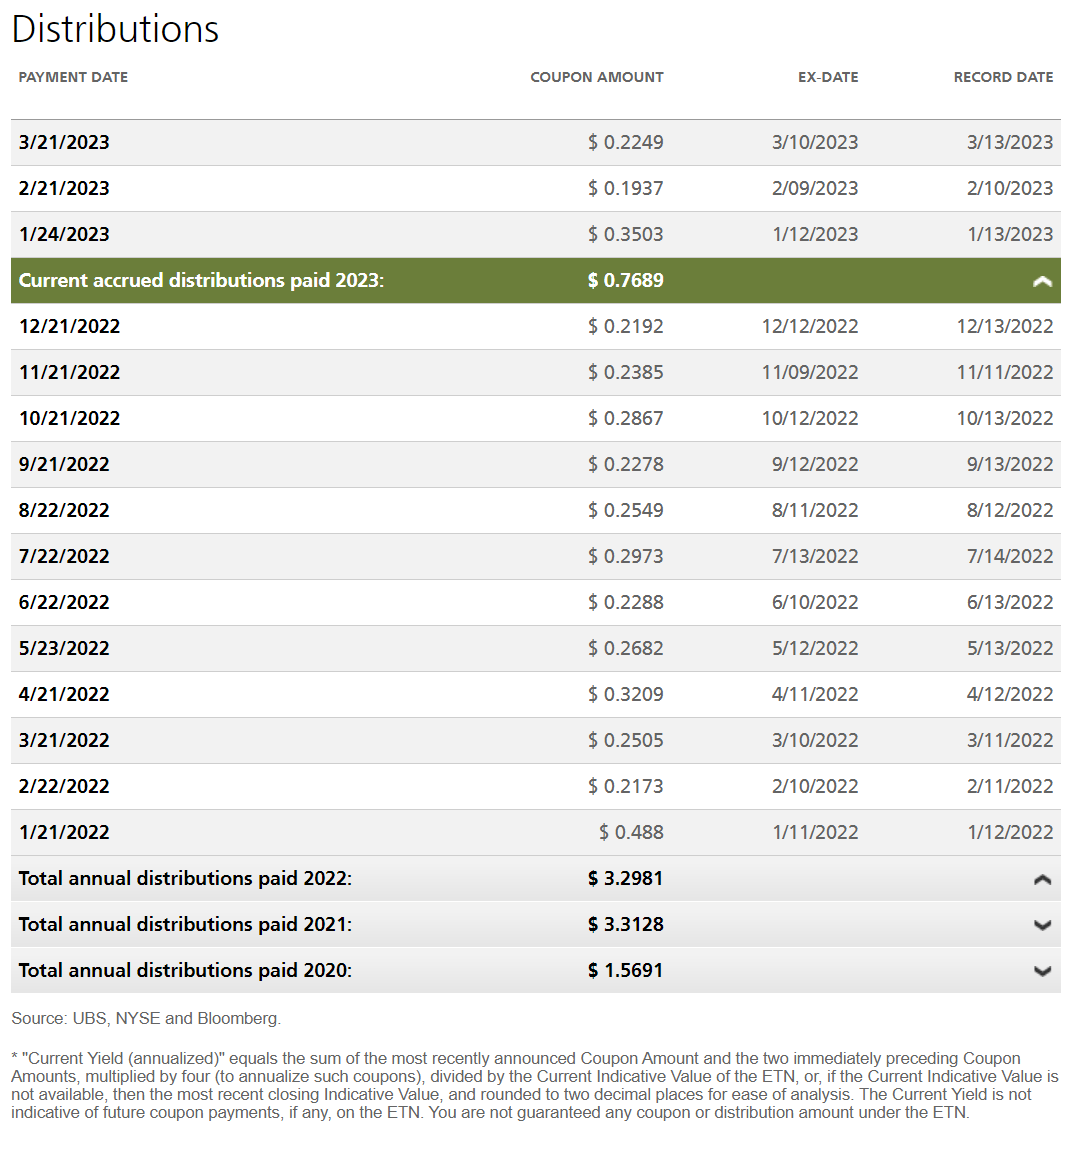
CEFD has paid a trailing 12 month distribution of $3.1112 or 16.4% trailing yield (Figure 8).
Figure 8 - CEFD pays a monthly distribution yielding 16.4% (etracs.ubs.com)
Fees
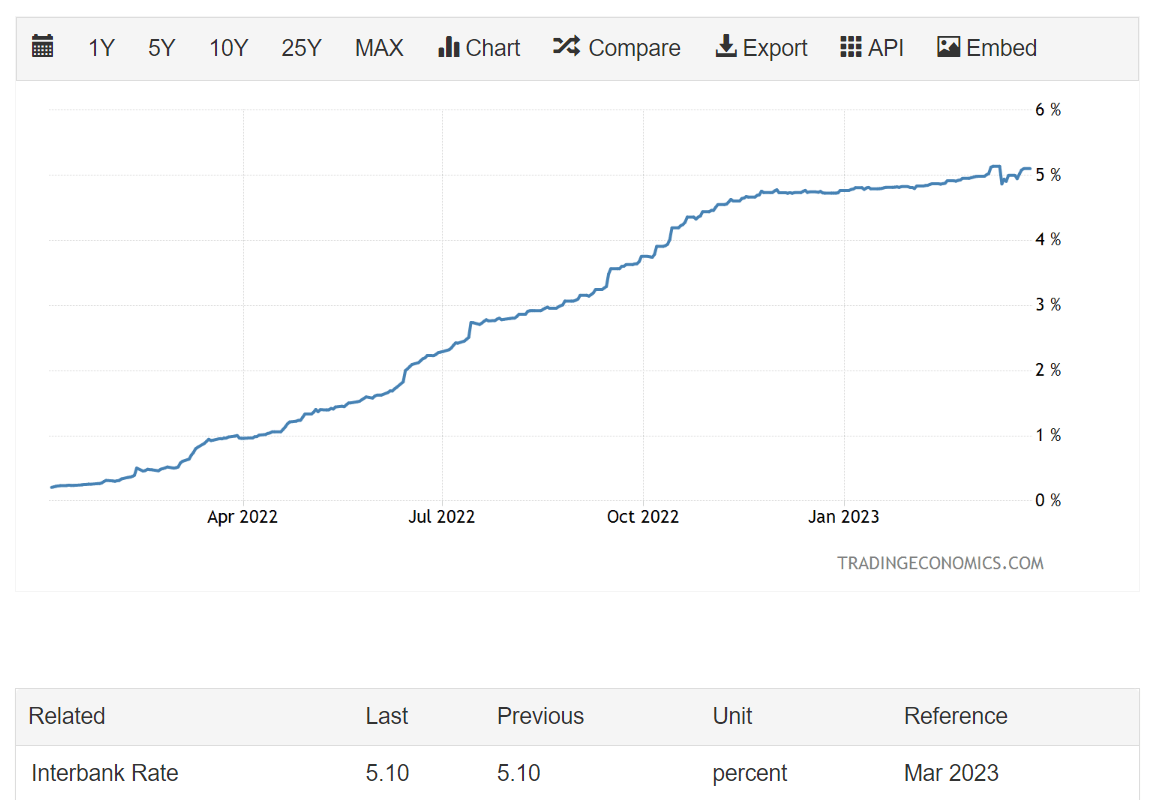
Both BDCX and CEFD charge a 'tracking fee rate' of 0.95%, accrued daily, plus a financing charge for leverage at 3M LIBOR + 0.95%. With 3M LIBOR currently sitting at 5.1%, the embedded financing charge is over 3% (50% leverage) for these ETNs (Figure 9).
Figure 9 - 3Month LIBOR (tradingeconomics.com)
Fees Upon Fees...
The main issue I have with these two UBS ETNs, BDCX and CEFD, is the structure of the product. Specifically, I am concerned that the odds are stacked against investors outperforming.
First, looking at the fees of the UBS ETN structure, we see that currently, both ETNs are paying ~4% in annualized fees (0.95% tracking fee plus ~3% in finance fees). This is very expensive compared to other high yielding investments.
Furthermore, the underlying investments, BDCs and CEFs, also have very high embedded fees that will affect the total returns of the respective ETN indices.
Beware Loss Rebalancing Events
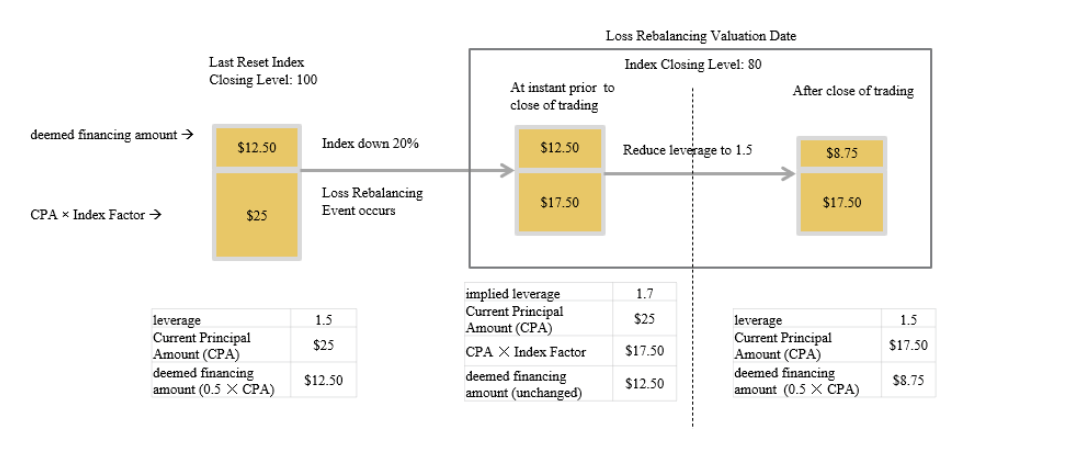
The other main issue with these ETNs is the 'Loss Rebalancing Event'. For both BDCX and CEFD, a 'Loss Rebalancing Event' refers to if, at any time, either the BDC Index or the CEF Index decreases by 15% or more in value from the most recent Last Reset Index Closing Level (typically the monthly reset level).
When a 'Loss Rebalancing Event' occurs, the ETN will reset the then-current leverage to 1.5x. Afterwards, a constant percentage increase in the index will have less of a positive impact than before the event (Figure 10).
Figure 10 - Illustrative example of a loss rebalancing event (etracs.ubs.com)
Numerically, assume the ETN begins the month at $25 and the underlying index is at 100. Let say after 10 business days, the underlying index has lost 20%. This means the ETN is now trading at $17.50 (the ETN had gross assets of $37.50 due to 50% leverage, and a 20% decline in gross assets is $7.50 in loss against $25 in equity). A 'loss rebalancing event' has occurred and from then on, the ETN's leverage is reset to 50% or $8.75 in financed assets.
Even if the index rallies back to 100 (a 25% gain), the ETN will only rally to $24.0625 (gross assets of $26.25 rally 25% to $32.8125, less $8.75 in leverage) and not $25.
Over the long run, there will inevitably be bad months where the ETN index falls more than 15% over a short period of time, so investors in both BDCX and CEFD will be crystallizing losses at the worst possible times while unlevered 'buy and hold' investors will not have this issue.
More Scenarios Where Investors Permanently Lose
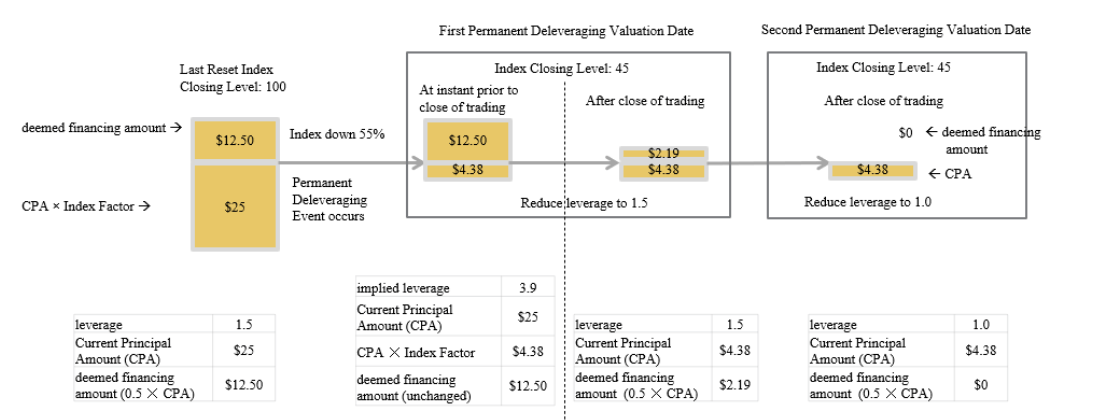
In addition to 'Loss Rebalancing Events', BDCX and CEFD have additional reset scenarios in their prospectuses (the SMHB ETN does not have these 'features') that are set up to protect the issuer at the expense of investors. First, there is a scenario called 'Permanent Deleveraging Event' where the intraday index loses 50% or more in a single day. In this scenario, leverage in the structure is set to 1x (Figure 11).
Figure 11 - Illustrative Permanent Deleveraging Event (etracs.ubs.com)
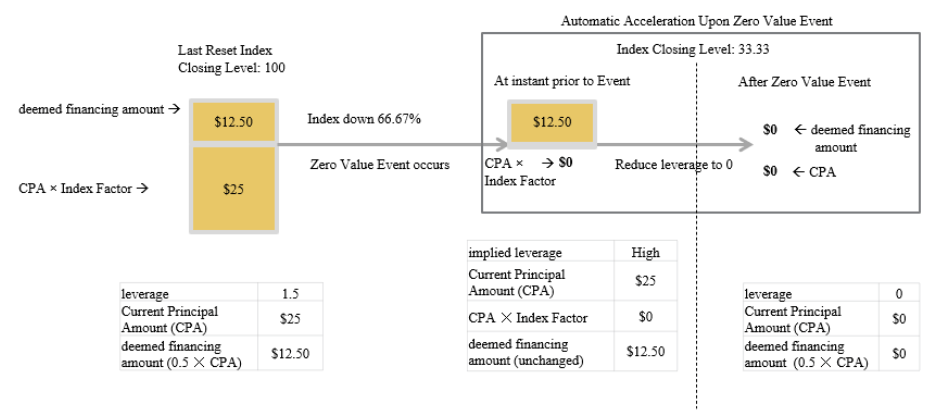
Another scenario that investors should watch out for is the 'Automatic Acceleration Upon Zero Event' where if the intraday loss exceeds 66.67%, the ETN investor is wiped out completely (Figure 12).
Figure 12 - Illustrative Automatic Accelerating Upon Zero Event (etracs.ubs.com)
While both scenarios should be exceedingly rare, they do represent ways in which investors in these UBS ETNs are disadvantaged vs. unlevered investors.
Investors Better Off With Unlevered Funds
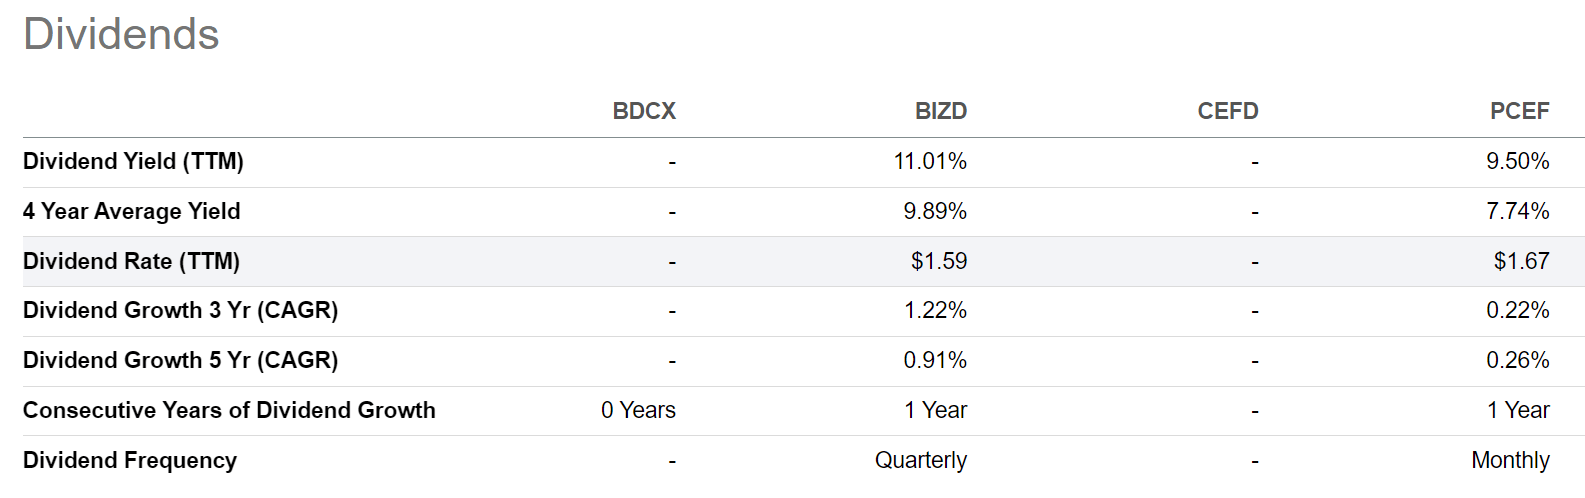
If investors are interested in the high yields from BDCs and CEFs, they may be better off investing in unlevered products like the BIZD and PCEF ETFs that I mentioned above. The BIZD ETF pays a trailing 11.0% distribution yield while the PCEF pays a trailing 9.5% distribution yield (Figure 13).
Figure 13 - BIZD and PCEF pay high distribution yields (Seeking Alpha)
Figure 14 shows the historical returns of the BIZD ETF. Comparing BIZD to BDCX from figure 4 above, we can see that BIZD actually outperformed BDCX in both 2021 (36.7% total return vs. 34.9% for BDCX) and 2022 (-8.7% vs. -20.4% for BDCX).
Figure 14 - BIZD historical returns (morningstar.com)
Figure 15 shows the historical returns of PCEF. Comparing PCEF to CEFD from figure 5 above, we see that although PCEF underperformed CEFD in 2021 (15.3% vs. 21.4% for CEFD), it outperformed in 2022 (-18.4% vs. -28.5%).
Figure 15 - PCEF historical returns (morningstar.com)
In both instances, the UBS ETNs achieved the exceeded the 150% leverage to the downside in 2022, but did not provide the expected 150% leverage on the upside in 2021.
Conclusion
BDCX and CEFD are two high yielding ETNs offered by UBS that provide levered exposure to BDCs and CEFs respectively. In my opinion, investors should avoid both products, despite their high distribution yields.
In both ETNs, investors are structurally set up to underperform. First, both products currently charge ~4% total expense ratios. More importantly, both have leverage reset features that disadvantage long-term investors.
Comparing BDCX and CEFD against unlevered products like BIZD and PCEF, we find that the UBS ETNs have more than 150% downside capture with less than 150% upside returns against their respective asset classes.
For further details see:
BDCX And CEFD: Structurally Disadvantaged Products, Avoid