TQQQ - Beat The Market With Combinatoric Kabbalah
Summary
- Combinatoric analysis enhances creative insight and visual understanding of multidimensional market return behavior.
- Reputable LETF groups feature factory installed dimensionality structures, making them ideal for combinatoric cross component analysis.
- A simple and clear example of RLETF group analysis using combinatorics is demonstrated.
The Legend
You unlock this door with the key of imagination. Beyond it is another dimension-a dimension of sound, a dimension of sight, a dimension of mind. You're moving into a land of both shadow and substance, of things and ideas. You've just crossed over into the Twilight Zone.
Twilight Zone Opening Narration (Season 4 and 5)
My stock market research, such as it is, focuses on the twilight zone between applied information theory and mathematics.
A formidable candidate for the most excellent academic discipline supporting intelligent stock market analysis is combinatorics .
Combinatorics is an area of mathematics primarily concerned with counting, both as a means and an end in obtaining results, and certain properties of finite structures.
In the later twentieth century, powerful and general theoretical methods were developed, making combinatorics into an independent branch of mathematics in its own right.
Approaching combinatorics from the information side results in the associated math becoming of quite secondary importance. It makes things easier to not worry too much about the math, but is this approach inferior in any important way to a mathematical orientation?
Information Theory has a lot in common with Theology. Combinatorics is the foundation of the mystical traditions of all of the world's major religions.
For example, The Nine Billion Names of God (1953) is a famous short story by Arthur C. Clarke that deals with combinatorics from a science fictionesque interpretation of Tibetan Buddhism. It made an impression on me when I read it, not very many years after it was published.
The clearest example of combinatorics from the western mystical corpus is Abraham Abulafia and the school of Prophetic Kabbalah. Natural Language Processing Dates Back To Kabbalist Mystics (IEEE Spectrum) discusses Abulafia's insight pertaining to AI; that insight applies, at least equally, to combinatorics and information theory in general.
In classical (for lack of a better term) Kabbalah, the sephirotic tree, aka tree of life, is seen as an emanation of ein sof or the infinite. In prophetic Kabbalah, the tree is more like an enumeration of the combinatoric name.
In this article, combinatorics will be discussed from an Applied Information Theory / Kabbalistic perspective.
Reputable LETF Groups
In combinatorics, the relevant sub discipline for studying groups is partition theory . The link discusses partitioning from a mathematical perspective.
Reputable Leveraged ETF groups have excellent factory installed dimensionality structures that make them ideal for cross component analysis. An LETF group is reputable if there are 1X, 2X, and 3X Bulls and Bears.
Four RLETF groups occur in nature: SPY ; QQQ ; IWM ; and DIA .
Prior to this year, I avoided the Bears (and 2X Bulls), mainly because they add serious dimensional complexity to the analytical structure. Fortunately, a combinatoric approach is very effective in visualizing and dealing with these issues.
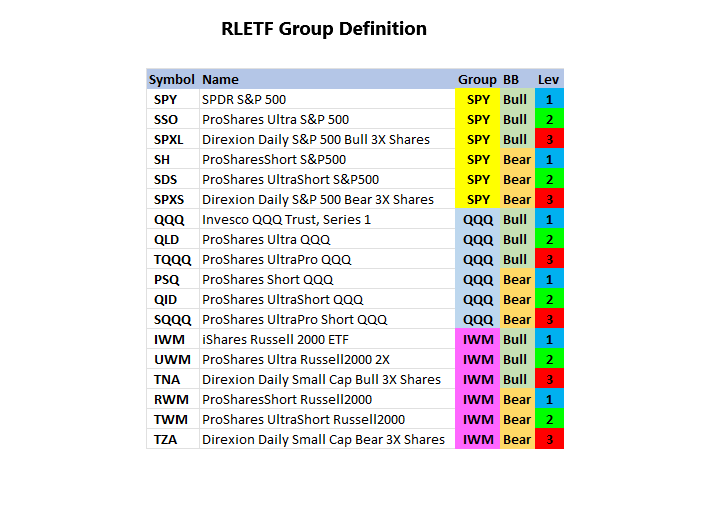
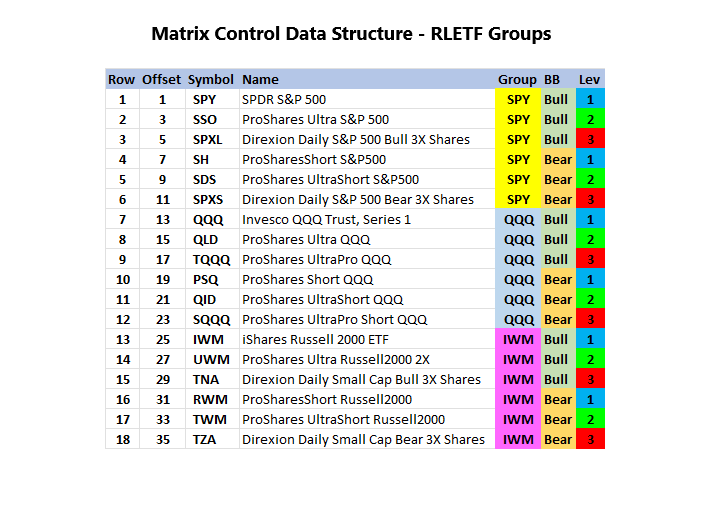
RLETF Group Definition
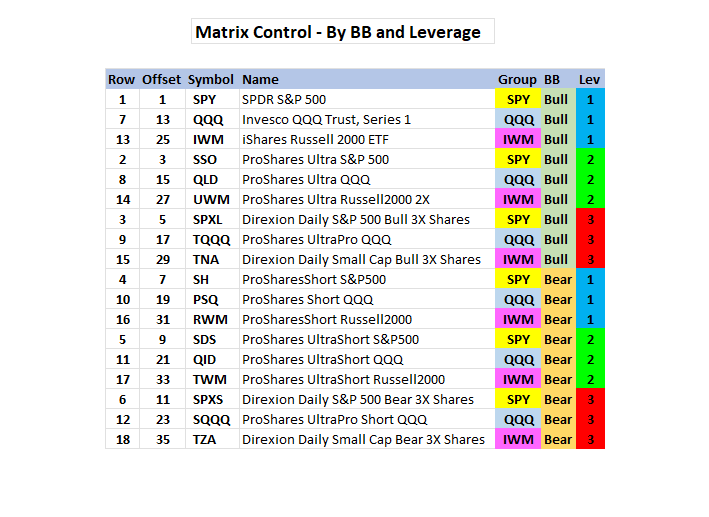
Creating the RLETF group definition is a necessary but straightforward first step. Three of the four RLETF groups are shown below.
The symbol for each ETF is unique by definition. The name further defines the symbol. However, symbol and name have no clear combinatoric value for RLETF group analysis.
The dimensional structure is defined by the three right columns:
- Group = Group name
- BB = Bull or Bear
- Lev = Leverage
Human very short term memory is direct access and limited in how much it can store. A major design goal of any analytical methodology is to minimize the need for extraneous human thinking. Even a single RLETF group is difficult to load into very short term human memory.
This issue can be addressed effectively by not using the symbol. A unique identification can be built by concatenating Group, BB, and Leverage into SPY Bull2, QQQ Bear1, etc.
RLETF Statistical Givens
There are important virtual statistical givens relevant to RLETF Groups that enhance their analytic usefulness:
- Volatility BBX = Volatility Bull1 * Leverage BBX
- Beta BullX with Bull1 = Leverage BullX
- Beta BearX with Bull1 = -1 * Leverage BearX
- Correlation BullX with Bull1 = 1
- Corerelation BearX with Bull1 = -1
The statistical equivalences usually hold to within 0.001.
Chart Analysis
Charts are the easiest way to visualize and hence, analyze data. Graph Theory is a major pillar of combinatorics. The techniques discussed here may be related to the obscure sub discipline of graph enumeration .
I've been working with the Excel chart object for quite a while. My humble ultimate ambition was to create charts with minimal human intervention that promote visual understanding of the various RLETF multidimensional relationships.
This seemed to require attaining the Shaolin level skill of creating charts from arrays that are not attached to worksheet data ranges. Achieving enlightenment has given me the confidence to move into the combinatoric phase of the exercise.
... at the mouth of two witnesses, or at the mouth of three witnesses, shall a matter be established.
Deuteronomy 19:15
Here we interpret two witnesses or three witnesses to mean, two data streams or three data streams on a line chart. To keep things simple, only the security's daily closing price is used to build two data streams:
- CC = Close to Close = daily logarithmic return. CC on a chart is a running total of daily CC over the time segment. This is the buy and hold return.
- CD = Close Deviation = a volatility measurement; EWMA deviation of CC, where Lambda = 0.94. Use 3D Volatility Ratios For Investment Decision Making explains the CD calculation. It is quite simple, basically also a running total.
Single Symbol Charting
The classical and elementary case is charting a single symbol.
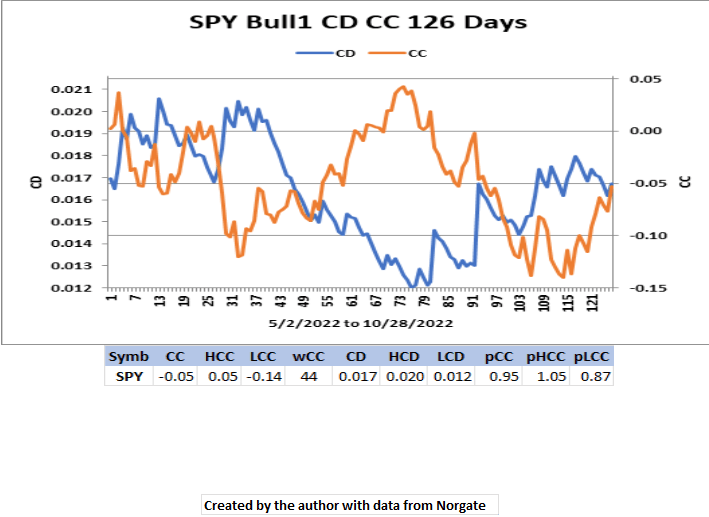
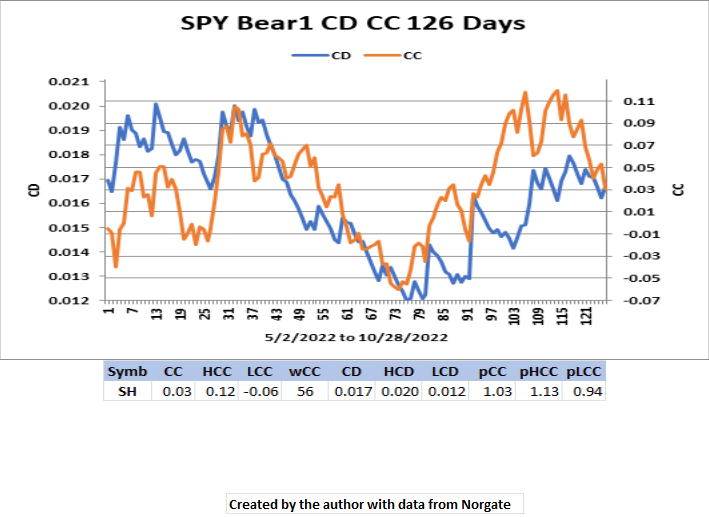
SPY Bull1 126 Day CC_CD (JIFriedman.com) SPY Bear1 CD CC 126 Days (JIFriedman.com)
CD is the blue line, left axis. CD looks the same for both SPY Bull1 and SPY Bear1 ( SH ).
The chart format is an interpretation of the best possible way to look at what's been going on with a stock using a line chart with minimal intra component data. I promise I won't get mad if someone has a better idea.
The lookback period (time segment) is a variable. 126 days is 1/2 of the 252 day market year, it gives a nice view of this year's spring weakness, summer rally, late summer rejection, consolidation, and current at least intermediate strength rally, arriving more or less on schedule for Oct - Nov.
Bull CC tends to go up while CD is going down while Bear CC goes in the same direction as CD. Looking at these concrete measurements on a daily basis through a combinatoric framework is the best way to assess broad market conditions.
The summary line is an interpretation of critical information, where exact numbers are difficult to determine by just looking at the chart:
- CC = Buy and Hold Logarithmic return at period end.
- HCC = Highest CC observed.
- LCC = Lowest CC observed.
- wCC = Daily win rate as a percent over the period
- CD = Ending CD
- HCD = Highest CD observed.
- LCD = Lowest CD observed.
- pCC = Present Value of $1 invested at the start of the period.
- pHCC = Highest pCC observed.
- pLCC = Lowest pCC observed
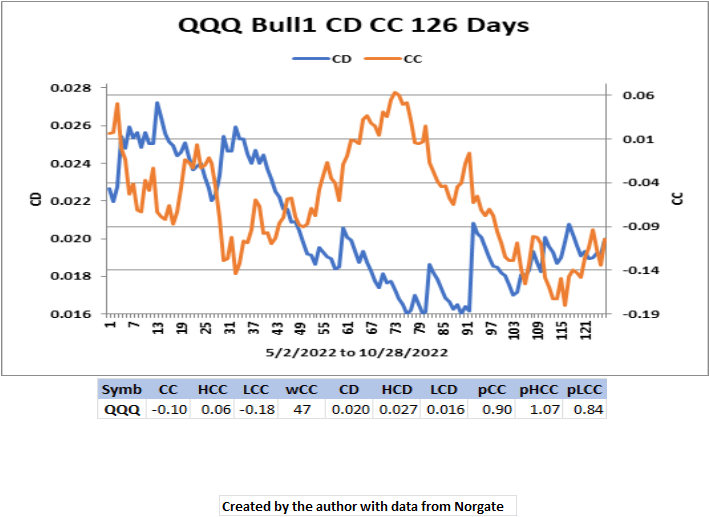
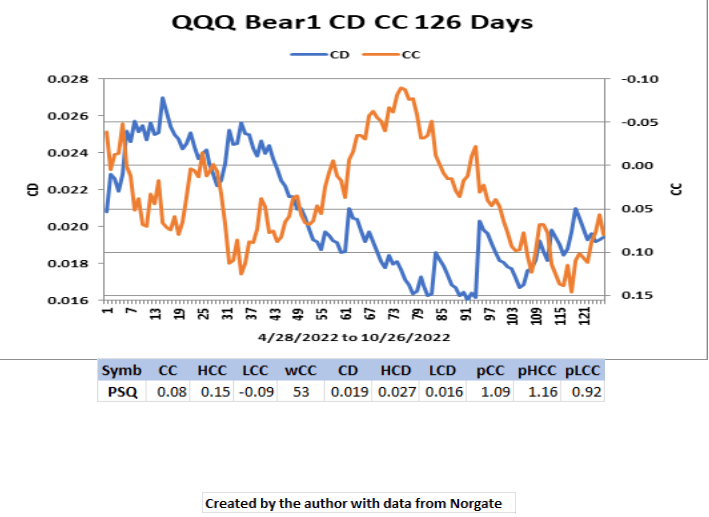
QQQ Bull1 and Bear1 Reverse Plot
It is possible to reverse the plot order of CC or CD. QQQ Bear1 ( PSQ ) has the CC plot reversed. This is done by setting ReversePlotOrder = True on Axes(xlValue, xlSecondary) on the chart object. That flips CC upside down and makes Bear1 look the same as Bull1, except the scale is different.
The QQQ September rejection was accompanied by less of a rise in CD than seen in SPY. CD numbers for Bull1 and Bear1 are the same.
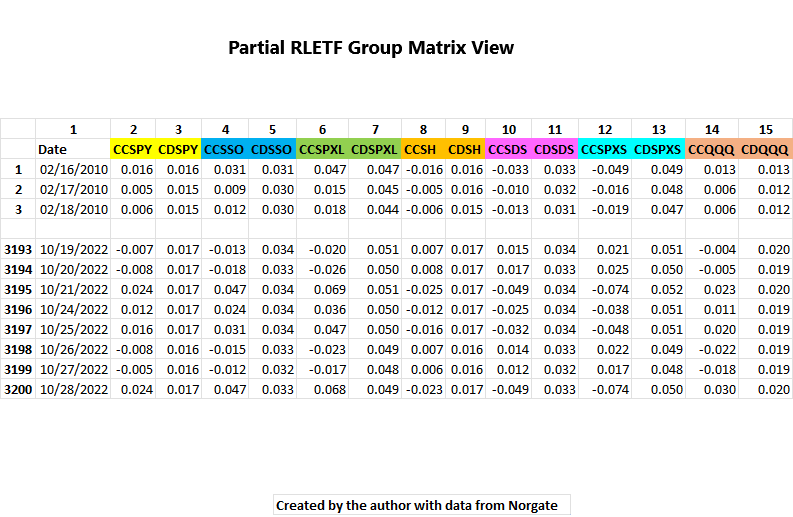
Combinatoric Operations - Matrix Layout
Combinatoric analysis is based on data stream interchangeability. Storing price history information for easy, fast, and simple access is a critical design issue.
Excel based stock price history data analysis traditionally begins with storing time series price data for a single stock on a single worksheet. That structure is OK for analyzing a single stock, but design flaws become evident as multiple stocks are added to the mix.
The matrix concept was introduced in How To Make A Stochastic Volatility Supermodel , as a solution to the stability/scalability issues of the one to one worksheet/stock ratio. With a little practice, the matrix structure considerably simplifies coding and algorithm efficiency.
Matrices are generally associated with mathematical operations, like matrix multiply. That's not going on here. In this case, the matrix is a two dimensional representation of a multidimensional data structure. This is a solid and useful structure for multidimensional analysis that is well known academically and commercially. Usually, multidimensional analysis is associated with a database, but a database isn't needed here.
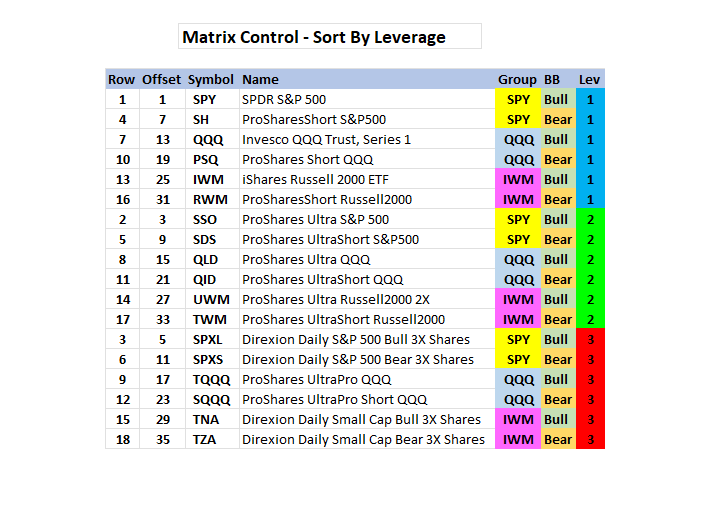
Group Definition Matrix Control
The group definition tells the matrix build algorithm the horizontal sequence of stocks in the matrix. The build algorithm updates the offset, which makes it easy to customize (add or remove) matrix columns
The chart algorithm identifies the matrix column address of a data stream instantly by using the offset. For example:
- Column Address of CC QQQ = Offset QQQ + 1 =14
- Column Address of CD QQQ = Offset QQQ + 2 = 15
In the elementary single stock routine, one row is read from the group definition every processing cycle. The group definition is currently sequenced to analyze Group Bulls and Bears. In this case, three rows are read for each processing cycle.
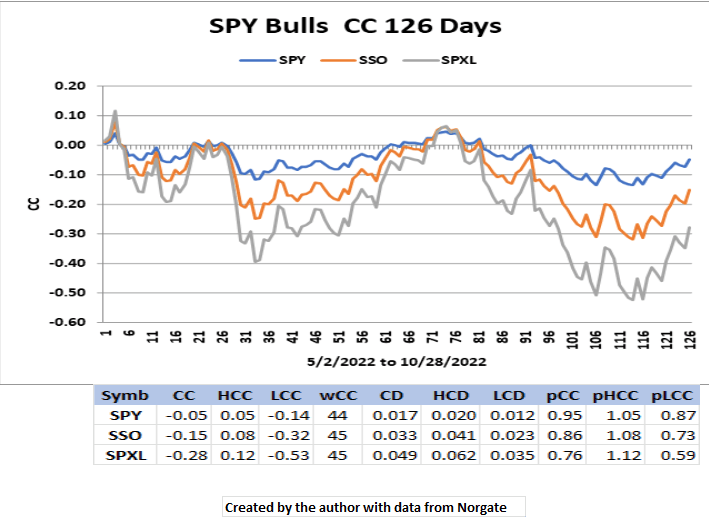
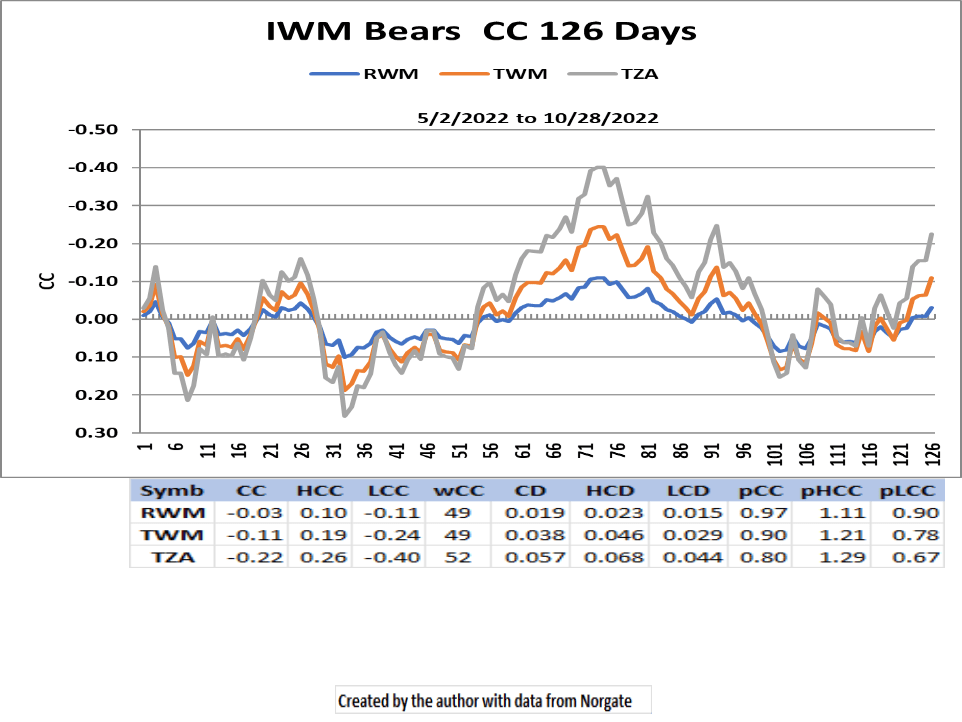
Group Bulls And Bears
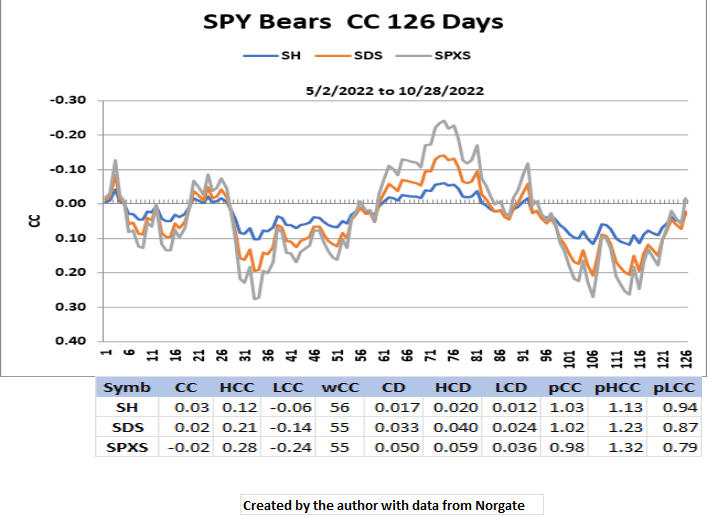
SPY Bulls CC 126 Day (JIFriedman.com) SPY Bears 126 Day CC (JIFriedman.com)
The algorithm looks at every three rows in the Group Definition and produces a CC data stream for each of the three bulls or bears. The bear chart is reverse plotted.
Bulls and bears have obvious differences in return characteristics.
LETF returns seem to get random if the return over a time segment is small. The group charts do a good job of explaining why. If there is an oscillation between profit and loss going on, the three CC data streams have to cross at some point which ideally happens around return = zero. That is not easy to understand without looking at the charts.
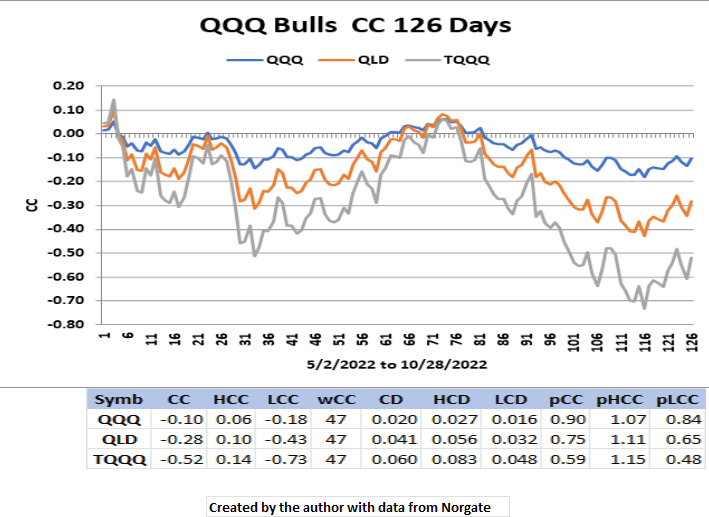
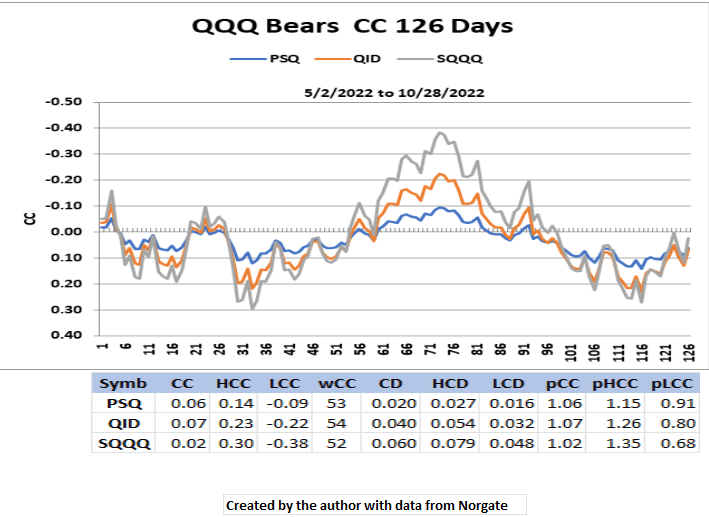
QQQ Bulls 126 Day CC (JIFriedman.com) QQQ Bears 126 Day CC (JIFriedman.com)
Once again the Bear streams are different than the Bulls. TQQQ profit at the end of the summer rally was 0.14 versus a loss of 0.38 for SQQQ .
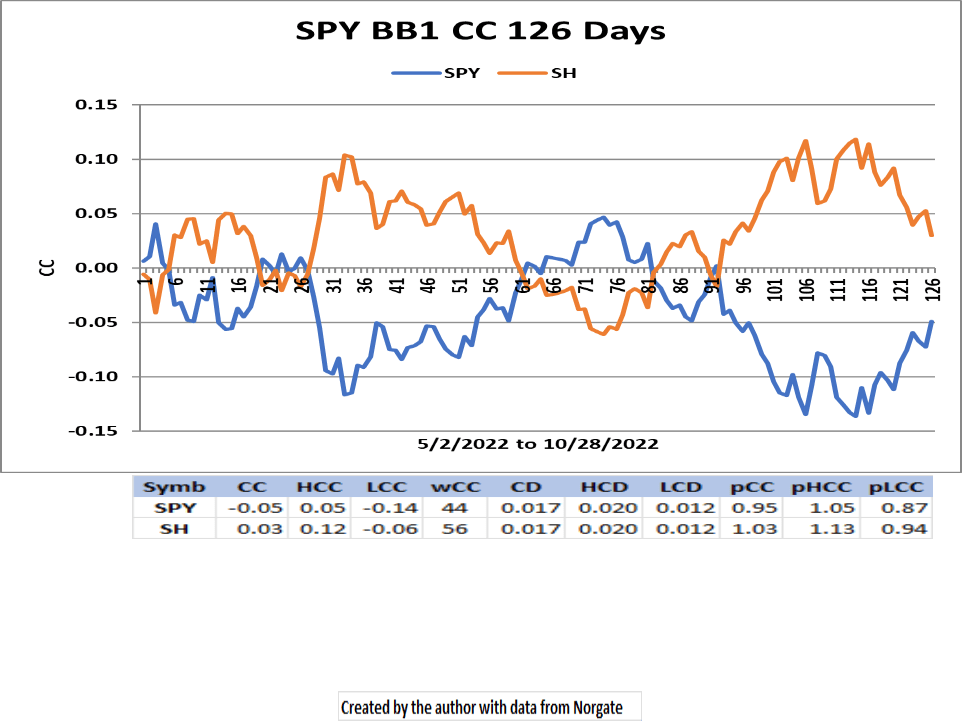
Bull/Bear Combinatorics
Excel has a significant deficiency in that there is no array sort. On the other hand, the worksheet sort is pretty good.
In the Group Bull and Bear Analysis, three rows were read from the group definition / matrix control structure in the processing cycle. In Bull/Bear combinatorics, two rows are read in the processing cycle .
SPY BB1 126 Day CC (JIFriedman.com)
The original idea was to put CD on the BB (Bull/Bear) charts since it is virtually the same for both. That seemed to look too busy. The waves formed by the streams crossing are pretty cool.
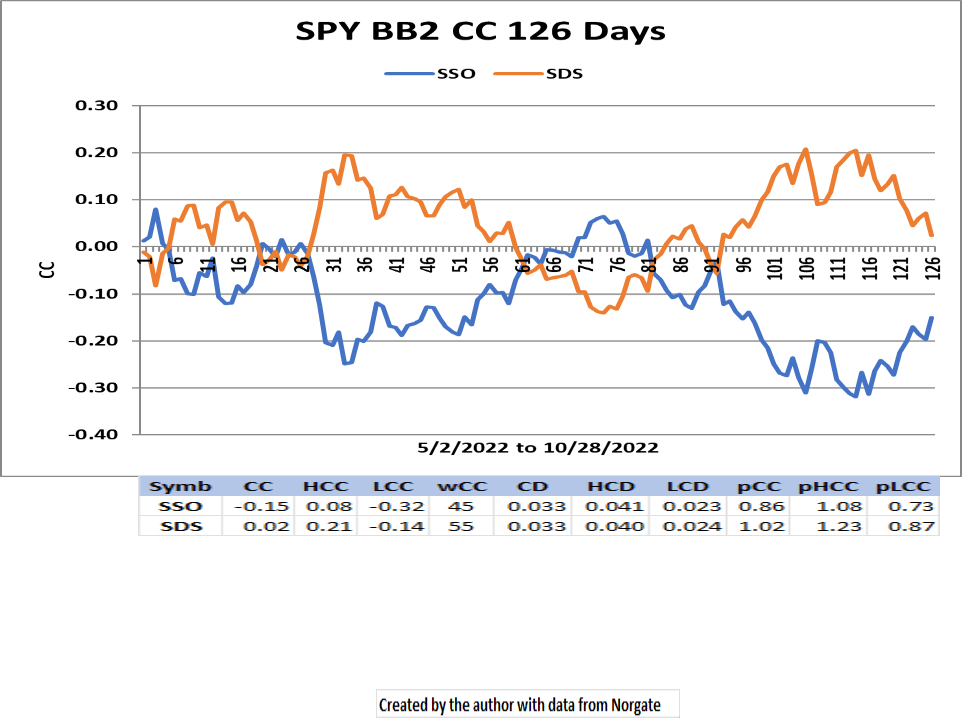
SPY BB2 126 Day CC (JIFriedman.com) SPY BB3 126 Days CC (JIFriedman.com)
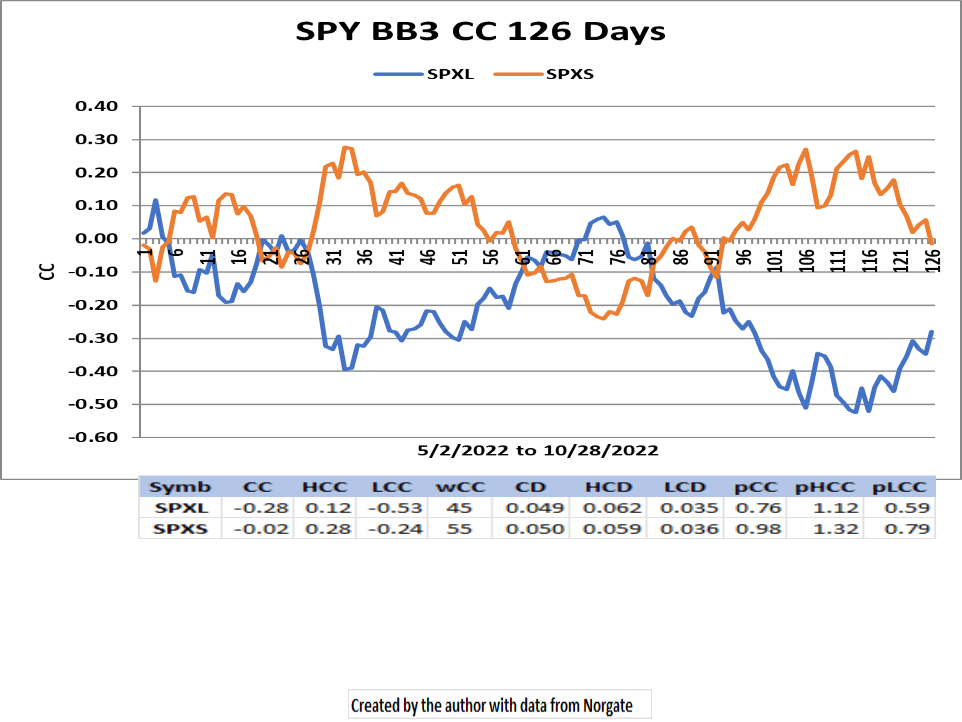
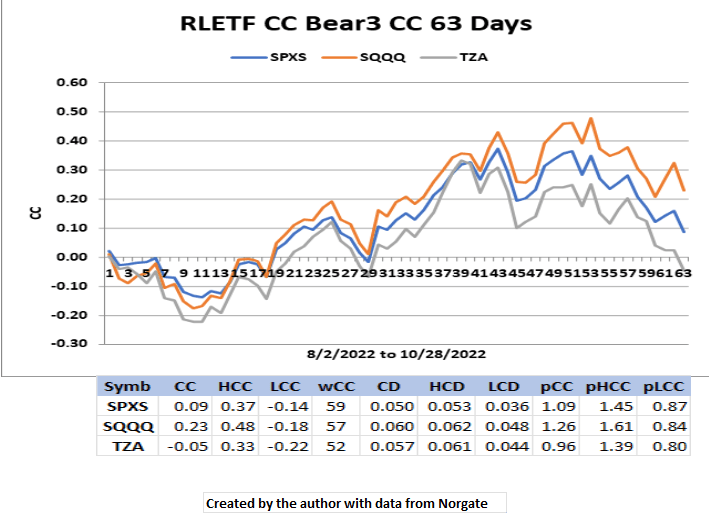
All three charts are similar except for the scale. As leverage increases, the Bear CC line drops ever closer to zero, turning negative for SPXS , Bear3.
Another rational sequence is by BB and then by Leverage.
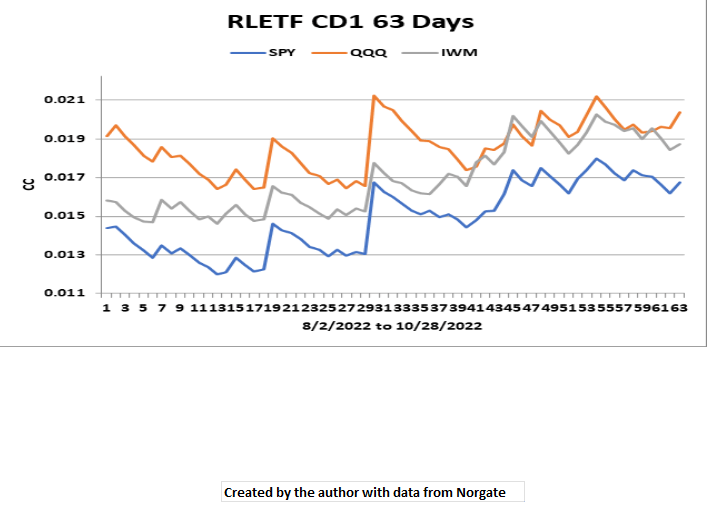
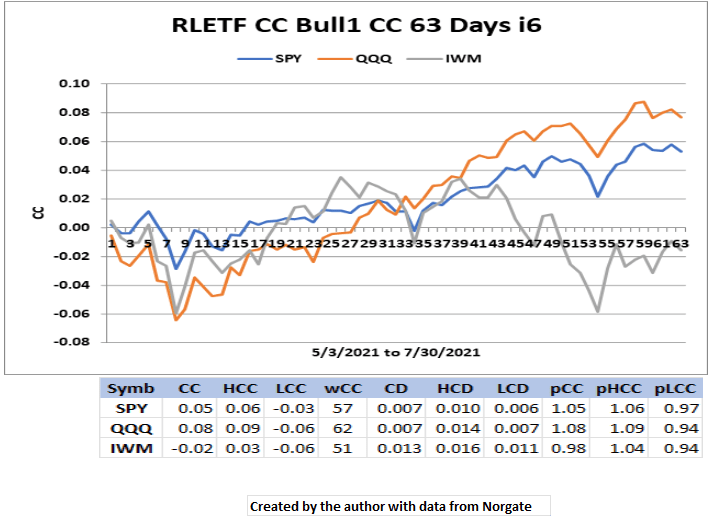
Inter Group Combinatorics
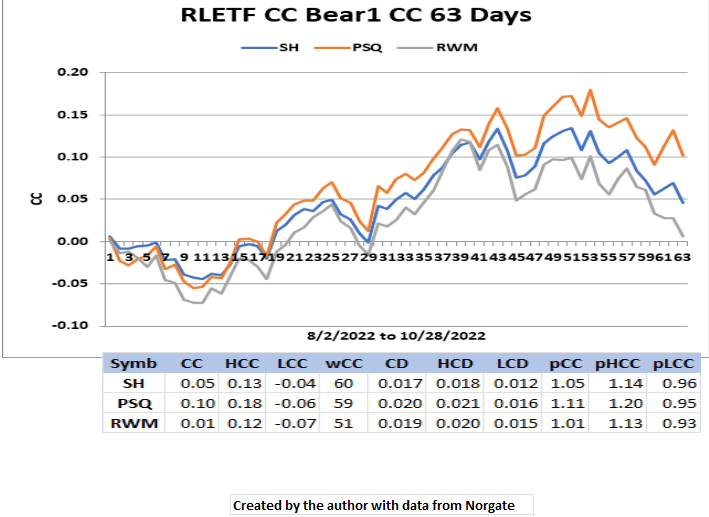
Inter Group Bull and Bear Combinatorics uses the three row read per cycle from the group definition.
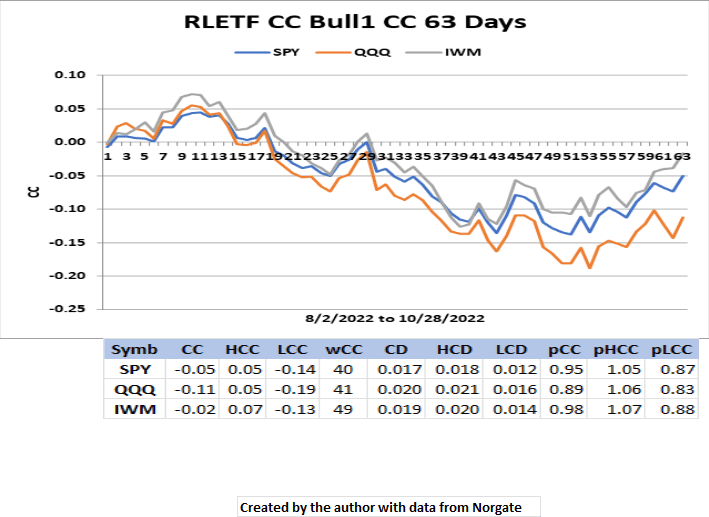
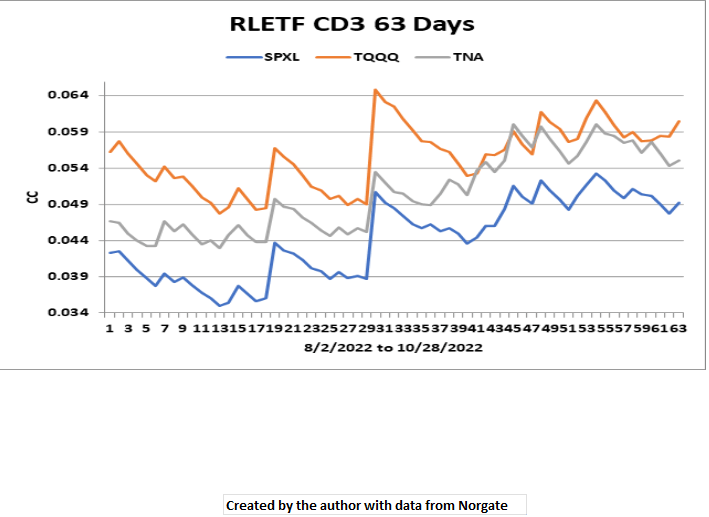
The lookback period has been changed to 63 days or a quarter of a year. There was a high degree of CC correlation on the downtrend. During the recent consolidation and uptrend correlation has lessened. That seems bullish. QQQ is obviously the weakest here.
CD is the same for Bulls and Bears with the same leverage, so the CD display applies to both BB categories. Usually IWM is more volatile than QQQ.
The chart shows iteration 6 of 63 days, when times were less interesting.
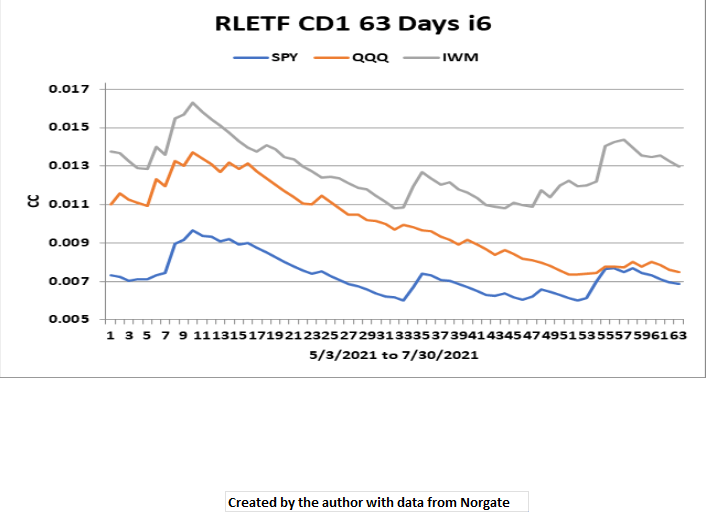
The CD numbers are substantially lower in i6 except for IWM. QQQ had CD equal to SPY at some points. I was surprised by QQQ's volatility divergence from SPY earlier this year, my bad. The usefulness of combinatoric analysis speaks for itself.
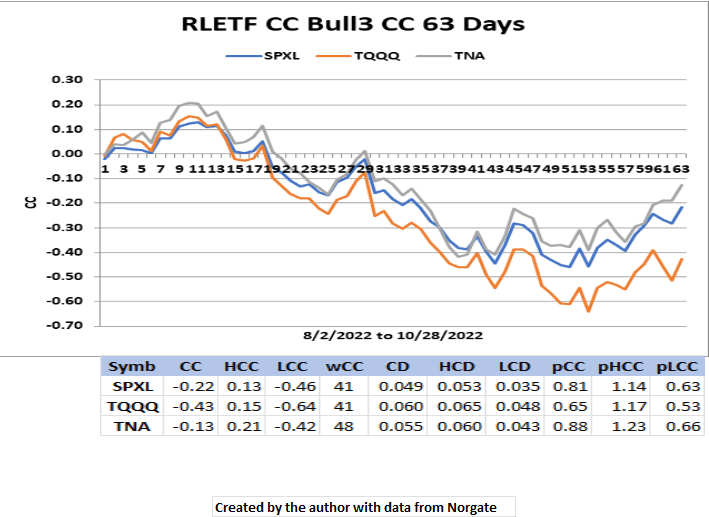
The 63 day 3X Freakshow closes out the chart presentation. The charts look the same as the 1x with the exception of the larger scaling.
Conclusion
Once a chart is created it should be exported as a .PNG file for viewing on a photo viewer and removed from Excel as soon as possible . This article was produced by a prototype of that methodology. Perhaps the export could be done to PowerPoint.
Combinatorics made the RLETF structure easy to understand, while encouraging new insights. The entire process outlined here runs uninterrupted in just a few seconds.
No moral, no message, no prophetic tract, just a simple statement of fact... Tonight's very small exercise in logic from the Twilight Zone.
Twilight Zone Closing Statement, The Shelter (1961)
For further details see:
Beat The Market With Combinatoric Kabbalah