VOO - Berkshire Hathaway: Do As Buffett Says Not As He Does
2023-12-31 03:24:18 ET
Summary
- An updated calculation of Berkshire's current P/B shows that it is trading in the fair valuation range.
- Leading manufacturing activity indicators warn of a slowdown, which could adversely impact Berkshire's earnings performance for its operating business.
- Cash flow conversion has worsened again over the last 2 quarters and the deterioration is not a miniscule amount.
- Technical analysis of Berkshire relative to the S&P500 also suggests mean-reversion possibilities back down towards the longer-term 15-year trading range, implying negative alpha potential vs the broad market index.
- I have my eye on the rebounding consumer sentiment indicators as a key risk monitorable. If this translates to earnings surprises in Berkshire's equity investments, it could play spoilsport to my 'Strong Sell' thesis.
Performance Review and Outlook Update
In my last article on Berkshire Hathaway ( BRK.B ) ( BRK.A ), I issued a 'Neutral/Hold' rating as I thought it would broadly track the S&P500; neither beating it nor underperforming it by a large margin. Since then, the stock has returned 2.39% compared to the S&P 500 ( SPY ) ( SPX )'s +5.02% on a total shareholder return basis over the 5-month period. Although Berkshire has underperformed it has underperformed slightly, I think the 'Neutral/Hold' call has broadly gone well.
Now, I have a high degree of confidence that Berkshire would be an alpha-bleeder over the next few months and quarters ahead. Hence, I am downgrading the stock to a "Strong Sell" on account of this relative performance outlook vs the S&P500. To be clear, my absolute performance outlook for Berkshire is not as bearish; I anticipate absolute performance to be steady or making a slow positive ascent for the stock (whilst still lagging the market) in the next few months and quarters.
Please see the end of this article for more details on how to interpret my ratings.
Thesis
I believe Berkshire is poised to underperform due to the following reasons:
- Berkshire is in the fairly valued range
- Leading manufacturing activity indicators warn of a slowdown
- Cash flow conversion continues to worsen
A reminder on what matters most
Berkshire Hathaway is a huge business with many moving parts. But this snapshot immediately reveals what matters most:
Berkshire Hathaway Snapshot (Company Filings, Author's Analysis)
Please note that the signs for the mix numbers in the EBIT breakup are not as clean, as there is an interplay between positive and negative contributions. I suggest focusing on the absolute value of these numbers or the scale of the nominal amounts to get the essence of what is most important.
The EBIT breakup shows that Berkshire's investments are the most important driver of earnings. The investment and net derivative gains line item has singlehandedly dominated and undone the positive contributions of virtually all the operating segment businesses. Excluding the investment contributions (including investment income), it is clear that the Manufacturing subsidiaries are the largest (33.7% influence) EBIT contributor in the operating business.
Within the investments portfolio, the volatile movers contributor group is the equities portfolio, which makes up 65.7% of all investments. Most (57.2%) of these equity investments are linked to the consumer sector.
Lastly, keep in mind that whilst Berkshire's insurance businesses are not the major contributor of earnings, they are critically important as they are large cash flow generating engines due to the upfront collection of premiums.
Berkshire is in the fairly valued range
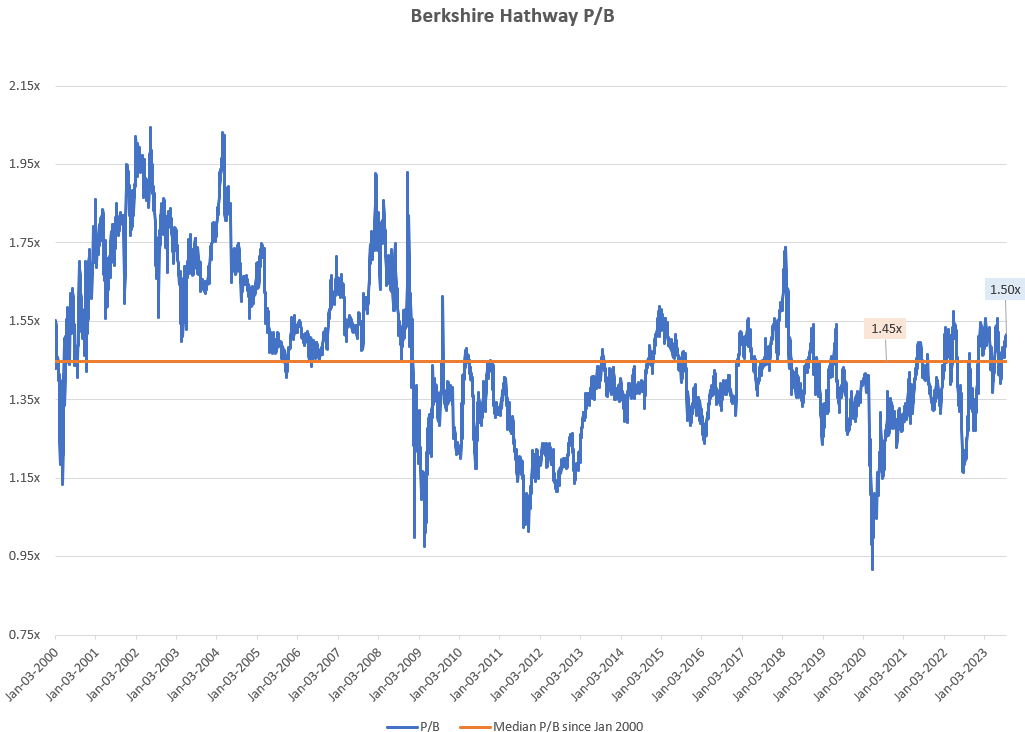
Berkshire Hathaway P/B (Capital IQ, Author's Analysis)
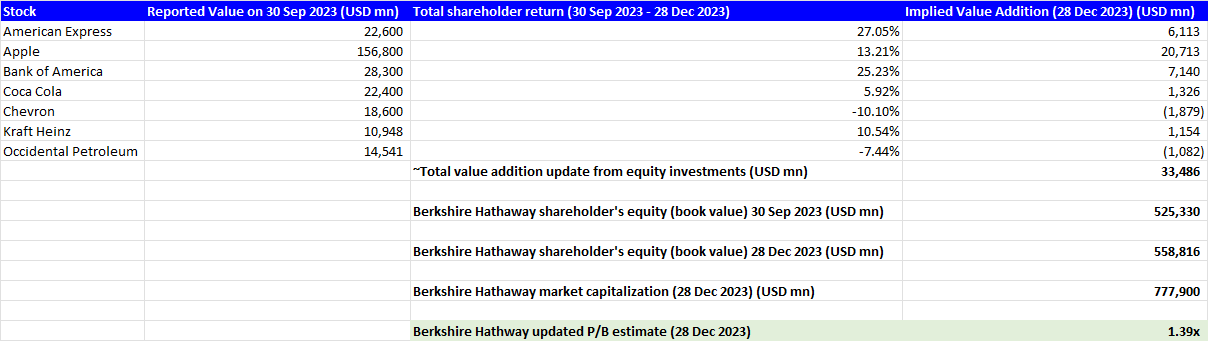
The chart above shows Berkshire's longer term P/B multiple. The key thing I want to draw your attention to here is the longer term median of 1.45x. The latest figure of 1.50x is not fully accurate, as it does not account for the movements in the value of the equities portfolio. After making this adjustment, I find that a more true approximation of Berkshire's latest P/B is 1.39x:
Latest P/B Calculation (Company Filings, Seeking Alpha, Author's Analysis)
A P/B of 1.39x is only a 4% discount to the longer term median P/B. Therefore, I conclude that Berkshire is close to fair value today.
Leading manufacturing activity indicators warn of a slowdown
As mentioned in the first section, the Manufacturing businesses carry the greatest weight to the operating business' EBIT, contributing 33.7%. Hence, the outlook for this segment becomes relevant.
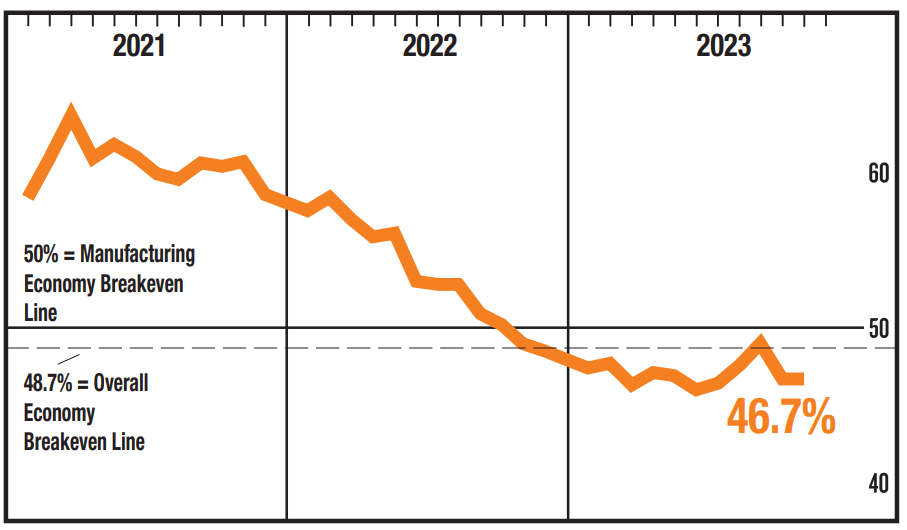
According to the November 2023 Manufacturing Report on Business published by the ISM Report on Business, the overall Manufacturing PMIs have been below 50 and hence signaling contraction for 13 consecutive months:
November 2023 Manufacturing PMI (Institute for Supply Management Report on Business)
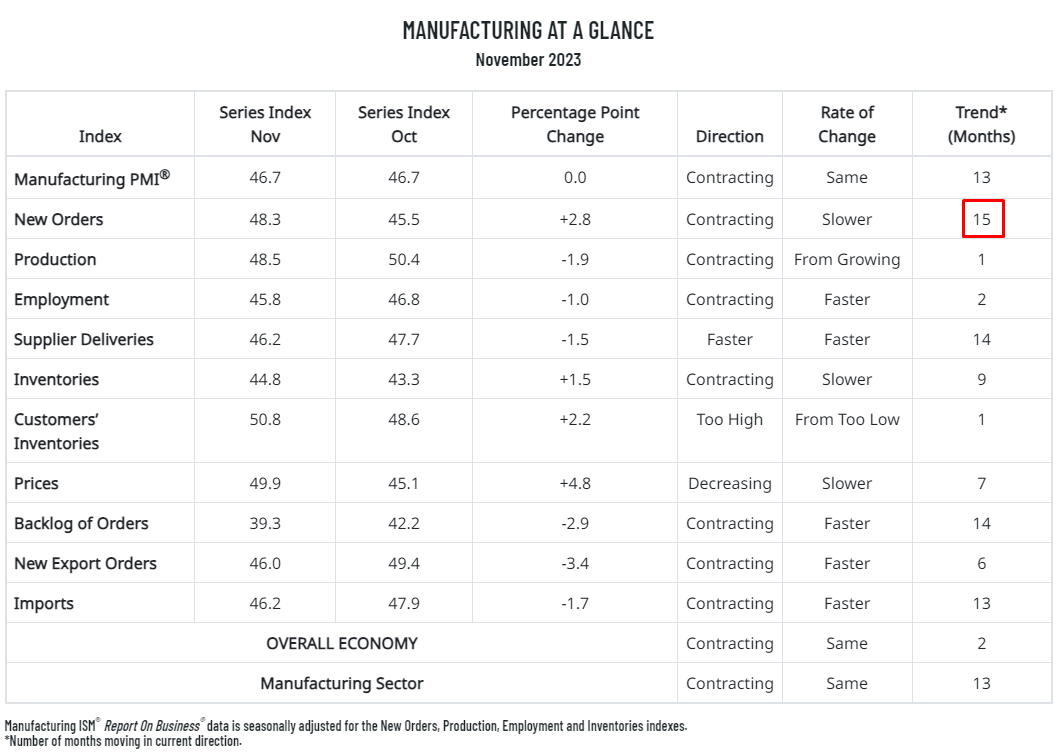
There are no early signs of a turnaround yet as new orders (which tends to lead the overall PMI number) are also contracting for 15 consecutive months:
November 2023 Manufacturing PMI Detail (Institute for Supply Management Report on Business)
Now take a moment to note that 80.3% Berkshire's Manufacturing revenues are geared more towards businesses (industrial and building):
Q3 FY23 Mix of Manufacturing Revenues (Company Filings, Author's Analysis)
With that in mind, have a look at the qualitative commentary by executives across the key Manufacturing segments:
November 2023 PMIs Qualitative Commentary (Institute for Supply Management Report on Business)
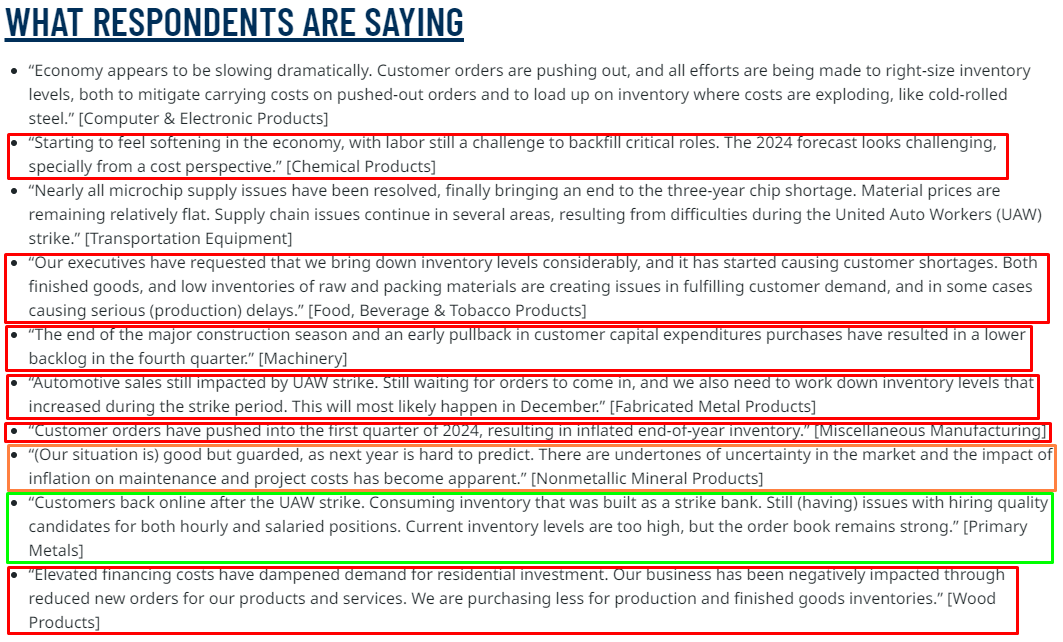
I have highlighted comments indicating a bearish outlook in red, neutral outlook in orange and a positive outlook in green .
From this, it is apparent that Berkshire's manufacturing business is broadly exposed to a sector that is seeing broad-based demand and inventory headwinds. I believe this could contribute to lower than expected operating performance in Berkshire's operating portfolio in Q4 FY23.
Cash flow conversion continues to worsen
In my last article, I had noted weakness in the cash flow conversion profile of Berkshire Hathaway as a whole. 2 quarters later to Q3 FY23 , these metrics have eroded further:
Net working capital including deferred income tax days (Company Filings, Author's Analysis)
For context, the extent of this deterioration over the last 2 quarters amounts to a hit in cash flows equal to 4.4% of revenues. Typically, a 4.4% degrowth in revenues in only 2 quarters is a sign of potential trouble. I view this erosion in the working capital profile of the business similarly until there is no sign of a return back towards the previous norm of -270 odd days. And so far, there are no indications of this occurring.
Technical Analysis
If this is your first time reading a Hunting Alpha article using Technical Analysis, you may want to read this post , which explains how and why I read the charts the way I do, utilizing principles of Flow, Location and Trap.
Relative Read of BRK.B vs SPX500
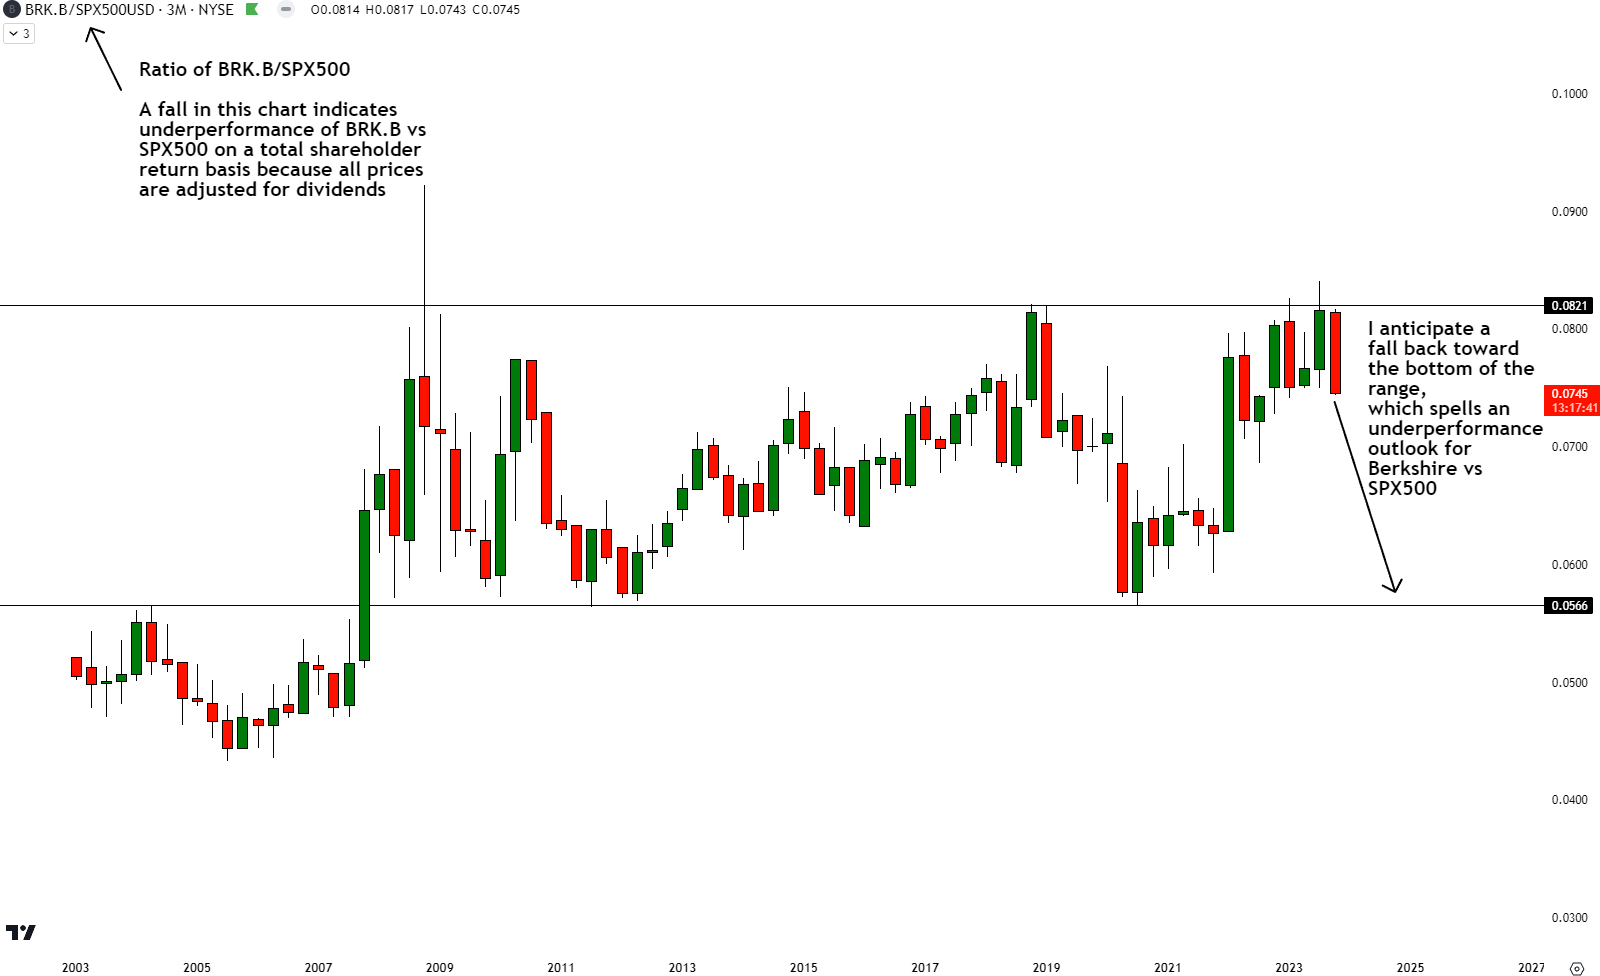
BRK.B vs SPX500 Technical Analysis (TradingView, Author's Analysis)
Looking at the relative chart of BRK.B with the S&P500, I notice that the ratio prices are currently rejecting off the top-end of the longer-term trading range. I anticipate a mean-reversion move back toward the bottom of the ~15 year trading range going forward, which would imply negative alpha for Berkshire Hathaway against the S&P500.
Key Risk and Monitorable
As seen in the first section, Berkshire Hathaway's investments matter the most for overall EBIT. And within these investments, it is the 65.7% of equity investments that are the major contributors. Digging into this group, we find that the portfolio is geared mostly to the Consumer category:
Equity Security Investments Mix (Q3 FY23) (Company Filings, Author's Analysis)
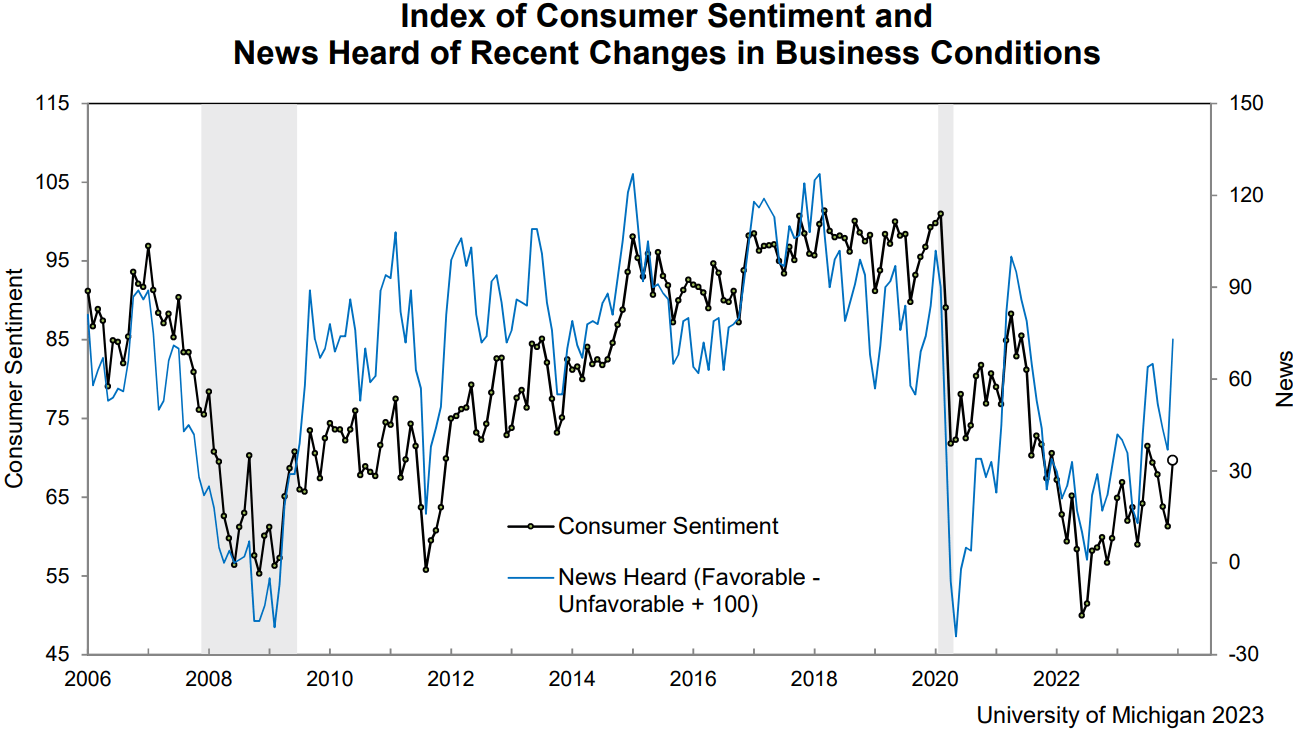
This makes the Consumer Sentiment indicators a relevant factor to assess. And here, according to the University of Michigan Consumer Sentiment Index data, a healthy rebound is emerging:
University of Michigan Consumer Sentiment Index (University of Michigan)
If this is a prelude to Q4 FY23 earnings surprises in relevant equities such as Apple ( AAPL ), Coca-Cola ( KO ) and Kraft Heinz ( KHC ), then I believe Berkshire's stock could rally in tandem, which would undermine my relative bearish thesis. Hence, continued prints on the high frequency consumer sentiment releases and the earnings of the aforementioned equities is something I will monitor to evaluate the health of my thesis.
Takeaway
I had a 'Neutral/Hold' rating on Berkshire Hathaway in my last coverage of the stock, which I would say has broadly been an accurate assessment. But now, I am downgrading my stance:
My latest P/B valuation says Berkshire Hathaway is currently in the fairly value range. However, as leading indicators of manufacturing activity point towards continued contraction, I believe Berkshire may see underwhelming earnings growth in its operating business segment since Manufacturing makes up the bulk (33.7%) of the operating subsidiaries' earnings. Another sign of concern is the cash flow conversion profile, which has continued to erode over the last 2 quarters to the extent of 4.4% of revenues in size; not a small deterioration.
Technical analysis of the relative ratio chart of BRK.B vs the SPX500 also points towards downside and hence Berkshire underperformance as I anticipate mean reversion back towards the bottom of the ~15-year trading range. On the risks side, I have my eye on consumer sentiment indicators, which I recognize may play spoilsport to my thesis if it results in upside surprises in key stocks such as Apple, Coca-Cola and Kraft Heinz.
All things considered, I am rather confident that Berkshire Hathaway is set for multiple months and quarters of underperformance vs the S&P500. Therefore, I would do as Buffett says (buy the Vanguard S&P 500 ETF ( VOO )), not as he does (invest in Berkshire):
My advice to the trustee could not be more simple: Put 10% of the cash in short-term government bonds and 90% in a very low-cost S&P 500 index fund. (I suggest Vanguard’s)
- Excerpt from the 2013 Berkshire Hathaway shareholder letter , Author's bolded highlight
Rating: Strong Sell
How to interpret Hunting Alpha's ratings:
Strong Buy: Expect the company to outperform the S&P500 on a total shareholder return basis, with higher than usual confidence
Buy: Expect the company to outperform the S&P500 on a total shareholder return basis
Neutral/hold: Expect the company to perform in-line with the S&P500 on a total shareholder return basis
Sell: Expect the company to underperform the S&P500 on a total shareholder return basis
Strong Sell: Expect the company to underperform the S&P500 on a total shareholder return basis, with higher than usual confidence
For further details see:
Berkshire Hathaway: Do As Buffett Says Not As He Does