HLMN - Bernzott Capital Advisors US Small Cap Value Fund Q1 2023 Commentary
2023-04-26 15:10:00 ET
Summary
- Equity markets started the year strong, with small cap stocks posting double digit gains through early February.
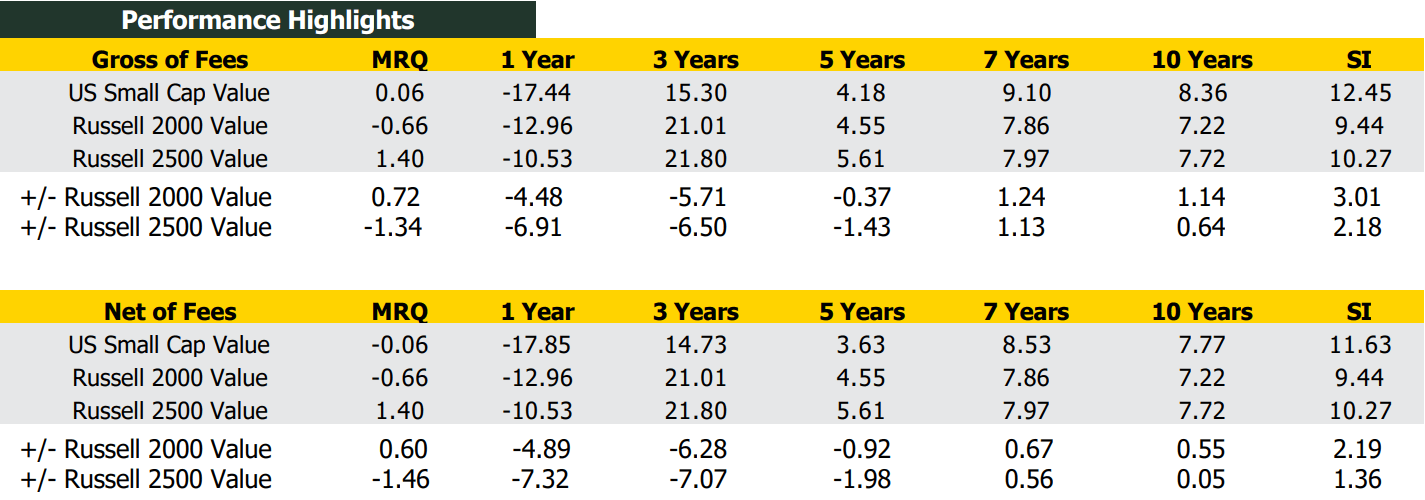
- The portfolio was virtually flat on a net basis (-0.06%), outpacing the R2000V’s decline of -0.7% but below the R2500V’s rise of +1.4%.
- We ended 1Q managing $548 million, with $286 million in our US Small Cap Value strategy.
1Q Market Overview
Global financial markets rose in a volatile first quarter. Equity markets started the year strong, with small cap stocks posting double digit gains through early February. Speculative meme stocks even re-entered the headlines, and a surge in trading of "ODTE" options contracts (zero days to expiry) was an unusual phenomenon indicative of speculation that had observers wondering about potential danger to broader markets. Market tenor later cooled due to Fed hawkishness, weakening economic data and renewed recession concerns. Dramatic failures of three domestic banks, most notably Silicon Valley Bank, as well as distress at Credit Suisse, sparked bank-run contagion fears and roiled markets. Bond market volatility spiked coincident with the mid-March bank turmoil, sending volatility to levels seen only twice in the last thirty years. The benchmark 10-year Treasury yield fell from 3.87% to 3.47% in a flight to quality. Gold rose 8.7%.
The FOMC raised its benchmark interest rate by 25bps in March and reaffirmed its intent to tame inflation. Reports mounted on slowing manufacturing activity and consumer spending. The Atlanta Fed's GDPNow forecast ticked lower with each incremental data point. The yield curve was steeply inverted. High yield spreads still are not flashing undue alarm, however, and remain below highs seen in 2011 and 2016, and even mid-2022. Falling values in several segments of commercial real estate, notably office, is a top watch list item as operators grapple with higher debt payments and face a coming wave of maturities over the next few years.
In the end, the S&P 500 gained +7.5%, and the Russell 2000 rose +2.7% in the quarter after a weak March (-4.8%). The NASDAQ Composite rebounded strongly, +16.7%, led by mega cap FANG stocks, recovering some of its miserable 2022 (-33.1%).
Value lagged growth for the quarter as growth stocks were buoyed by lower interest rates and less exposure to banks which led decliners. In 1Q, the Russell 2000 Value (-0.7%) trailed the Russell 2000 Growth (+6.1%). In the R2000V, Information Technology and Consumer Discretionary paced the advance. Financials and Health Care were laggards. Energy was a market performer, following a standout 2022, as commodity prices fell.
The S&P 500's forward P/E is now 17.8x, modestly above its 25-year average of 16.8x. Small cap valuations look attractive relative to large caps.
Recession indicators abound with a steeply inverted yield curve and restrictive monetary policy. We believe our commitment to our investment philosophy and process is more important than ever. Our focus on high quality businesses, with their attractive cash flow and strong balance sheets, should position our portfolio in companies able to weather an economic downturn and potentially volatile financial markets. Attention to valuation should also support investment returns as the current interest rate regime inhibits valuation expansion seen in recent years.
* The Bernzott US Small Cap Value strategy inception date is January 1, 1995.
Past performance does not guarantee future results. The performance data quoted represents past performance and current returns may be lower or higher. The investment return and principal value of an investment will fluctuate so that an investor’s shares, when redeemed, may be worth more or less than the original cost. To obtain performance information current to the most recent month end please visit www.bernzott.com or call (800) 856-2646. See last page for full GIPS compliant disclosure.
1Q Performance
The portfolio was virtually flat on a net basis (-0.06%), outpacing the R2000V’s decline of -0.7% but below the R2500V’s rise of +1.4%. Financials was the leading contributor to relative returns with positive stock selection in each of the sector's three industry groups.
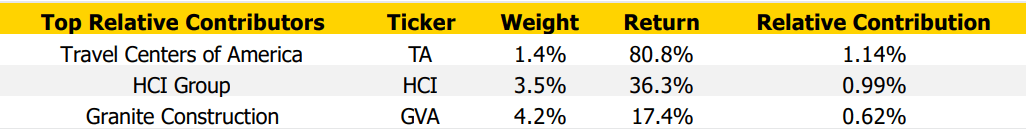
Property and casualty insurer HCI Group ( HCIIP ) rose 36.4% following a favorable earnings report which showed easing inflationary cost pressure, strong pricing, and effective management of its investment portfolio. The company stands to benefit from recent favorable regulatory changes in its core Florida market. Under allocation to banks also helped relative performance as banks were by far the worst performing industry. Consumer Discretionary contributed positively due to the 80.6% gain in TravelCenters of America (TA). We initiated the position early in the quarter, finding appeal in enhanced earnings power from internal management initiatives such as upgraded IT systems, better execution in the non-fuel part of the business, and franchising opportunities for capital-light expansion. The stock jumped in February when BP agreed to acquire the company for cash at a significant premium.
Health Care was the leading detractor from relative returns. Halozyme Therapeutics ( HALO ) fell 32.9% for the quarter. The decline started when it delivered its initial 2023 profit outlook which was modestly below expectations despite pointing to solid revenue and earnings growth. Later, news came that a partner drug suffered a patent setback in Europe on one of several patents. In response, the company reaffirmed its 2023 financial targets and indicated no expected change from royalties from the partner drug through 2030.
Information Technology also detracted from relative performance. The only holding in the sector, Adtran ( ADTN ), fell 15.1% as cautious 1Q stock price. The company continues to work through supply chain challenges which are expected to ease this year.
Granite Construction (GVA): The company posted another solid quarter, and the outlook continues to be promising, with potential contracts from the Infrastructure Investments & Jobs Act (IIJA) still ahead of it. Project execution, helped by the pursuit of smaller contracts, is supporting margins. We are encouraged by management's renewed focus on cash flow and capital efficiency, relatively new components of incentive compensation.
Air Transport Services Group (ATSG): The stock declined in response to modestly lowered anticipated 2023 flying hours combined with a stepped-up capital spending program in 2023 and 2024 which hurts free cash flow at the expense of long-term growth. The company is expanding its fleet of air freighters to meet long-term demand. Its strong balance sheet with relatively low leverage can support this growth. The decline left the stock trading below historical valuations.
Texas Capital Bancshares (TCBI): The stock was caught up in the bank stock downdraft. Texas Capital has strong capital ratios and liquidity, as well as below average exposure to CRE, an area of growing concern and scrutiny among investors. The bank continues to be run by Rob Holmes, former head of Consumer banking at JPMorgan Chase, and remains well positioned for long term success while trading at a price to tangible book multiple only seen during the Great Financial Crisis in 2009 and the depths of the pandemic in 2020.
1Q23 Performance
Portfolio Activity, 1Q23: Bought: Hillman Solutions (HLMN), Patterson-UTI Energy (PTEN), TravelCenters of America ( TA ) Sold: BrightView (BV), Stericycle (SRCL), WillScot Mobile Mini ( WSC ).
New Positions:
Hillman Solutions: A leading North American provider of hardware products and solutions with long standing strategic partnerships with retailers such as Home Depot, Lowes, Walmart, Tractor Supply and ACE Hardware. Superior brand positioning and distribution capabilities augmented by new product introductions and M&A should continue to drive repeatable and consistent earnings and free cash flow generation going forward. We expect management to use the strong cash flow generation to reduce Balance Sheet leverage which should lead to higher valuation multiples.
Patterson-UTI Energy: PTEN is a leading supplier of contract land drilling and pressure pumping services primarily in the United States. Their portfolio of high-spec rigs should garner superior day rates driving robust return of capital in the form of dividends and share repurchases. The disciplined nature of capital deployment overall in the industry should keep market conditions very favorable for the foreseeable future.
Sold Investments:
BrightView: Exited the position as the company continued to struggle with inflationary and labor pressures with pricing offsets too slow to materialize.
Stericycle : Sold the position due to free cash flow below expectations.
WillScot Mobile Mini: Exited the position as a result of the company exceeding the upper end of our market cap restrictions due to stock appreciation.
Bernzott Capital Advisors Update:
We ended 1Q managing $548 million, with $286 million in our US Small Cap Value strategy. As a bottom-up, fundamental value investor, we seek high quality companies we believe can compound returns over long periods while proving resilient in downturns. We believe characteristics of a high-quality company include market leadership? recurring revenue or subscription model providing revenue visibility? high margins and operating leverage? high returns on capital? financial flexibility? and a strong management team with skin in the game and a long-term view.
The statements contained herein are solely based upon the opinions of Bernzott Capital Advisors and the data available at the time of the publication of this report, and there is no assurance that any predicted results will actually occur. A full list of holdings is available upon request.
Explanation of Equity Performance
Performance Footnote Disclosure
Bernzott Capital Advisors claims compliance with the Global Investment Performance Standards (GIPS ® ) and has prepared and presented this report in compliance with the GIPS standards. Bernzott Capital Advisors has been independently verified for the periods of Jan. 1, 1995 through December 31, 2019. Verification assesses whether the firm has complied with all the composite construction requirements of the GIPS standards on a firm-wide basis and the firm’s policies and procedures are designed to calculate and present performance in compliance with the GIPS standards. The US Small Cap Value composite has been examined for the periods of Jan. 1, 1995 through December 31, 2019.
The verification and performance examination reports are available upon request.
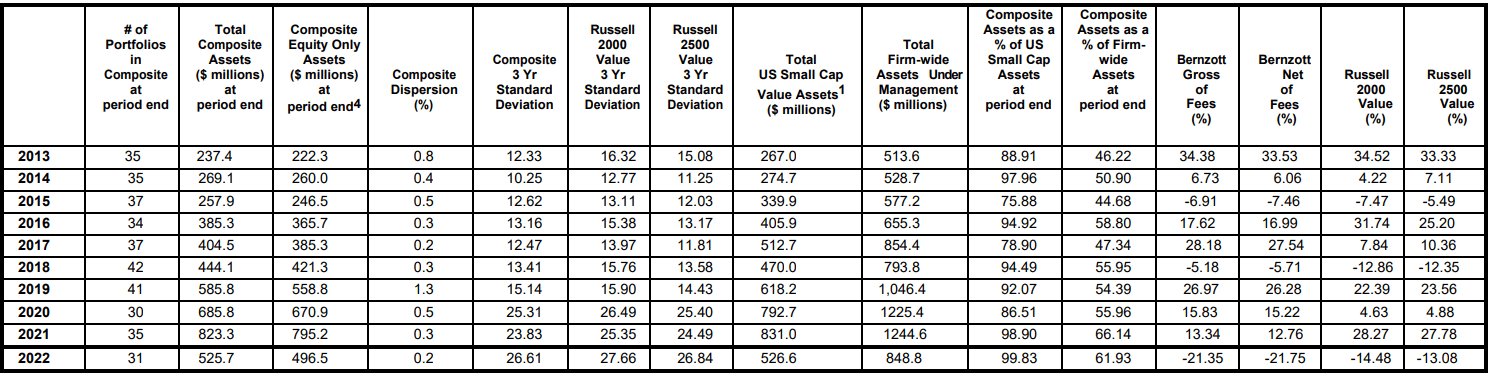
Equity product inception: January 1, 1995. 1The difference between this column and the “total composite assets at period end” is the accounts that do not meet the size parameter for the composite and any new account under management that has not met the waiting period to join the composite.2 Presented composite performance prior to October 1, 2006 is based upon equity only returns including allocated cash. Composite performance following October 1, 2006 is based on total account returns. * - To accommodate the needs of our high net worth non- institutional clients, Bernzott Capital Advisors has and will purchase equities across the capitalization spectrum, and not limit those purchases to the small cap universe. Effective October 1, 2010, the composite was redefined to only include those clients with a specific small cap mandate. This redefinition and client accommodation has resulted in a decline of AUM in the US Small Cap Value composite without impacting firm wide AUM.
GIPS Compliance Requirements:
Bernzott Capital Advisors is an equity portfolio investment manager that invests in U.S.-based securities. Bernzott Capital Advisors is defined as an independent investment management firm that is not affiliated with any organization.
The US Small Cap Value Composite includes all fully discretionary portfolios that invest in small capitalization U.S. stocks that are considered to have risk-adjusted returns purchased, at reasonable prices. The composite includes concentrated portfolios of market leading companies with consistent operating performance, significant recurring revenue, solid operating margin, moderate leverage and strong returns on capital. A size parameter of $250,000 is applied for composite membership. As of October 1, 2006, composite asset performance is derived from total account performance and eligible accounts are added to the composite after accounts are under management for two complete quarters. Prior to October 1, 2006, the composite was constructed from fully discretionary small cap equity only portfolios and fully discretionary small cap equity segment carve outs of accounts included in the firm composite. Prior to October 1, 2006, accounts were included in the composite their first full quarter under management. The benchmark is the Russell 2000 Value Index (taken from published sources). The Russell 2500 Value Index is provided as a secondary benchmark.
Russell 2000 Value Index measures the performance of those Russell 2000 companies with lower price-to-book ratios and lower forecasted growth values. .The Russell 2000 index is an index measuring the performance of approximately 2,000 smallest-cap American companies in the Russell 3000 Index, which is made up of 3,000 of the largest U.S. stocks. It is a market-cap weighted index. The Russell 2500 Value Index measures the performance of the small to mid-cap value segment of the US equity universe. It includes those Russell 2500™ companies that are considered more value oriented relative to the overall market as defined by Russell’s leading style methodology.
Gross-of-Fees returns reflect only the deduction of trading costs. Net performance returns reflect the deduction from gross performance of all trading costs, actual management fees and embedded fees. Since January 1, 2005 non-fee-paying accounts represent <1% of the composite assets. For the period Jan. 1, 2004 through Dec. 31, 2004 non-fee-paying accounts represent 1% of the composite assets. For the period Jan. 1, 1998 through Dec. 31, 2003 non-fee-paying accounts represent 2% of the composite assets. Bernzott performance is stated in US dollars. Prior to 10/1/06 the annual composite dispersion was an asset-weighted standard deviation calculation for the equity only portion of the account in the composite for the entire year and calculations did not take into account the effect of cash. Following that date, the annual composite dispersion is an asset-weighted standard deviation calculation using total account returns. 1995 and 1996 dispersion values are presented as n/a since five or fewer accounts are in the composite for the entire annual periods presented. Returns are presented gross and net of management fees and include the reinvestment of all income.
For institutional client accounts in the US Small Cap Value strategy, the management fee schedule is as follows: 0.90% on the first $10 Million; 0.80% on the next $15 Million; 0.75% on the next $25 Million and 0.65% on the balance. For private client accounts, the management fee schedule is as follows: 1% on the first $2 Million; 0.75% on the next $3 Million; 0.50% on the balance.
Special circumstances unique to a specific client may result in the negotiation of fees different than those set forth herein. We generally aggregate separate accounts of a single relationship for billing purposes. We may serve certain non-profits qualified under Section 501(c)3 IRC at a discount and we waive fees for employees and related parties.
Bernzott’s composite was created July 1,1999 and composite membership parameters were revised December 1, 2006 effective October 1, 2006. A complete list of Bernzott’s composites is available upon request. The policies of valuing portfolios, calculating performance and preparing compliant presentations are available upon request. Bernzott does not utilize leverage, derivatives or short positions. Bernzott does not have any significant company events to disclose. A size parameter of $250,000 is applied for composite membership. The minimum account size was implemented January 1, 2001. As of October 1, 2006, composite asset performance is derived from total account performance. Prior to October 1, 2006, the composite was constructed from fully discretionary small cap equity only portfolios and fully discretionary small cap equity segment carve outs of accounts included in the firm composite. Prior to January 1, 2004, the composite was known as the Small/Mid Cap Domestic Equity Composite. There was no change in the investment process as a result of the composite name change. Prior to October 1, 2006, carve-out portfolio segments were included in this composite and cash was allocated to the composite on a set percentage of 5%. As of October 1, 2006, portfolio segments are not included in this composite and all cash and cash equivalents are included in performance. An account will be removed from the composite membership if a cash outflow reduces the account value below the minimum size parameter. Additional information regarding the treatment of significant cash flows is available upon request.
Past performance is not indicative of future results. The statements contained herein are solely based upon the opinions of Bernzott Capital Advisors and the data available at the time of publication of this report, and there is no assurance that any predicted results will actually occur. This material is not investment advice. Not every client’s account will have these exact characteristics. The actual characteristics with respect to any particular client account will vary based on a number of factors including but not limited to: (i) the size of the account; (ii) investment restrictions applicable to the account, if any; and (iii) market exigencies at the time of the investment. Bernzott reserves the right to modify its current investment strategies and techniques based on changing market dynamics or client needs. The information provided in this report should not be considered a recommendation to purchase or sell any particular security. It should not be assumed that any of the composite characteristics discussed were or will prove to be profitable, or that the investment recommendations or decisions we make in the future will be profitable.
Prior to April 2013, Schmetter & Associates, LLC. (S&A) served as an independent institutional sales and marketing representative for Bernzott Capital Advisors. S&A continues to receive 20-25% of collected revenue from specified institutional clients. S&A is not a broker/dealer. BCA currently employs two business development professionals. This professionals receive a % of collected revenue from specified institutional clients. All fees paid by Bernzott Capital are in hard dollars. No additional amount is ever billed to any client as a result of such payments.
Bernzott Capital Advisors is a registered investment adviser, registered with the SEC. Registration does not imply a certain level of skill or training. More information about the adviser, including the investment strategies, fees and objectives are more fully described in the firm’s Form ADV Part 2, which is available upon request by calling (800) 856-2646, or can be found by visiting www.bernzott.com .
Editor's Note: The summary bullets for this article were chosen by Seeking Alpha editors.
For further details see:
Bernzott Capital Advisors US Small Cap Value Fund Q1 2023 Commentary