DFAS - Better Start To 2023 Has Investors Calling Bottom
Summary
- After a challenging 2022, financial markets are starting 2023 with a strong rally.
- The U.S. stock market is testing important price levels that many investors are watching closely.
- While anything is possible in the near term, the sustainability of market moves is what should matter to longer-term investors.
A year to remember
Happy 2023 and good riddance to 2022; it was a memorable year that many investors would rather forget. In the U.S., the S&P 500 index was down over -19% and the NASDAQ 100 was down by more than -33%, represented below as the SPDR S&P 500 ETF ( SPY ) and the Invesco QQQ Trust ( QQQ ), respectively.
Figure 1: SPY & QQQ 2022 Price Performance
After a drawdown of about 26% in 2022, the S&P 500 is now up about 13% from its October lows. This rally has many investors hopeful the bear is behind us and the bull is rising again. Indeed, it will, eventually. But whether we see a sustained bull market from here is still up for debate.
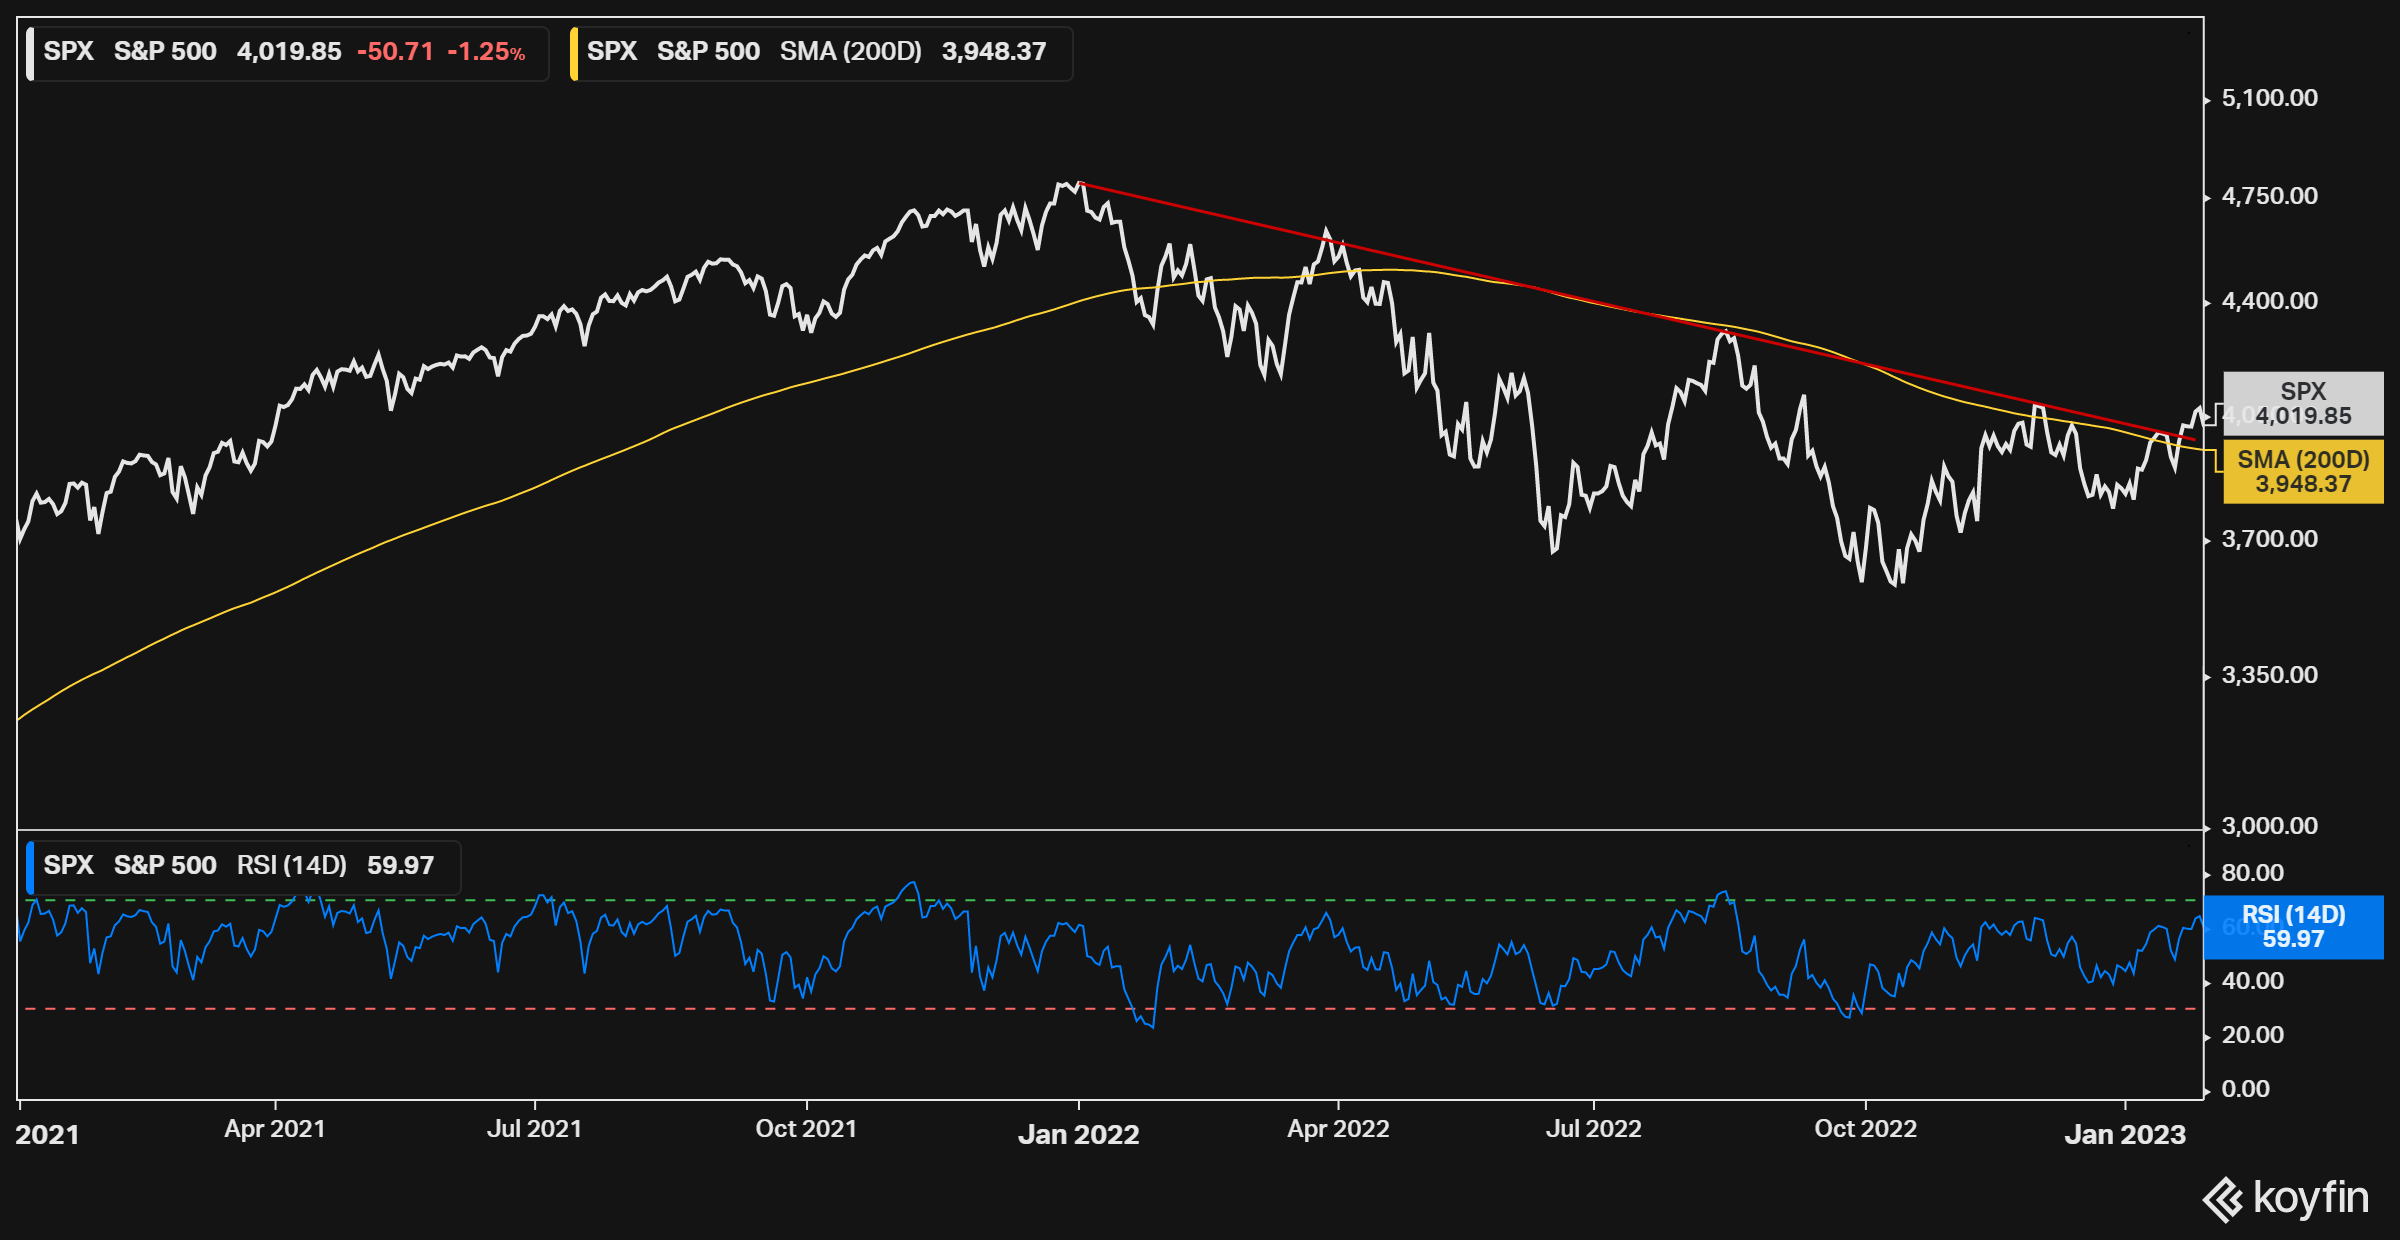
Crucial market levels
The S&P 500 is bouncing around a crucial level near 4,000 after registering a series of higher lows on improved momentum. The index is once again breaching the 200-day moving average and clawing over what is probably the most widely watched trend line in markets right now.
Figure 2: SPX Price Trends
Koyfin
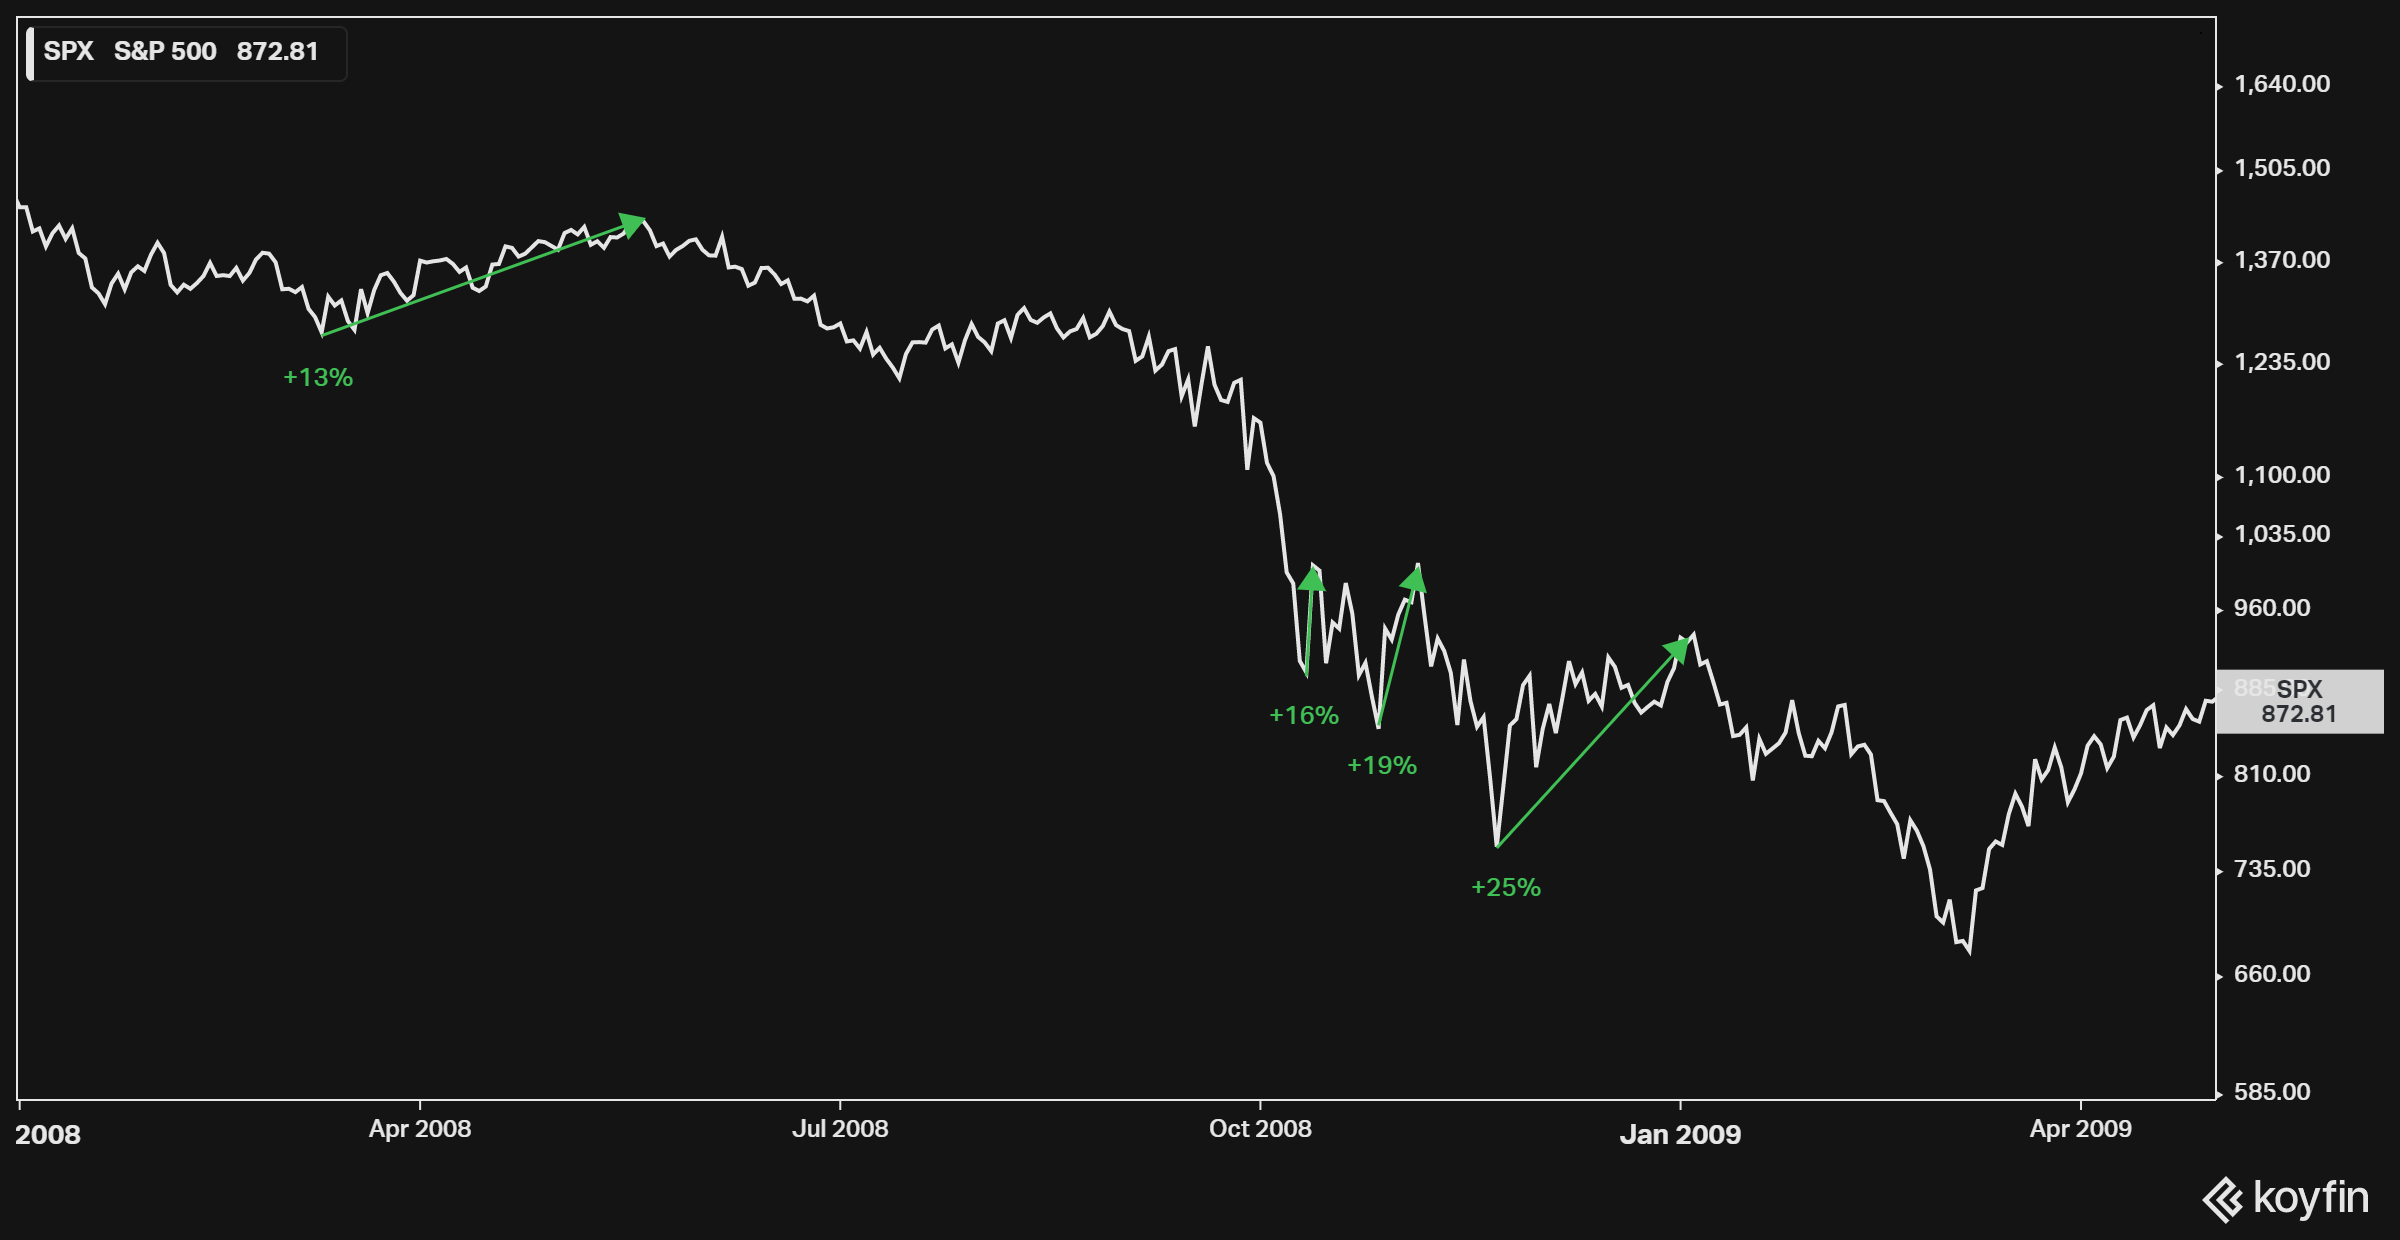
But, we have been here several times with failed rallies in April, August, and November of last year. Looking further back, it is worth noticing that rallies are common during bear markets (aka "bear traps").
For example, during the great financial crisis, the S&P 500 rallied by more than 10% four times between April 2008 and January 2009 (10 months). The largest was a +25% rally after which the market still lost almost another third of its value before finding a durable bottom.
Figure 3: SPX Dot-Com Bust Bear Traps
Koyfin
Bigger picture
Looking beyond the charts, rallies can start on technical strength but need fundamental support to sustain. Economic conditions can provide that kind of support, and a lack of it may be the biggest drag on markets ahead.
The Q4 U.S. GDP print of +2.9% was positive, but down from Q3, and is also a coincident indicator. Leading economic indicators like interest rates, corporate profits, and cyclical sector activity are more forward-looking.
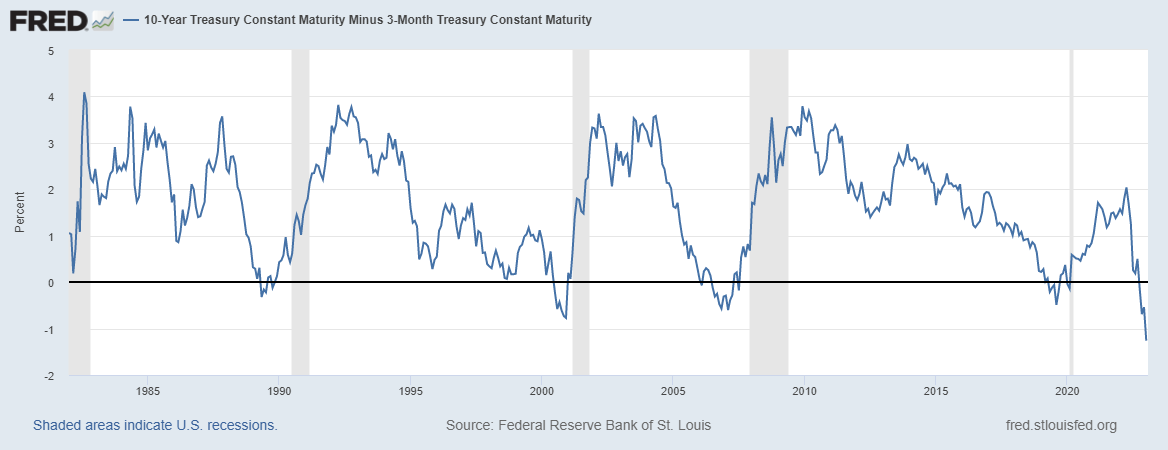
I wrote last year that a growing list of leading indicators suggests a recession remains likely . For example, one of the most reliable and well-known recession indicators is the Treasury yield curve or the difference between interest rates on 10-year Treasury notes and 3-month Treasury bills.
Over the past six decades, every time the 3-month rate rose above the 10-year rate (aka "yield curve inversion") the U.S. has fallen into recession. Yield curve inversions are not only uncommon and abnormal but also cause real-world economic disruptions because interest rates are crucial inputs to everything from investment decisions to asset valuation.
The chart below shows the yield curve (blue line) is more deeply inverted (below the black zero line) than prior to the great financial crisis or the dot-com bubble (grey bars are recessions).
Figure 4: Treasury Yield Curve
Federal Reserve
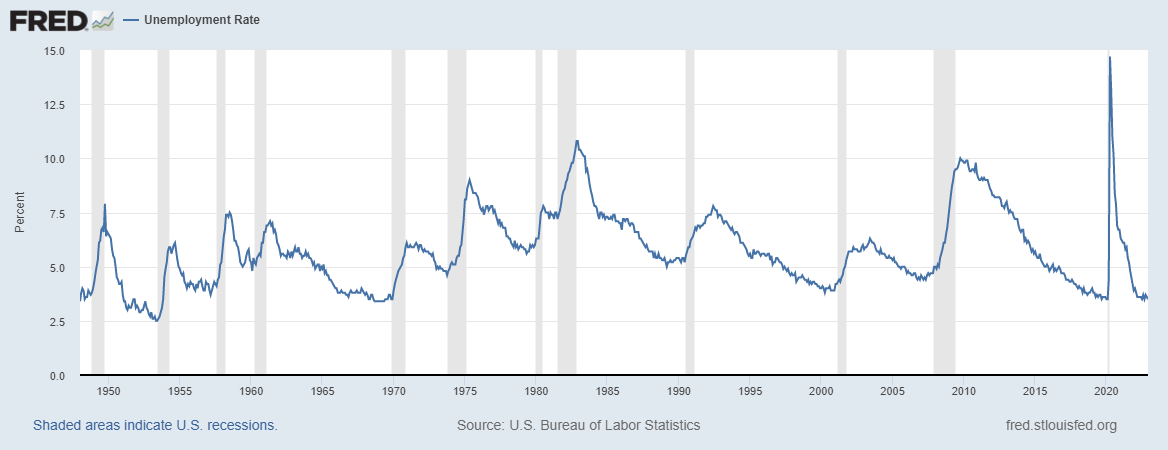
The strongest case against recession is employment. Most people who want to work have a job and the official unemployment rate continues near five-decade lows. However, low unemployment today is a weak argument for no recession tomorrow.
The reality is the unemployment rate is always low before recessions begin . The chart below shows the unemployment rate (blue line) does not rise meaningfully until after recessions (grey bars) start.
Figure 5: U.S. Unemployment Rate
Federal Reserve
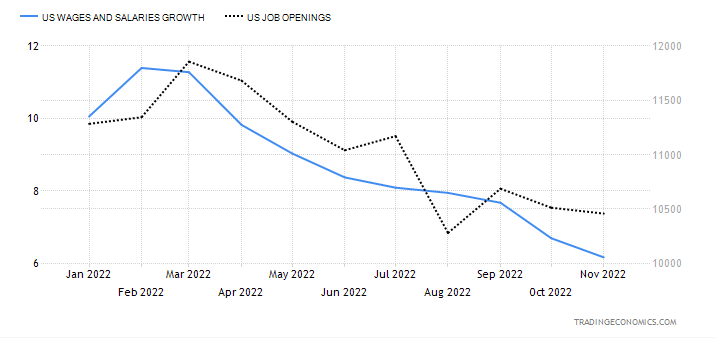
Meanwhile, cracks are forming on the employment pillar. Wage growth and job openings were declining for most of 2022 and may continue that downtrend as a growing number of companies announce layoffs . If employment breaks down, then recession becomes nearly certain and stocks are likely to see new lows ahead.
Figure 6: U.S. Wage & Job Opening Growth
TradingEconomics
Glass half full
Recession or not, investing is often a matter of perspective and we can always find reasons to be optimistic. First, since 1956 bear markets have lasted an average of 13 months.
Figure 7: S&P 500 Bear Markets
S&P Global, BCM
There is a range around that average, for example, the dot-com crash of 2000 dragged on for over two years. But all the other bear markets shown above ended within two years.
January 2023 markets month 13 of the current bear, right at the average. Based on that it is reasonable to expect this bear market could be at least halfway over (and yes, it is possible it could have already ended).
And even if a recession takes hold, there is still reason to be optimistic. Historically, bear markets start before recessions begin, but bears also bottom during recessions and before they end (shown below).
Figure 8: U.S. Stock Market & Recessions
Federal Reserve
In other words, if a recession starts, that could also mark the beginning of the end of the bear market in stocks. It all dovetails neatly in line with historical precedent.
For example, if a recession starts in the next twelve months with stocks bottoming shortly after, the bear market of 2022 would end up with a duration shorter than two years. After that should come a sustained bull market driven by economic recovery and expansion.
Also, none of this means we will not or cannot see markets rally prior to a recession. And actually, based on strengthening technical conditions, a continued rally seems more likely than not in the near term. That presents short-term traders with opportunities for profit, long and short.
Indeed, there are several reasons to see the glass as half full.
The iffy bottom line
There are also many "ifs" in this article. IF employment, IF recession, and IF market history is any guide. That reflects the reality that nobody can predict, with certainty, what happens next; certainly not me.
The best we can do is make educated guesses by objectively evaluating relevant data and information as they become available. Based on current economic data and the historical relationship between business and market cycles, it appears more likely than not that both a recession and a bear market bottom are still ahead.
Even IF everything happens as expected, it will not do so in a straight line. Short-term traders may find opportunity in the swings, but less active and longer-term investors may simply want to adjust their portfolios for what is eventually most likely.
Whatever you do, do your own homework, proceed with caution, and do what is best for your personal goals and circumstances. Do not just follow what a stranger writes on the internet, even IF that stranger seems believable and oddly dapper.
For further details see:
Better Start To 2023 Has Investors Calling Bottom