BGB - BGB: A Declining NAV Fund
Summary
- Blackstone Strategic Credit Fund aims to provide high current income from a portfolio of senior loans and high yield bonds.
- The closed-end fund has an annualized yield of 9.4%, using the latest monthly distribution rate.
- BGB's annual returns are highly correlated with the direction of credit spreads.
- BGB has a troubling trend of long-term NAV declines that is not consistent with the mean-reverting nature of credit spreads. This suggests something is fundamentally wrong with its investment process.
The Blackstone Strategic Credit Fund ( BGB ) aims to provide a high current yield from a portfolio of non-investment grade senior loans and bonds. The fund has historically been able to fund its generous distribution from net investment income. However, looking deeper, I see a troubling trend of realized and unrealized losses over the long run. This is indicative of the fund stretching for yield and making poor investment decisions. I would avoid the BGB fund.
Fund Overview
The Blackstone Strategic Credit Fund is a closed-end fund ("CEF") that seeks high current income from a portfolio of senior loans and other fixed income instruments.
The fund primarily invests in a diversified portfolio of first- and second-lien loans of mostly U.S. corporate issuers, as well as high yield ('junk') bonds of varying maturities.
The BGB fund has a limited term and will dissolve on September 15, 2027, unless shareholders vote to extend the term.
BGB has been popular with investors, garnering over $550 million in net assets. The fund charged a 2.78% gross expense ratio in fiscal 2021.
Portfolio Holdings
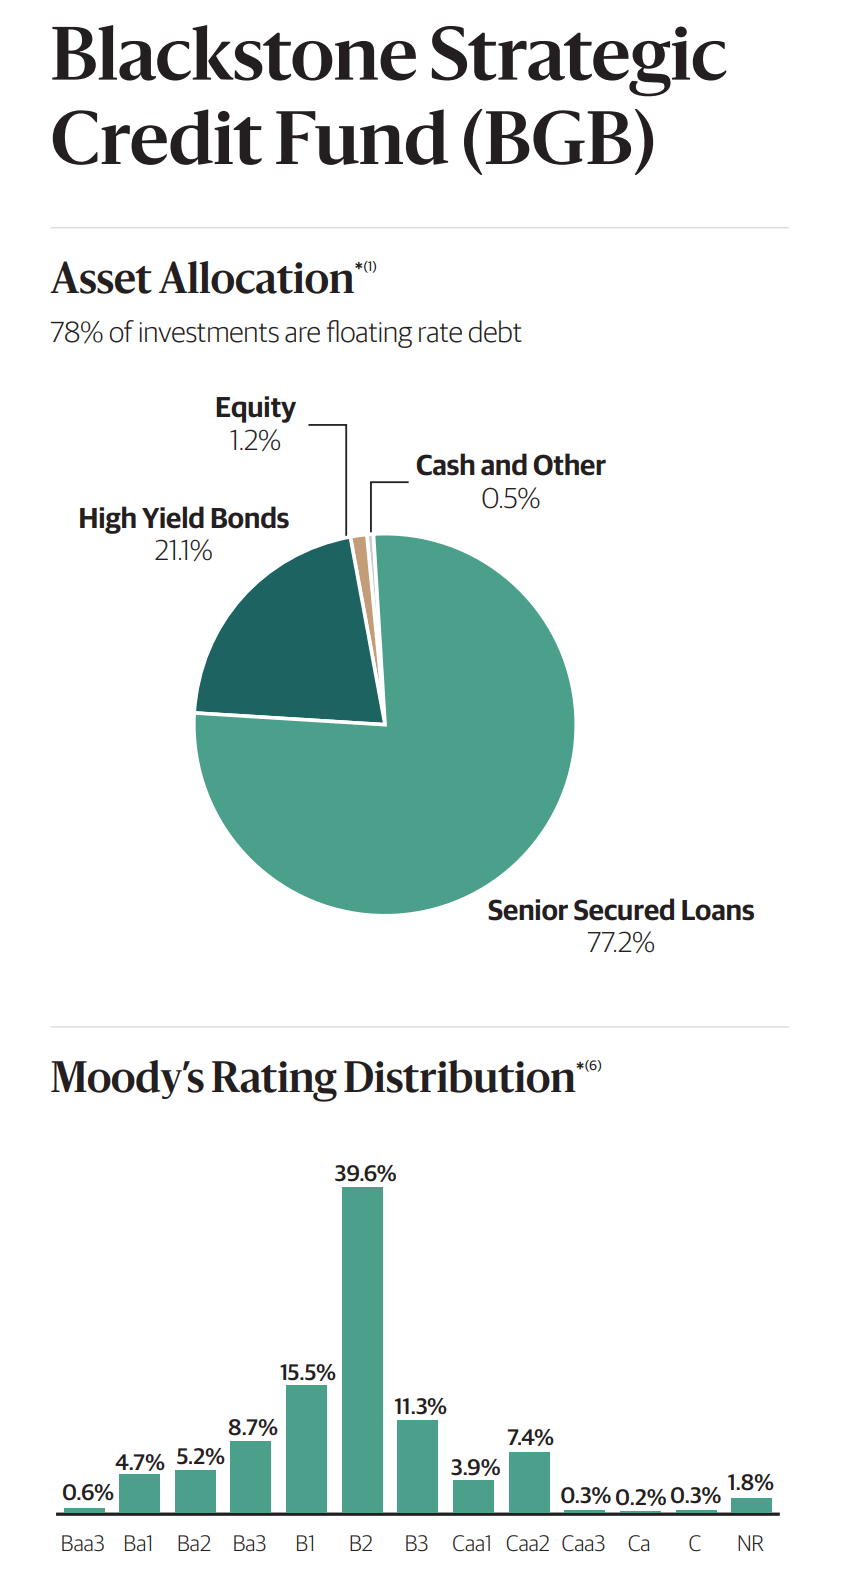
Figure 1 shows BGB's asset allocation and credit quality allocation as of November 30, 2022. The BGB fund has 77% of assets invested in senior secured loans and 21% invested in high yield bonds. The effective duration of BGB's portfolio is 1.1 years.
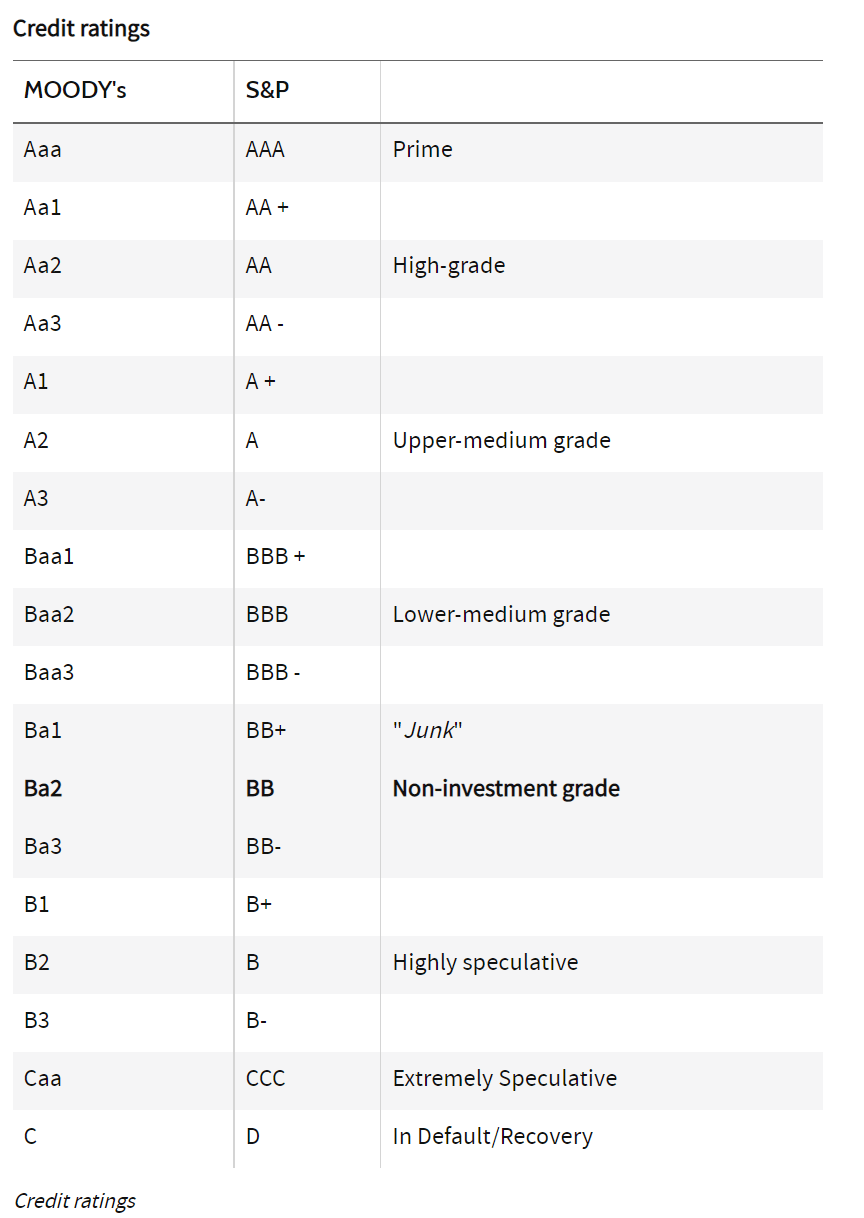
As designed, BGB's portfolio is mostly non-investment grade or lower. The vast majority of the portfolio is rated between Ba3 (equivalent to S&P and Fitch's BB-) to Caa (equivalent to CCC). Note, as defined by the credit rating agencies, B2 is considered "highly speculative" and Caa is considered "extremely speculative" (Figure 2).
Returns
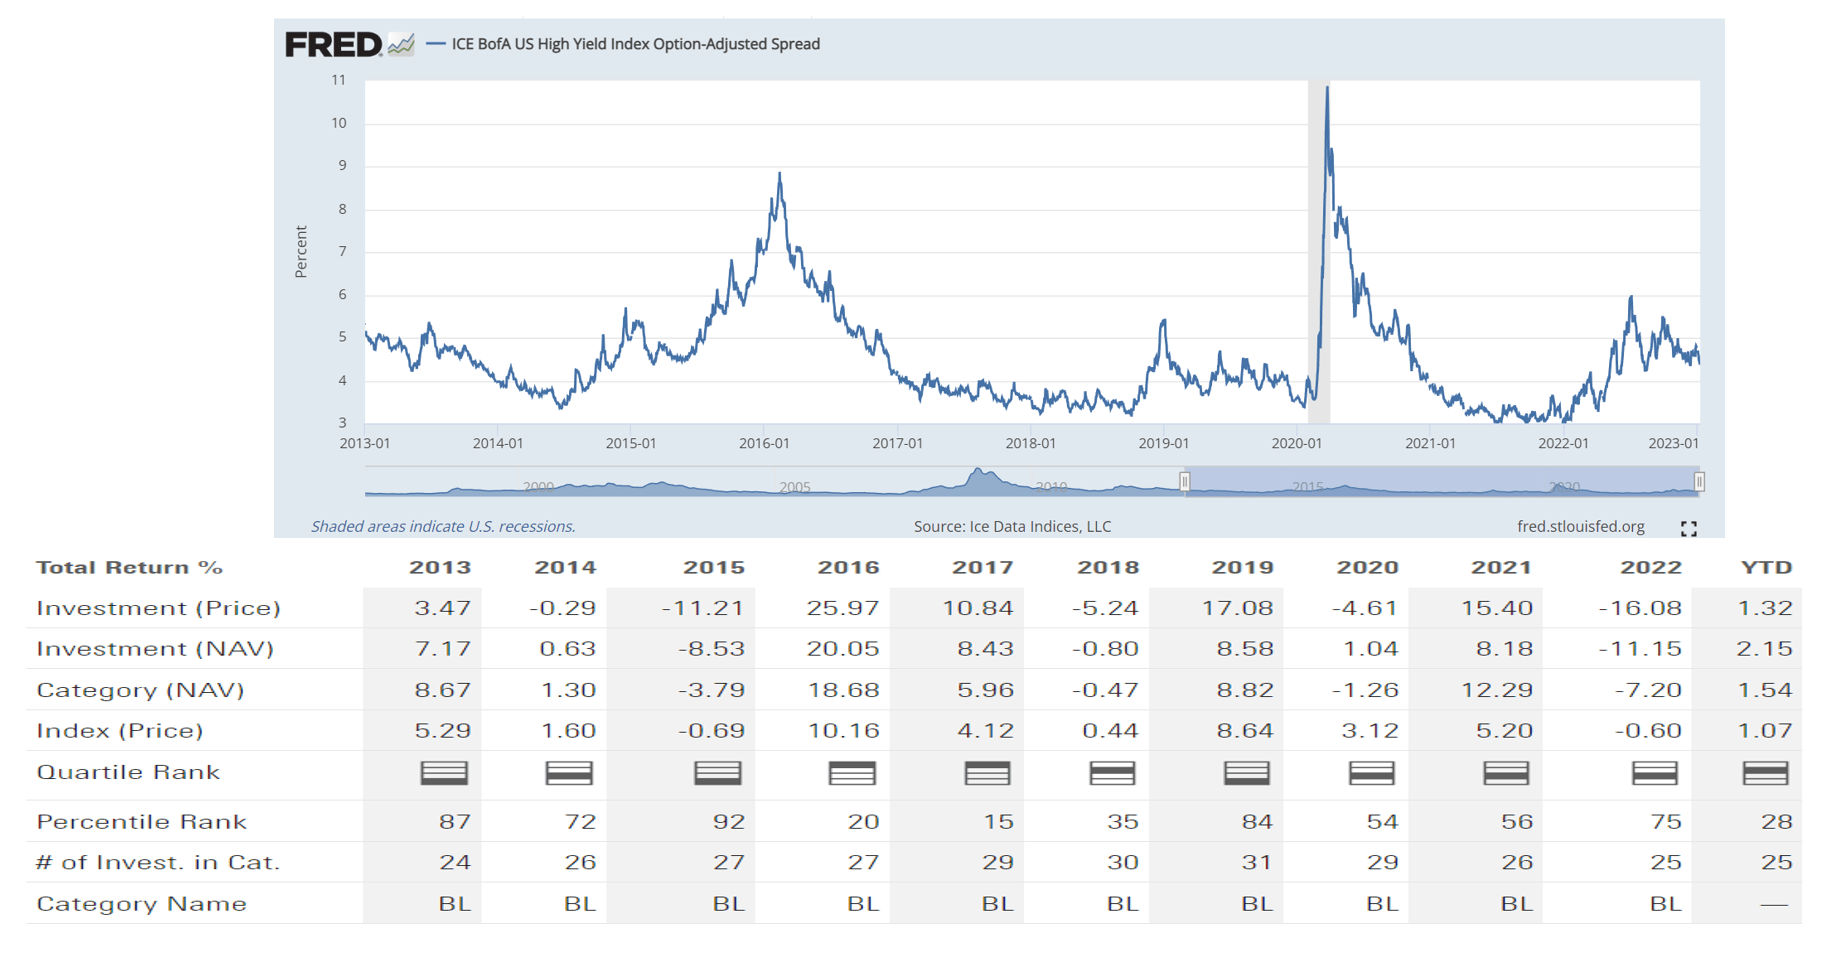
BGB's historical returns have been mediocre, with 3/5/10Yr average annual returns of -1.0%/0.9%/3.0%, respectively, to December 31, 2022 (Figure 3).
Figure 3 - BGB has mediocre average annual total returns (morningstar.com)
The biggest surprise is BGB's 2022 return of -11.2%. As almost 80% of BGB's portfolio is floating rate senior secured loans, with an overall portfolio duration of only 1.1 years, BGB should have been relatively immune to the interest rate increases that negatively affected bonds in 2022.
However, what happened was that credit spreads widened, especially for the extremely speculative Caa rated securities, where the ICE BofA CCC & Lower Option-Adjusted Spread widened from sub-7% at the end of 2021 to over 11% at the end of 2022. This placed pressure on BGB's portfolio, causing realized/unrealized losses (Figure 4).
Figure 4 - CCC credit spreads widened in 2022 (St. Louis Fed)
In fact, if we overlay the ICE BofA High Yield Option-Adjusted Spread on BGB's annual performance, a clear picture emerges. In years that credit spreads are tightening, BGB delivers positive total returns. In years when credit spreads are widening, BGB's total returns are negative (Figure 5).
Figure 5 - BGB is simply a credit spread bet (Author created with credit spread from St. Louis Fed and annual returns from morningstar.com)
In effect, BGB is really a bet on the direction of high-yield credit spreads. If one believes the Fed can avoid a hard landing in 2023 and credit spreads will tighten, then BGB can probably deliver positive returns.
Distribution & Yield
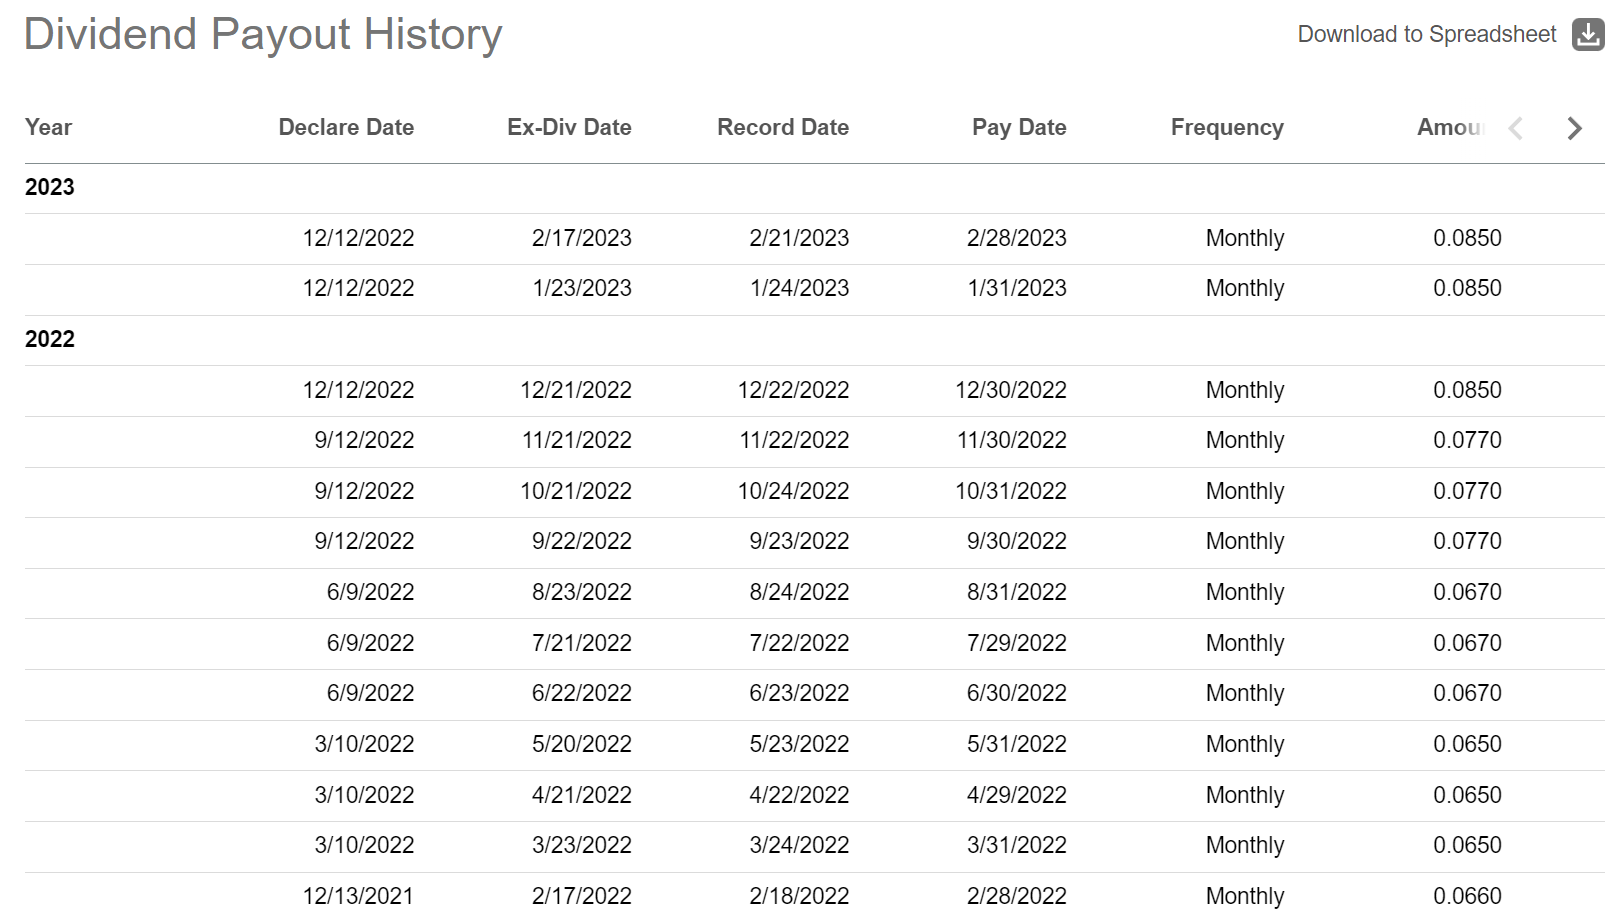
The main attraction of a fund like BGB is its high distribution yield. On this front, the BGB fund certainly delivers, with $0.78 / share in distributions in the trailing 12 months, or a 7.3% trailing yield. Based on the most recently announced monthly distribution of $0.085, payable December 2022 to February 2023, the yield annualizes to 9.4%.
BGB's distribution is based on the fund's net investment income ("NII") and is adjusted quarterly. As the fund earns more income, it pays a higher distribution. For example, when floating interest rates were lower at the beginning of 2022, BGB only paid a monthly distribution of $0.066. The monthly distributions have steadily increased in 2022 as the Federal Reserve increased short-term interest rates (Figure 6)
Figure 6 - BGB monthly distributions have increased with higher interest rates (Seeking Alpha)
Distribution Is Fully Funded, But...
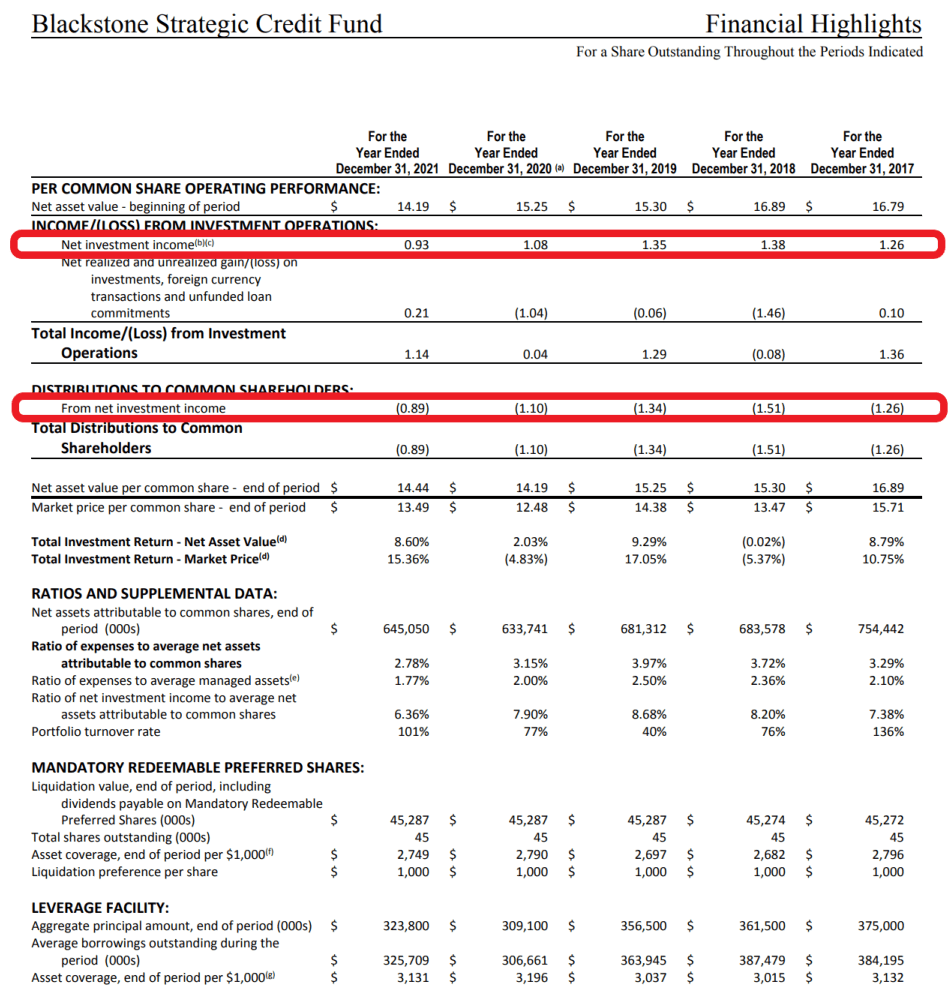
At first glance, BGB's distribution looks quite attractive, as it is "fully funded" by NII. For example, in figure 7, we can see that BGB's distribution tracks the fund's NII.
Figure 7 - BGB financial summary, 2017 to 2021 (BGB 2021 annual report)
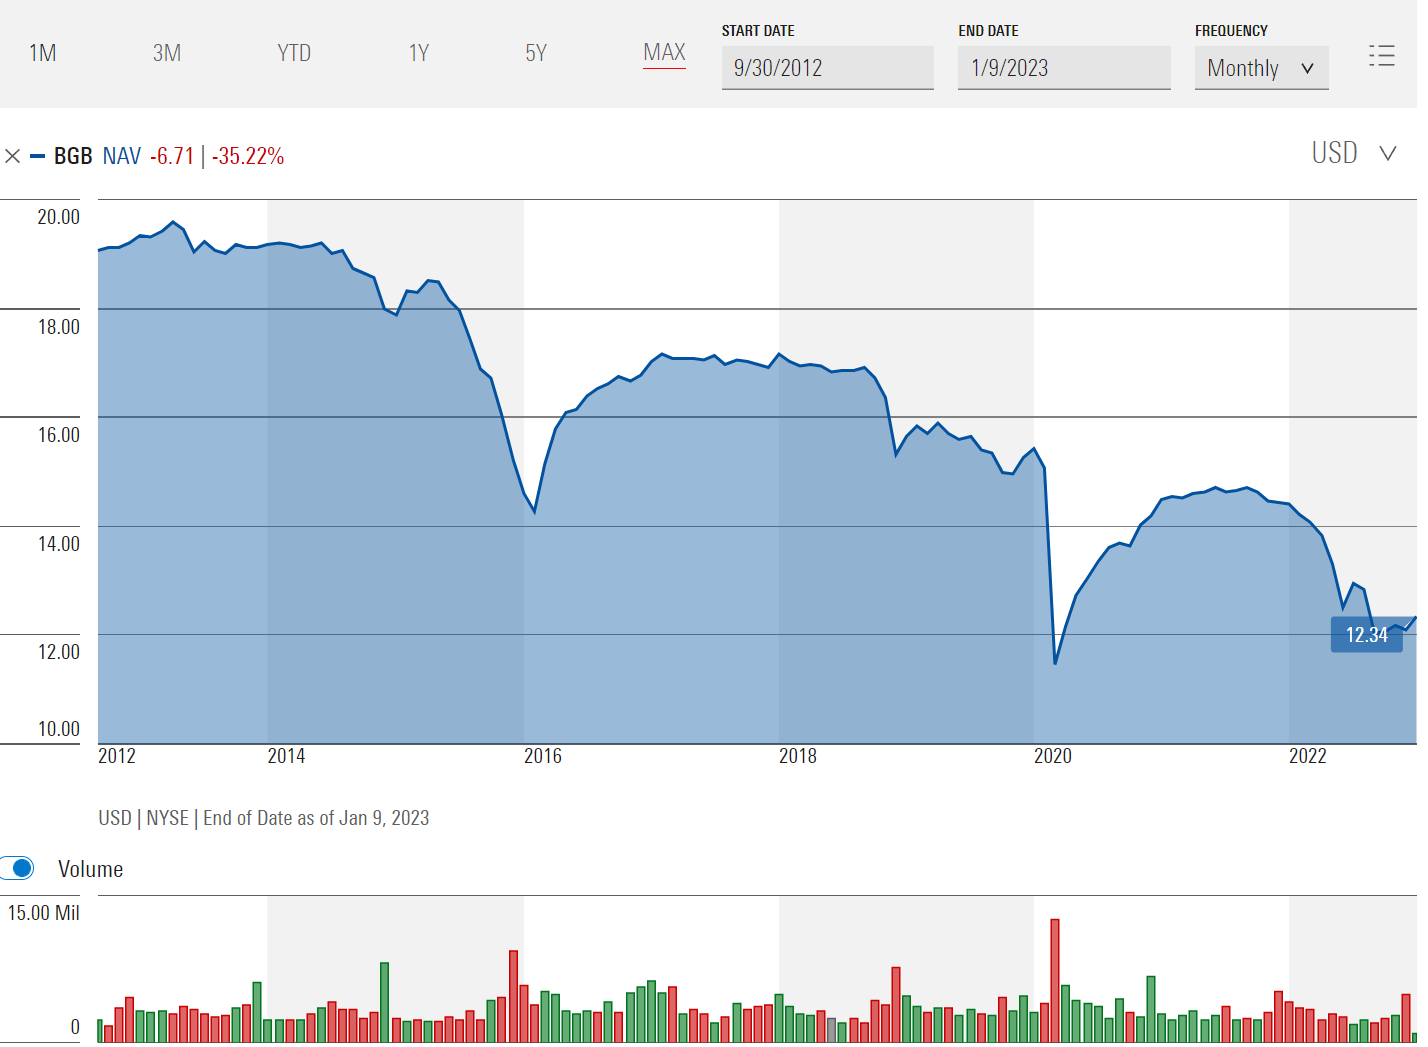
However, when looking at the fund's NAV performance, I cannot help but have a nagging feeling that something isn't right. From inception, BGB's NAV has declined from $19 to $12.34 currently (Figure 8).
Figure 8 - BGB's NAV has been in a declining trend since inception (morningstar.com)
...Something Doesn't Add Up
If BGB pay distributions out of NII, then long-term NAV declines should not occur, as credit spreads (and by extension, loan prices) tend to be a mean reverting series. For example, in Figure 5 above, we can see high yield spreads normally trade between 3 to 5%, and spike during recessions but tighten back during recoveries.
A portfolio of prudently selected loans may see short-term unrealized MTM declines during stress periods (and may experience a few defaults), but the portfolio should generally pay out at par if held to maturity. The fact that BGB's NAV show a long-term declining trend is highly unusual in that context. What could be going on?
Without being an insider at the fund, it is difficult to know exactly what is going on. However, from the fund's published annual reports, we can see that the BGB fund has shown poor long-term "investment performance," as measured by the realized and unrealized gains and losses per share. For example, in figure 7 above, we can see BGB has generated a cumulative loss of $2.61 / share in net realized and unrealized gains and losses between the years 2017 to 2021.
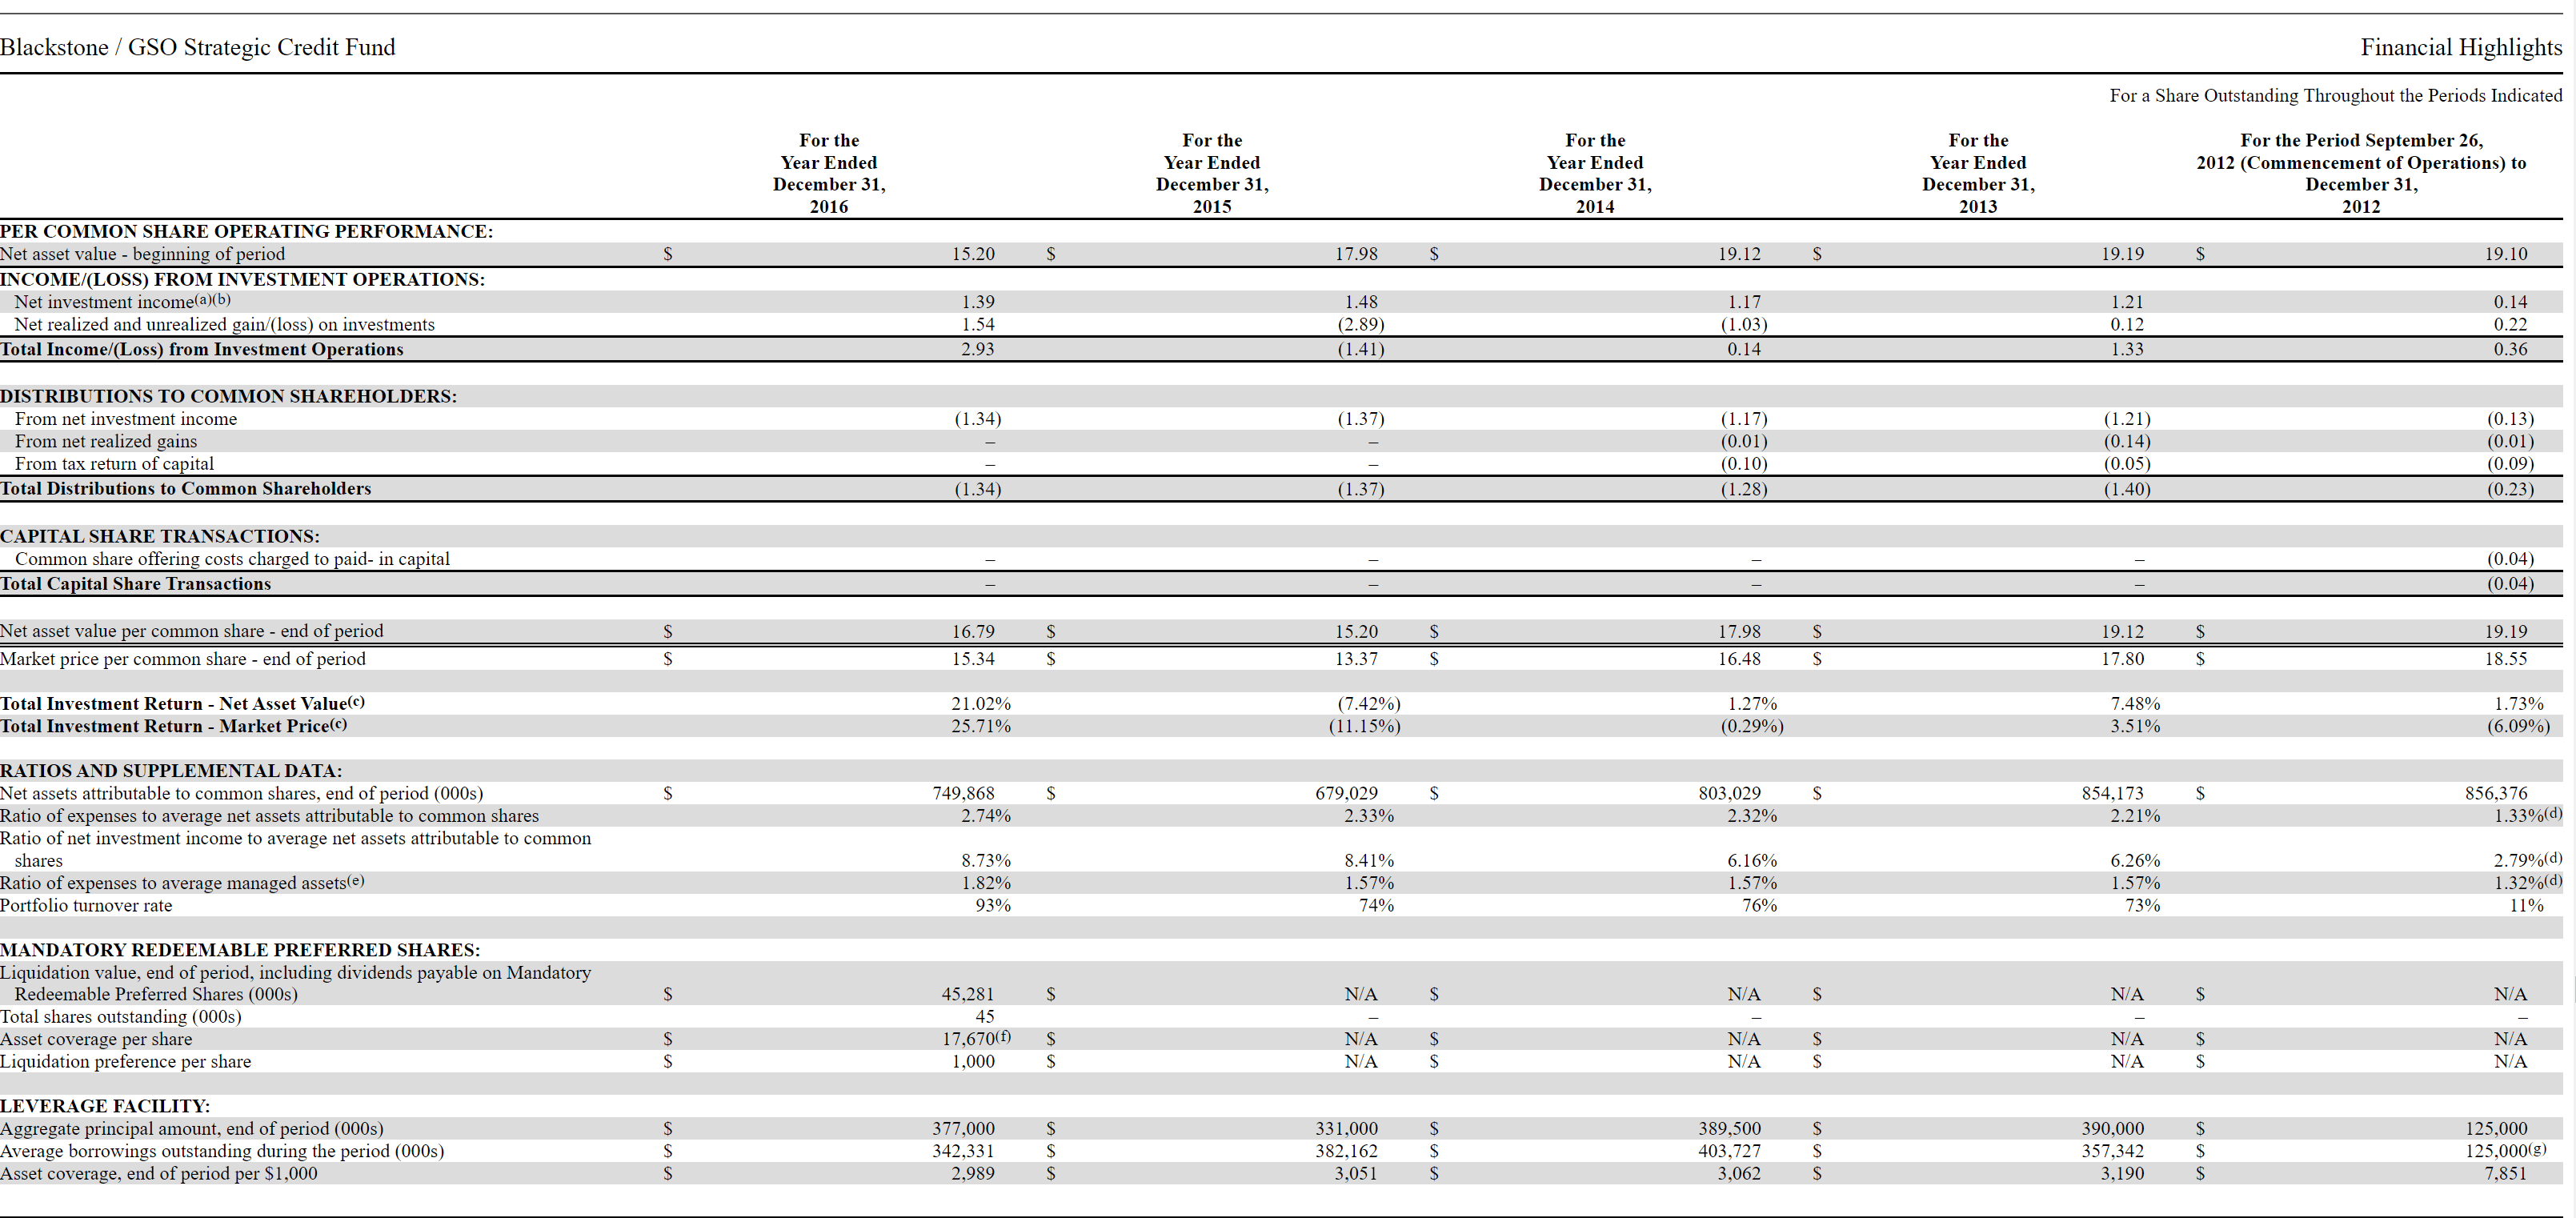
Similarly, between the years 2012 to 2016, the BGB fund (formerly called Blackstone / GSO Strategic Credit Fund) generated a cumulative loss of $2.04 / share in realized and unrealized losses (Figure 8).
Figure 8 - BGB financial summary 2012 to 2016 (BGB 2016 annual report)
So while BGB's portfolio did generate high net investment income, the investments used to generate those high yields were likely "extremely speculative" and led to a permanent loss of capital (if an unrealized loss hasn't been recovered in 5 years, it's probably a safe bet to say it has become a permanent loss).
Portfolio Stretching For Yield Gets Burned
We can see some of BGB's risky investments in real time. For example, looking at the fund's top 10 holdings, we see the 4th largest holding is first lien loans to AMC Entertainment Holdings, Inc. ( AMC ), the troubled theater operator that is considered "distressed" by S&P , and may be at risk of bankruptcy (Figure 9).
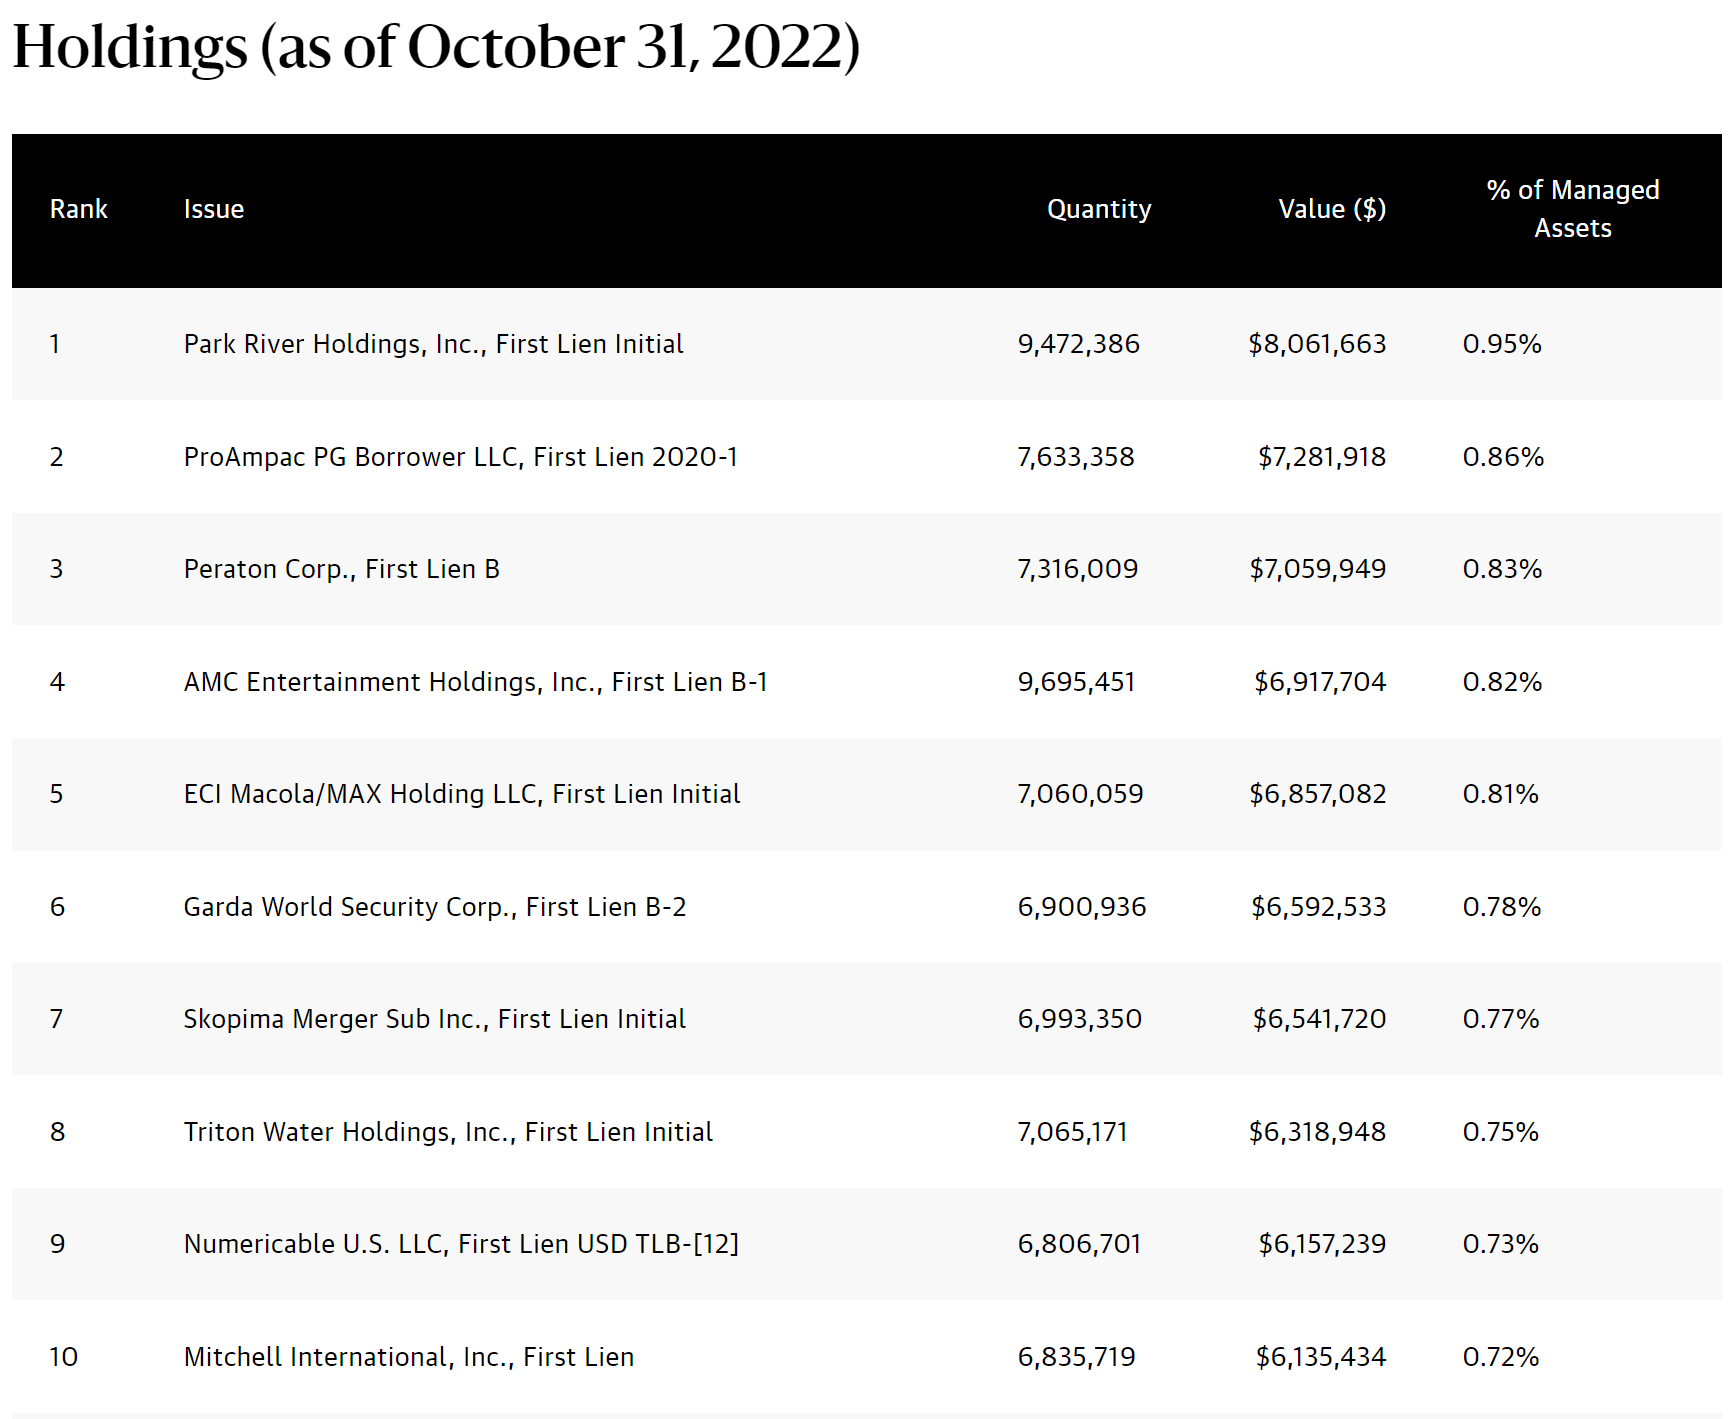
While investing in distressed loans can lead to high yields, it can also lead to investors getting burned when the issuer falls into financial distress. For BGB, judging by its poor historical investment performance (10 year cumulative net realized and unrealized losses of $4.65 / share from 2012 to 2021), the fund has been burned more often than not.
Conclusion
The Blackstone Strategic Credit Fund aims to provide a high current yield from a portfolio of non-investment grade senior loans and bonds. The fund has historically been able to fund its generous distributions from net investment income. However, if investors look at Blackstone Strategic Credit Fund's historical realized and unrealized gains, we can see a troubling trend of losses. This suggests Blackstone Strategic Credit Fund may have been making bad investment decisions in a stretch for yield.
For further details see:
BGB: A Declining NAV Fund