BIZD - BIZD: Portfolio Approach To BDC Investing
Summary
- The BIZD ETF tracks the performance of publicly traded business development companies.
- It has an 11.2% annualized distribution yield.
- Historically, BIZD has performed very well after credit spreads have widened due to economic turmoil. Investors should be patient and wait for such an opportunity in the coming year.
The VanEck BDC Income ETF ( BIZD ) uses a portfolio approach to invest in high yielding business development companies. While BIZD's quarterly distribution looks attractive, currently yielding 11.2% on an annualized basis, investors should note that historically, the BIZD ETF only performs well after a period of significant economic turmoil (2016, 2019, 2021). Given we are heading into a recessionary environment in 2023, investors should be patient and invest in BIZD only after high yield credit spreads have blown out and peaked.
Fund Overview
The VanEck BDC Income ETF provides exposure to the performance of U.S. business development companies ("BDC"). The ETF has over $500 million in assets.
Strategy
The BIZD ETF tracks the MVIS US Business Development Companies Index ("Index"), an index designed to measure the overall performance of publicly traded business development companies.
BDCs typically invest in small- and medium-sized companies via loans or equity investments, although they may also invest in distressed companies as well. BDCs are regulated investment companies ("RIC") and must distribute over 90% of their profits to shareholders in order to maintain their corporate tax exemption status. Like close-end funds ("CEF"), many BDCs pay above average distribution yields due to their structure and to attract investors.
The BIZD ETF is conceptually similar to the Invesco CEF Income Composite Portfolio ETF ( PCEF ) that I recently reviewed , except PCEF holds a basket of CEFs while BIZD holds a basket of BDCs.
Portfolio Holdings
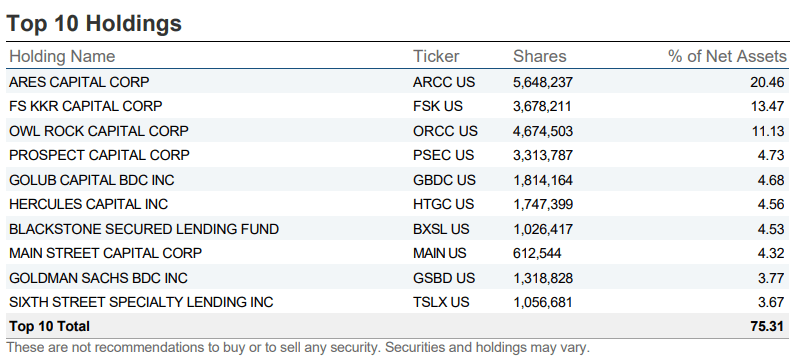
Figure 1 shows BIZD's top 10 holdings which account for 75% of the portfolio. In total, BIZD's portfolio has 25 holdings.
Figure 1 - BIZD top 10 positions (vaneck.com)
Ares Capital Corp. ( ARCC ) is the largest holding in BIZD. ARCC is the largest BDC in the markets with close to $10 billion in market cap supporting $21 billion in investments. ARCC invests in first and second lien loans, mezzanine debt and equity in middle-market companies across diverse industries.
Returns
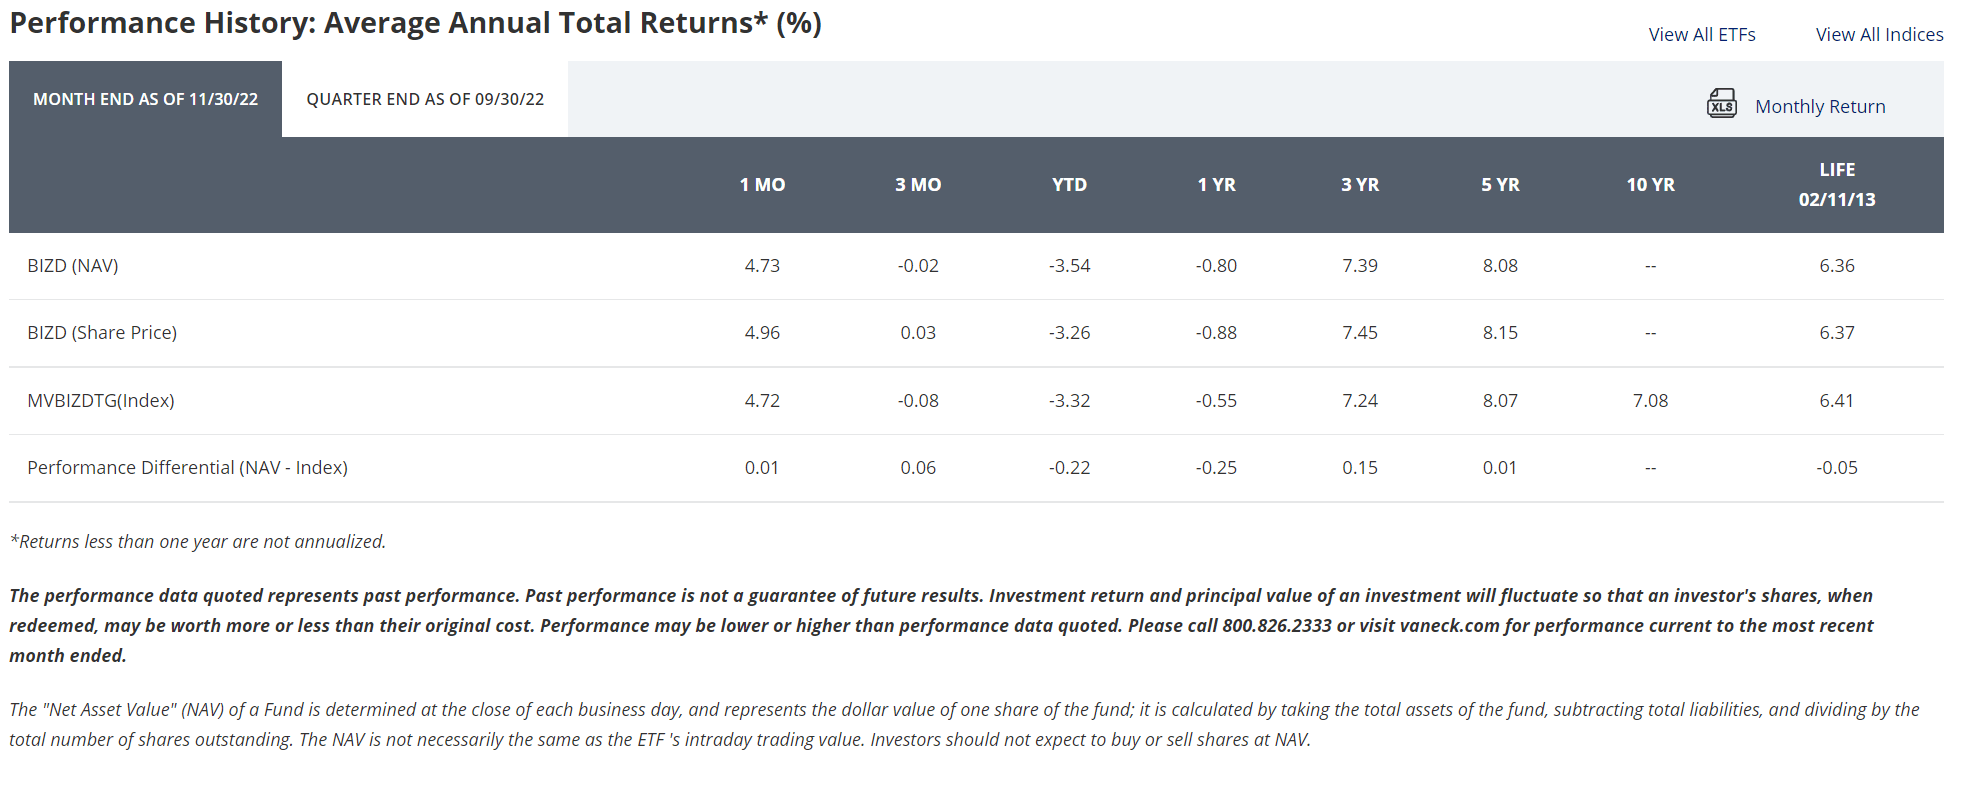
BIZD's portfolio approach has allowed it to produce modest historical returns, with 3Yr and 5Yr average annual returns of 7.4% and 8.1% respectively, to November 30, 2022 (Figure 2). While performance has been negative in 2022, with YTD returns of -3.5%, it has notably outperformed general equity and bond markets.
Figure 2 - BIZD historical returns (vaneck.com)
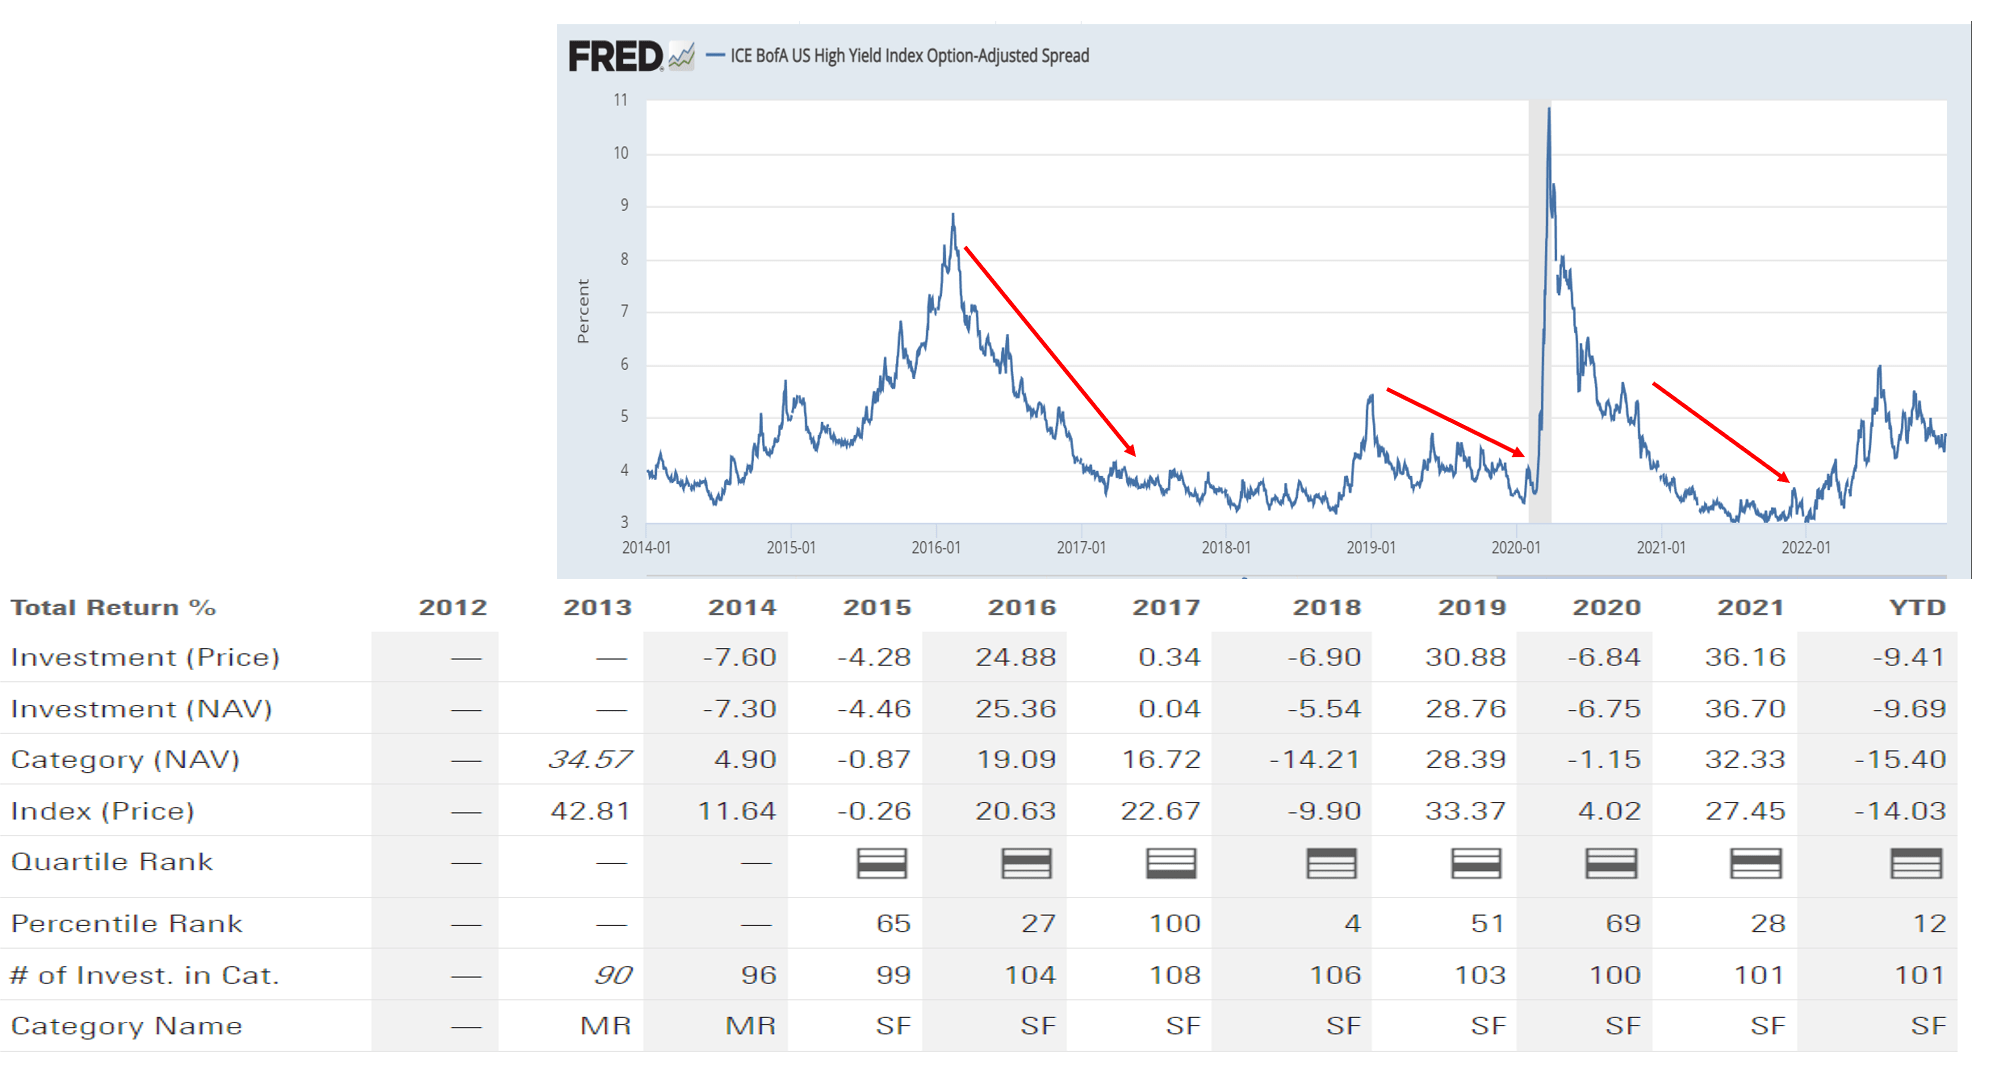
However, on an annual basis, BIZD's performance has been quite volatile. The fund had strong returns in 2016, 2019, and 2021, and poor performance in the other years (Figure 3).
Figure 3 - BIZD annual returns vs. high yield credit spreads (Author created with returns from Morningstar and high yield spreads from St. Louis Fed)
Lining up BIZD's annual returns to important macro drivers, it appears BIZD needs a significant tailwind from declining credit spreads, as shown by the ICE BofA U.S. High Yield Index OAS in the figure above, in order to deliver strong returns.
Given the expectation that the credit cycle is set to worsen into 2023 as the economy feels the lagged effects of the Fed's 2022 interest rate hikes, the outlook for BIZD's short-term performance is poor.
Distribution & Yield
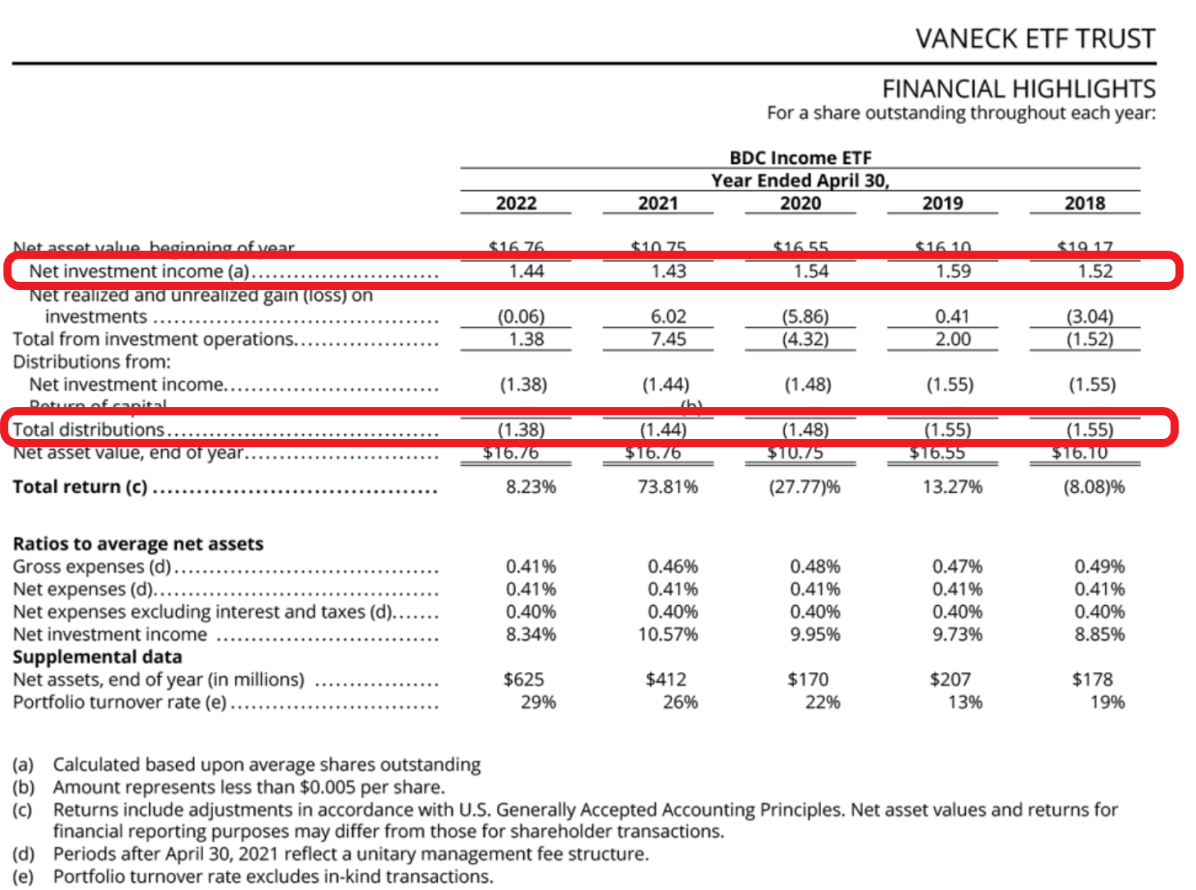
BIZD pays a high quarterly distribution, currently set at $0.4097 / share or 11.2% annualized. For the most part, BIZD's distribution tracks the fund's net investment income, so it appears sustainable (Figure 4).
Figure 4 - BIZD financial summary (BIZD annual report)
However, investors should note that BIZD's NAV and distributions are dependent on the market value and distributions of the underlying BDCs. If the underlying BDCs suffer realized losses, that may negatively affect BIZD's NAV. Furthermore, if the underlying BDCs cut their distributions, BIZD's distribution may be affected.
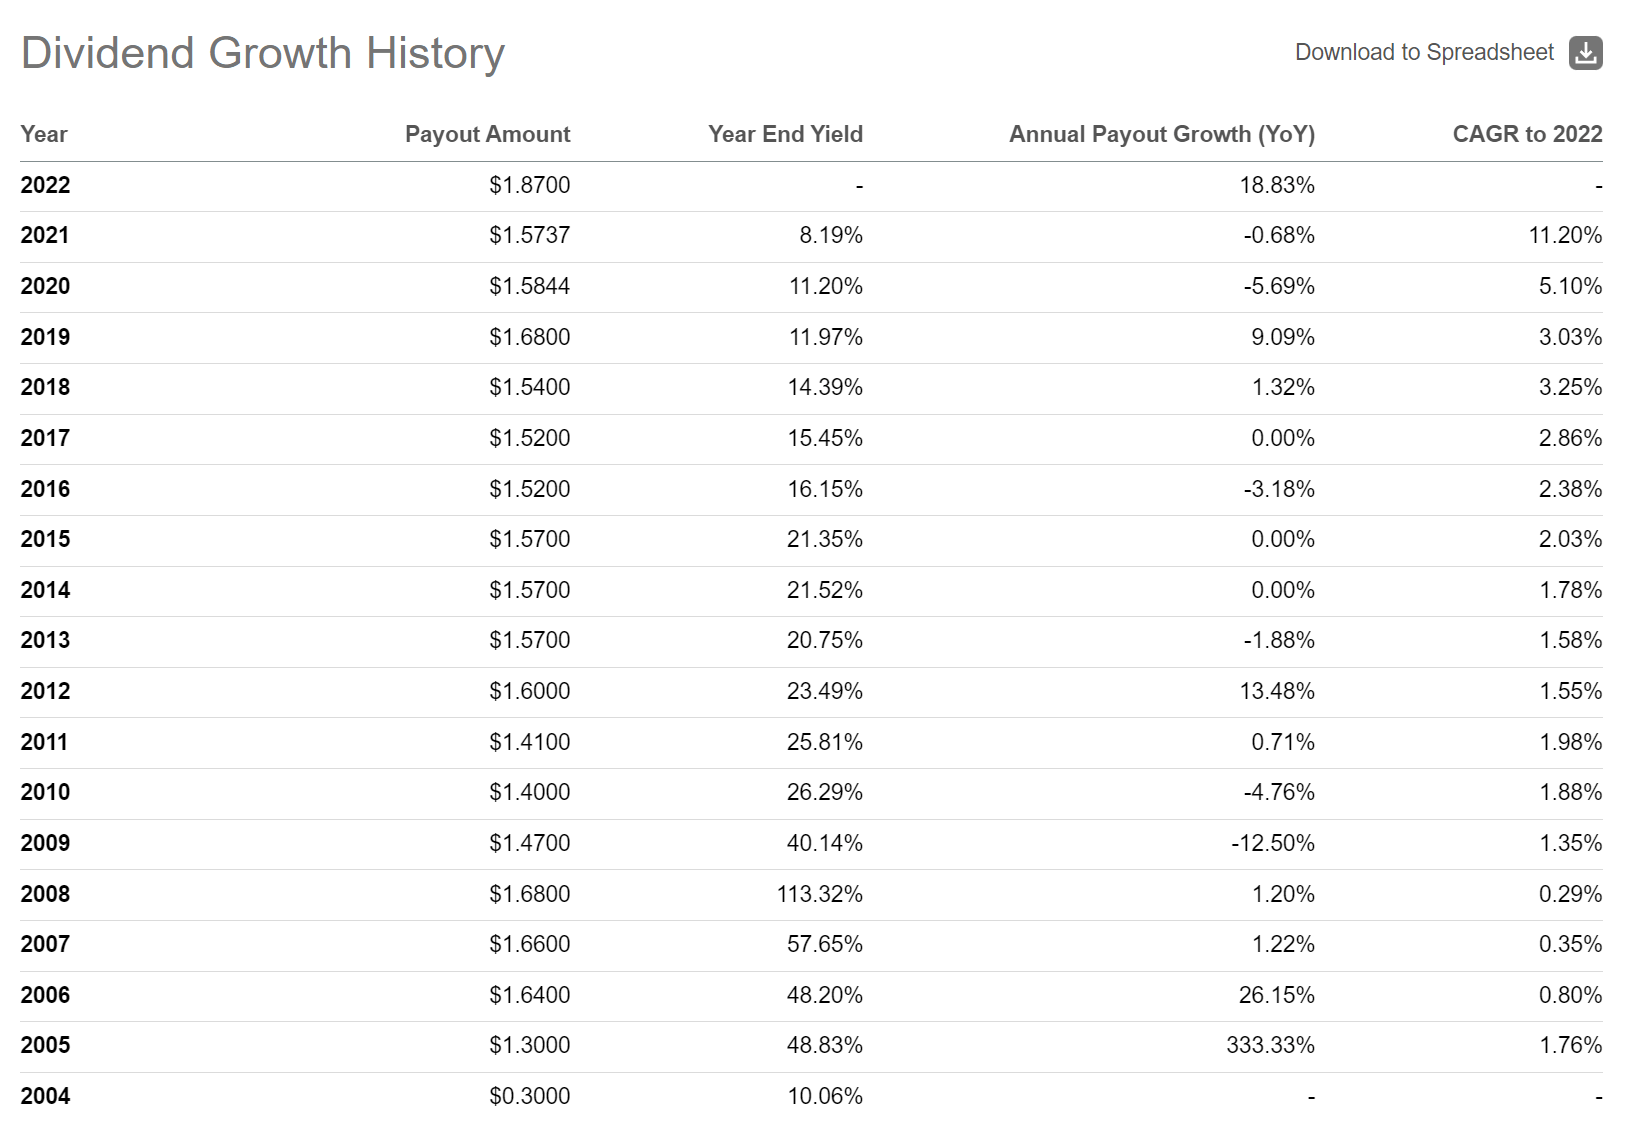
Historically, BDCs like Ares Capital have been able to maintain a high distribution rate, even during periods of economic distress like the 2008 Great Financial Crisis and the 2020 COVID pandemic (Figure 5).
Figure 5 - ARCC had maintained distributions even during economic distress (Seeking Alpha)
Fees
The BIZD ETF charges a 0.40% management fee. However, investors should note that BIZD's fund-of-fund structure means that investors are indirectly paying the fees and expenses of the underlying BDCs. This translates into a very net expense ratio of 10.92% (Figure 6).
Figure 6 - BIZD pays a high net expense ratio due to underlying BDC expenses (BIZD fact sheet)
Conclusion
The BIZD ETF uses a portfolio approach to invest in high yielding BDCs. While BIZD's quarterly distribution looks attractive, investors should note that historically, the BIZD ETF only performs well after a period of significant economic turmoil (2016, 2019, 2021). Given we are heading into a potential economic slowdown / recession in 2023, investors may wish to exercise patience and wait for high yield credit spreads to blow out before investing.
For further details see:
BIZD: Portfolio Approach To BDC Investing