BIZD - BIZD Vs. MORT: All High Income Choices Are Not The Same
2023-08-01 05:56:09 ET
Summary
- BIZD is an ETF which holds BDCs.
- MORT is an ETF focused on mortgage REITs.
- Both offer double-digit yields.
- We look at why one has done 462% the returns of the other.
The chase for high yield in 2020 and 2021 led investors to a wide variety of products that threw off high income. But very few succeeded in providing that income while preserving the underlying value. Today we look at two ETFs which still dole out double digit income. The two are exposed to very popular sectors but differ remarkably in their overall performance when total returns are considered. We examine where that difference came from and give our outlook for the next 12 months for both.
VanEck BDC Income ETF ( BIZD )
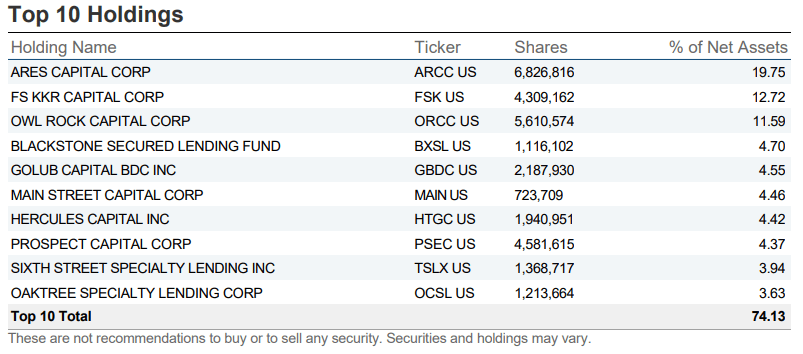
BIZD is our first protagonist for today and has been around since 2013. BIZD seeks to copy to the best extent possible, before fees and expenses, the price and yield performance of the MVIS US Business Development Companies Index (MVBDCTRG). This index tracks the performance of publicly traded business development companies i.e. BDCs. On last check the fund held only 26 companies, which is not a surprise as there are not that many BDCs to begin with. BIZD is heavily concentrated, with the top 5 holdings making up more than 53% of the fund.
The holdings include familiar names like Ares Capital ( ARCC ), FS KKR Capital ( FSK ), Blackstone Secured Lending Fund ( BXSL ) and Main Street Capital ( MAIN ). The fund itself charges a low management fee of 40 basis points but the overall expense ratio looks rather unwieldly at first blush.
VanEck-BIZD
The reason is that the underlying BDC companies are also viewed as "funds". So BIZD is functioning like a "fund of funds" as per the technical definition. So the underlying BDC company expenses are added as fund expenses. Now any regular fund like S&P 500 fund ( SPY ) holds companies that have their own expenses to run their day to day functions. But you never see these expenses tagged on when you look at the fund's expense ratios.
State Street-SPY
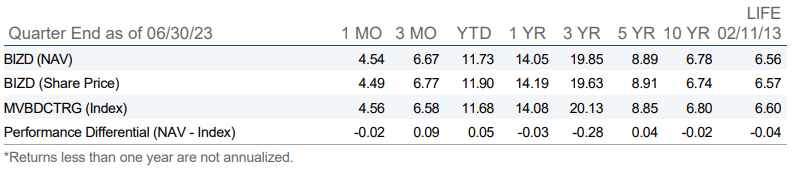
So rather than creating alarm, one must simply understand that this overall number of 10.92% is rather meaningless. If you assembled the same BDCs in the same ratio as BIZD, you would be indirectly paying 10.51% in expenses yourself. All you have to decide here is whether the 0.4% is worth it or not. As we look at the performance next, it appears that they are definitely delivering for this 0.4%. By that we mean that the fund has underperformed the benchmark by far less than 0.4% a year. This holds true across all time frames and over the last 5 years it has done a smidge better than the index.
That is pretty remarkable.
VanEck Mortgage REIT Income ETF ( MORT )
MORT is our second protagonist for the day and comes from the same fund family. It has been around a bit longer, since August 2011. MORT seeks to replicate the price and yield performance of the MVIS US Mortgage REITs Index (MVMORTTG) after fees and expenses. The top 10 holdings include Annaly Capital Management Inc. ( NLY ), Starwood Property Trust Inc. ( STWD ) and AGNC Investment Corp. ( AGNC ).
VanEck-MORT
The fund is less concentrated than BIZD but the top 5 still make up about 39% of total assets. Total holdings were 27 at last check.
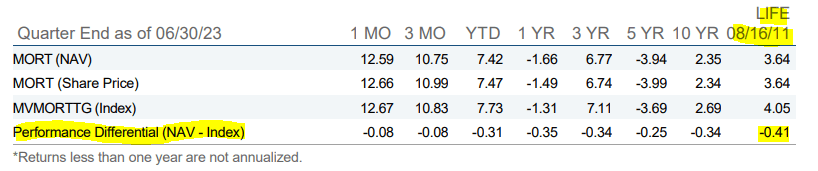
MORT has the same raw expense ratio as BIZD.
VanEck-MORT
However in the case of MORT the fee has acted as a drag versus its benchmark. In fact since inception, the drag has been exactly 41 basis points on an annualized rate.
Performance
Over the last decade, BIZD has handily outperformed MORT. Of course while the annualized numbers above show that, investors still fail to realize just how big a difference that level of differential compounding creates. Since BIZD's inception, the fund NAV is down 21.32% while MORT's NAV is down 55.25%. BIZD's total return has been 463% of MORT's.
One related one fact is that if on Feb 18, 2013 (BIZD's inception date and the start of the chart date above), you bought a 10-year Treasury bond, your total return would be almost identical to MORT.
Why is there such a difference in these high yielding ETFs?
The answer is pretty obvious. BDCs are a superior asset class over all timeframes versus mortgage REITs. More precisely, mortgage REITs are a poor asset class over every timeframe versus risk-free returns.
Mortgage REIT Returns From NAREIT
What we mean is that mortgage REITs have underperformed the 10 Year Treasury rates on every single timeframe. For example, 30 years back, the 10-Year Treasury rates were well over 6% .
Multpl
Mortgage REITs underperformed that number by delivering 5.05% compounded returns including distributions. Now with a highly risky asset class like Mortgage REITs, which have a very high volatility, they need to deliver at least 10% annually over the risk-free rate to justify an investment. The fact that they underperform, shows you that this is about as non-investable as it gets.
BDCs, on the other hand, while definitely more volatile than large cap stocks, have comfortably outperformed risk-free rates. Of course, as to whether they have outperformed by enough, remains debatable for the risk they carry. Our opinion is that they have. Here are 3 popular BDCs that we follow. PennantPark Investment Corp. ( PNNT ) is easily the worst of them, but even that has done 2.5X as much as MORT over the last decade.
Outlook
There are two critical differences that one needs to be aware of here as we forecast returns. The first is that BDCs carry far less leverage than mortgage REITs. The former is limited to 2X leverage on capital, whereas mortgage REITs generally dance at 8.0X limits. An extension of that is that many BDCs carry investment grade ratings, but we are not aware of any mortgage REITs currently getting that treatment. So whatever differences you saw in the past they are likely to get amplified in a recession.
The second key difference is that BDCs are far less sensitive to the yield curve than mortgage REITs.
So if you expect a rapid unwinding of this level of inversion, mortgage REITs could do better than their own historical averages. We still think MORT will underperform BIZD in almost all scenarios across most timeframes.
Verdict
If you preserve your NAV, your preserve your ability to generate distributions. That is basic math that yield chasers seem to ignore. While MORT sports a higher yield today than BIZD on a trailing 12 month basis, the longer term story is firmly in favor of BIZD. For example, MORT's first quarter saw a 68 cent distribution.
The last quarter was 29 cents , less than half the original distribution. That is what mortgage REITs do to you over time.
BIZD's first quarter was 36 cents.
Last quarter they doled out 42 cents. So there is certainly an element here of growth, even though modest and it is coming off a lower NAV.
We give BIZD a 5 on our potential pain scale rating.
MORT gets a 7.
Please note that this is not financial advice. It may seem like it, sound like it, but surprisingly, it is not. Investors are expected to do their own due diligence and consult with a professional who knows their objectives and constraints.
For further details see:
BIZD Vs. MORT: All High Income Choices Are Not The Same