TROW - BlackRock Q4 Earnings: Quality Profile Is Reflected In Its Valuation
2024-01-12 13:06:58 ET
Summary
- BlackRock, Inc. is the world's largest asset management company with $10 trillion in assets under management.
- The company has a strong position in the ETF industry, which is expected to continue growing.
- BlackRock's recent acquisition of Global Infrastructure Partners will further diversify its business and increase its presence in alternative assets.
BlackRock, Inc. ( BLK ) has strong business fundamentals in the asset management industry, but this seems to be already reflected in its valuation after a strong share price performance over the past couple of months. The company today reported positive Q4 earnings and a significant acquisition in the alternatives segment, but this doesn't seem to be enough to change the valuation perspective.
Business Overview
BlackRock is an asset management company, being the world’s largest measured by assets under management (AuM), which amounted to about $10 trillion at the end of 2023. Its customer base is well diversified across type of clients, with wealth management, pension plans, and insurance companies being the largest ones. Investors should note that BlackRock is not engaged in proprietary trading, thus all of its AuM are invested in behalf of its clients.
The company provides investment management services and funds to institutional and retail customers, across several investment vehicles, including mutual funds, exchange-traded funds ("ETFs"), and others. Beyond its core money management business, it also offers risk management and technology services, which are complementary to its more "traditional" business. Its distribution is made through several channels, including financial advisors, pension consultants, third-party distribution relationships, and directly from its own sales efforts.
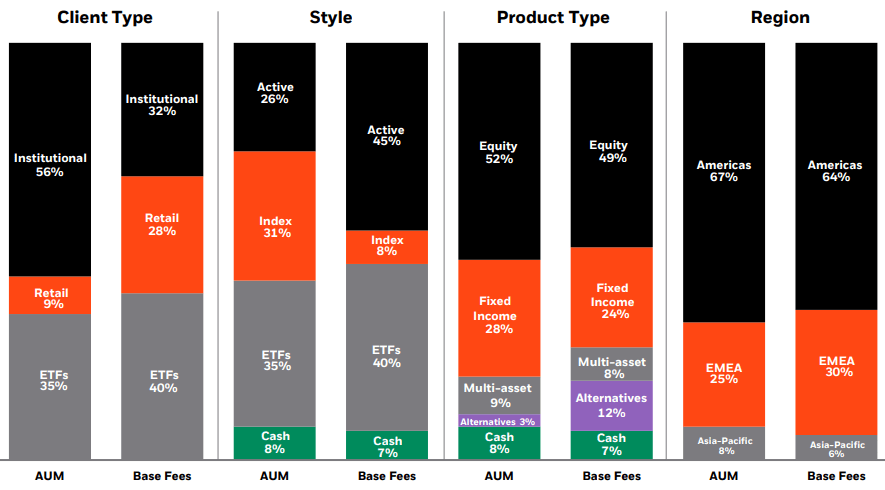
Its product range is quite diversified, including index investing alternatives across several investment classes, of which equities, fixed income, and alternatives are the most important ones. As shown in the next graph, a large part of its AuM are based on ETFs or index funds, which account for about 66% of its total AuM, but have a much lower weight on the company’s fees because these products usually have much lower management fees than active funds.
Geographically, while the company is present across the globe, the vast majority of its fees are generated in the Americas, a profile that is not expected to change much in the foreseeable future. By asset type, about half of its AuMs and fees are generated by equity funds, a profile that may change in the future as the company continues to grow its alternatives business, namely in private credit, which should lead to higher fees from other asset classes over the coming years.
As I’ve covered recently on T. Rowe Price Group ( TROW ), the asset management industry has changed considerably over the past two decades, with passive investing becoming much more popular. This has led to a strong rise in AuM dedicated to ETFs or index funds, at the expense of active funds.
Generally speaking, most of the traditional asset management industry is not able to beat investment benchmarks, after fees, over the long term, thus investors have increasingly shifted their investments into other cheaper alternatives.
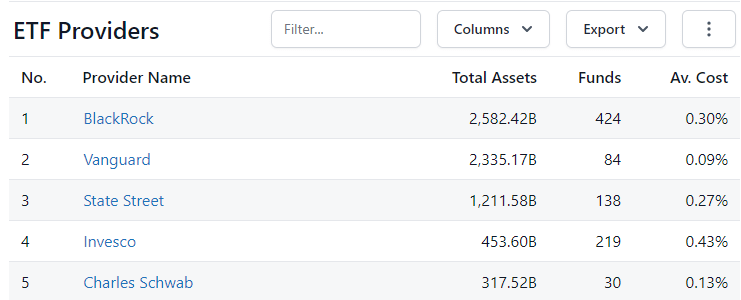
While BlackRock was not one of the leading companies in the ETF space at the beginning, its acquisition of iShares from Barclays ( BCS ) in 2009 was very well-timed and boosted BlackRock’s position in the ETF industry, being nowadays the clear leader in this space. Indeed, as shown in the next table, BlackRock has more than 400 ETFs available for investors and some $2.5 trillion in AuM in the U.S., beating by a small margin its competitor Vanguard , while other companies in the ETF industry have a much lower size.
This is clearly a competitive advantage for BlackRock, as the rise of passive investing is a trend that is expected to be maintained for the foreseeable future, boding well for its growth prospects.
In addition to its money management offerings, BlackRock has also expanded its risk management, advisory, and enterprise system services over the past few years, offering a more complete product suite to sophisticated and institutional investors, being an important growth driver for the company. For instance, when I covered BlackRock back in 2018, its risk management technology platform Aladdin had about 25,000 users, while nowadays it has over 130,000 users, reaching an outstanding growth during this period.
This has been a strong support for its technology revenue growth of about 12% annually over the past three years, a trend that is likely to maintain as the demand from investors for services like Aladdin is expected to remain strong in the near future.
Going forward, BlackRock has relatively good growth prospects due to its leadership position in the asset management industry, plus its strategy to offer a "Platform as a Service," or PaaS, offering seems to be well suited to have higher customer engagement across its money management and technology solutions, something that represent a competitive advantage over peers and is not easy to replicate in the industry.
Financial Overview
Regarding its financial performance, BlackRock has benefited immensely from positive capital markets until 2022, boosting asset and revenue growth over the past decade. However, the company is highly geared to the capital markets, and not surprisingly its revenues declined by 7.7% in 2022 to $17.8 billion, due mainly to lower AuM and performance fees across several fund types.
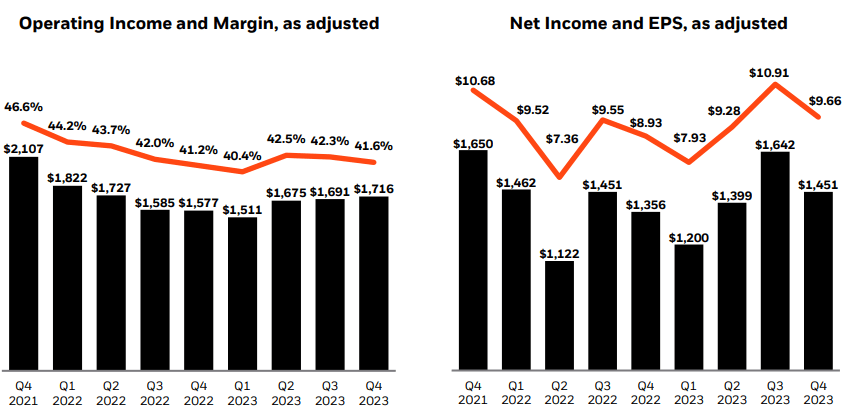
Due to lower revenues, its operating margins declined during the year, from about 45-46% in 2021, to about 42-42% in 2022, while its net income for the full year was $5.1 billion, a decline of 9% YoY, which can be considered a resilient result during a tough period of asset managers.
In fiscal 2023 , for which the company has released its results very recently, the company reported improved financial metrics, supported by a better performance of the capital markets and positive net flows during the year. Indeed, BlackRock was able to report positive net flows consistently over the past couple of years, which is a great sign about its strong competitive position in the asset management industry, which is quite difficult to replicate.
Net flows (BlackRock)
As shown in the previous graph, its net flows amounted to $96 billion in the last quarter, with investors putting more money to work as both bonds and equities had a very positive quarter. For the full year, its net inflows amounted to $289 billion, or about 3% of its total AuMs.
Beyond positive organic growth, BlackRock also announced the acquisition of Global Infrastructure Partners for about $12.5 billion, being the company’s largest acquisition in over a decade. This increases its AuM by about $100 billion in the infrastructure segment, being another step to further diversify its business and continue to grow in alternative assets. The acquisition is expected to be completed in Q3, 2024, and will be offered $3 billion in cash and the rest in BlackRock’s shares.
This is expected to increase alternative assets contribution to the company’s overall fees, which currently contribute to about 12% of total fees, but only account for 3% of AuMs. This clearly shows that alternative investments is an asset class that is highly profitable for the company, thus this deal seems to fit well within its strategy to grow in private credit and alternative asset classes.
Regarding its profitability, BlackRock’s revenues were stable at $17.8 billion in the year, while its operating margin recovered a little over the past few quarters to a level around 42%, which is an improvement compared to the bottom reached in 2022, but still somewhat below its 2021 levels.
Its net income in the year was $5.5 billion, up by 6% YoY, while its diluted EPS was $36.51 (+7% YoY), a slightly higher increase than its bottom line due to a lower number of shares outstanding.
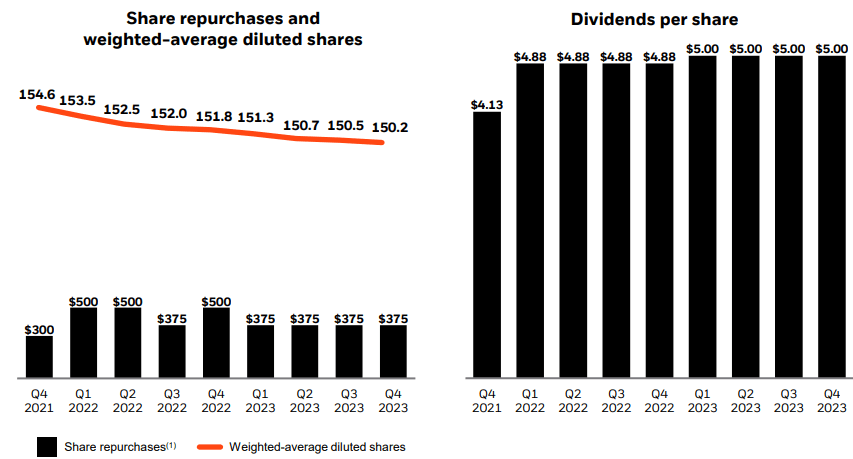
Indeed, BlackRock has a strong balance sheet and a capital-light business model, and therefore does not need to retain much earnings. While the company has some debt outstanding, its net debt-to-EBITDA ratio is quite low at some 0.3x, thus BlackRock can distribute the vast majority of its earnings to shareholders both through dividends and share buybacks.
This has been its strategy in recent years and is quite likely to continue in the near term, as the company has announced a quarterly increase in its dividend to $5.10. This means its annual dividend will increase to $20.40 per share, up by 2% YoY. In 2023, BlackRock has returned $4.5 billion in capital to shareholders, of which some $1.5 billion were through share repurchases, representing about 80% of its annual profit.
Related to 2024 earnings, the company is likely to maintain a high payout ratio, thus share buybacks of about $1.5-17 billion are quite likely, given that its net profit is expected to be around $5.7 billion, thus there is some room to increase share buybacks in the coming quarters.
However, despite its dividend being sustainable over the long term, at its current share price, BlackRock offers a dividend yield of about 2.5%, which is not particularly attractive compared to other companies in the financial sector and other investment alternatives, such as treasuries or time deposits.
Conclusion
BlackRock has strong fundamentals and a leading position in the asset management industry, being a competitive advantage over peers. Its strategy to grow in alternative investment seems to make sense, and its recent acquisition of Global Infrastructure Partners is another step in the right direction.
Despite that, BlackRock, Inc. stock is currently trading at a premium valuation to peers and its own historical average, showing that its shares aren’t cheap. Indeed, it’s currently trading at more than 21x earnings, while its own average over the past five years is about 19x, which seems to be a high multiple for a business that is only growing earnings at mid-single digit. Therefore, while BlackRock is a quality company in the financial sector, after a strong share price rally over the past couple of months, investors should now wait for a pullback to enter into a position.
For further details see:
BlackRock Q4 Earnings: Quality Profile Is Reflected In Its Valuation