BXC - BlueLinx: The Market Is Not Pricing This As A Cyclical Company
Summary
- There is a strong correlation between BXC revenue and US Housing Starts. Housing Starts is cyclical and BXC should be analyzed and valued as a cyclical company.
- While the past 2 years’ performance has been record-breaking, it does not represent its performance over the cycle.
- There is no margin of safety based on its performance over the cycle.
Investment Thesis
BlueLinx Holdings Inc ( BXC ) is a cyclical company. Its revenue is strongly correlated to Housing Starts. BXC's cyclical performance should thus mirror that of Housing Starts.
The Housing Starts has started its downtrend and I would expect the revenue of BXC to follow suit. However, the market is not pricing BXC as a cyclical company.
A valuation of BXC based on its cyclical performance shows that there is no margin of safety at its current market price. While BXC achieved record breaking performance over the past 2 years, they are not reflective of the cyclical performance.
The thrust of my analysis
BXC is a cyclical company with the following stated in its Jan 2022 Form 10k :
"…The building products distribution industry is subject to cyclical market pressures… Our business depends to a significant degree on the new residential construction market and, in particular, single family home construction."
I will show that there is a strong correlation between BXC revenue and Housing Starts. Housing Starts have started on its downtrend and I would expect BCX revenue and performance to follow suit.
As a long-term value investor with a holding period of 8 to 10 years, there were 2 questions that I wanted answers for:
- Where would BXC be in 10 years businesswise?
- Is any margin of safety at the current price based on its cyclical performance?
Average performance
BXC is a leading wholesale distributor of residential and commercial building products in the US. It distributes products in two principal categories - specialty products and structural products.
BXC was formed in 1954, but came into existence in its present form in 2004 following the acquisition of the lumber distribution division of Georgia-Pacific LLC. Its first full year of financials after this acquisition was in 2005. By coincidence, 2005 is also the peak of the latest peak-to-peak (2005 to 2022) of the US Housing Starts cycle.
While the company achieved record earnings for the past two years, I would rate its performance as "average" over the Housing Starts cycle. This is because:
- Its performance for most of the past 18 years was worse than those of 2005.
- It performed "in-between" when compared to Boise Cascade and Weyerhaeuser.
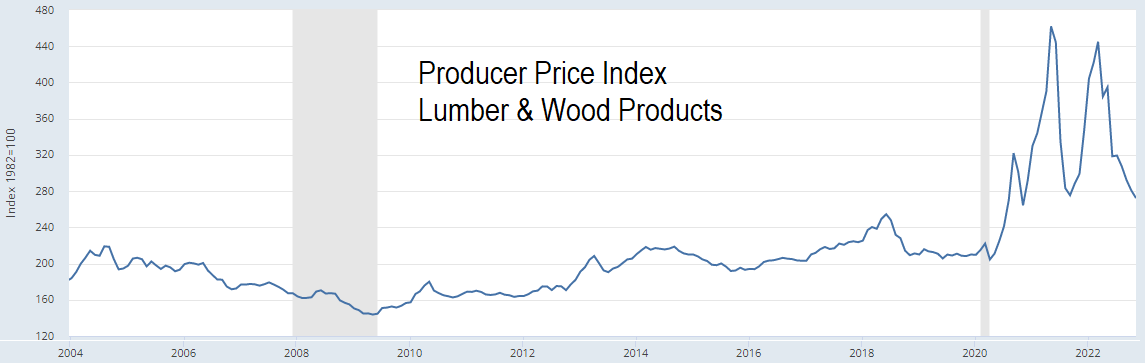
I do not consider the past 2 years' earnings as sustainable as they were due mostly to price growth. This is clearly illustrated by Chart 1.
Chart 1: Producer Price Index - Lumber and Wood Products ((FRED))
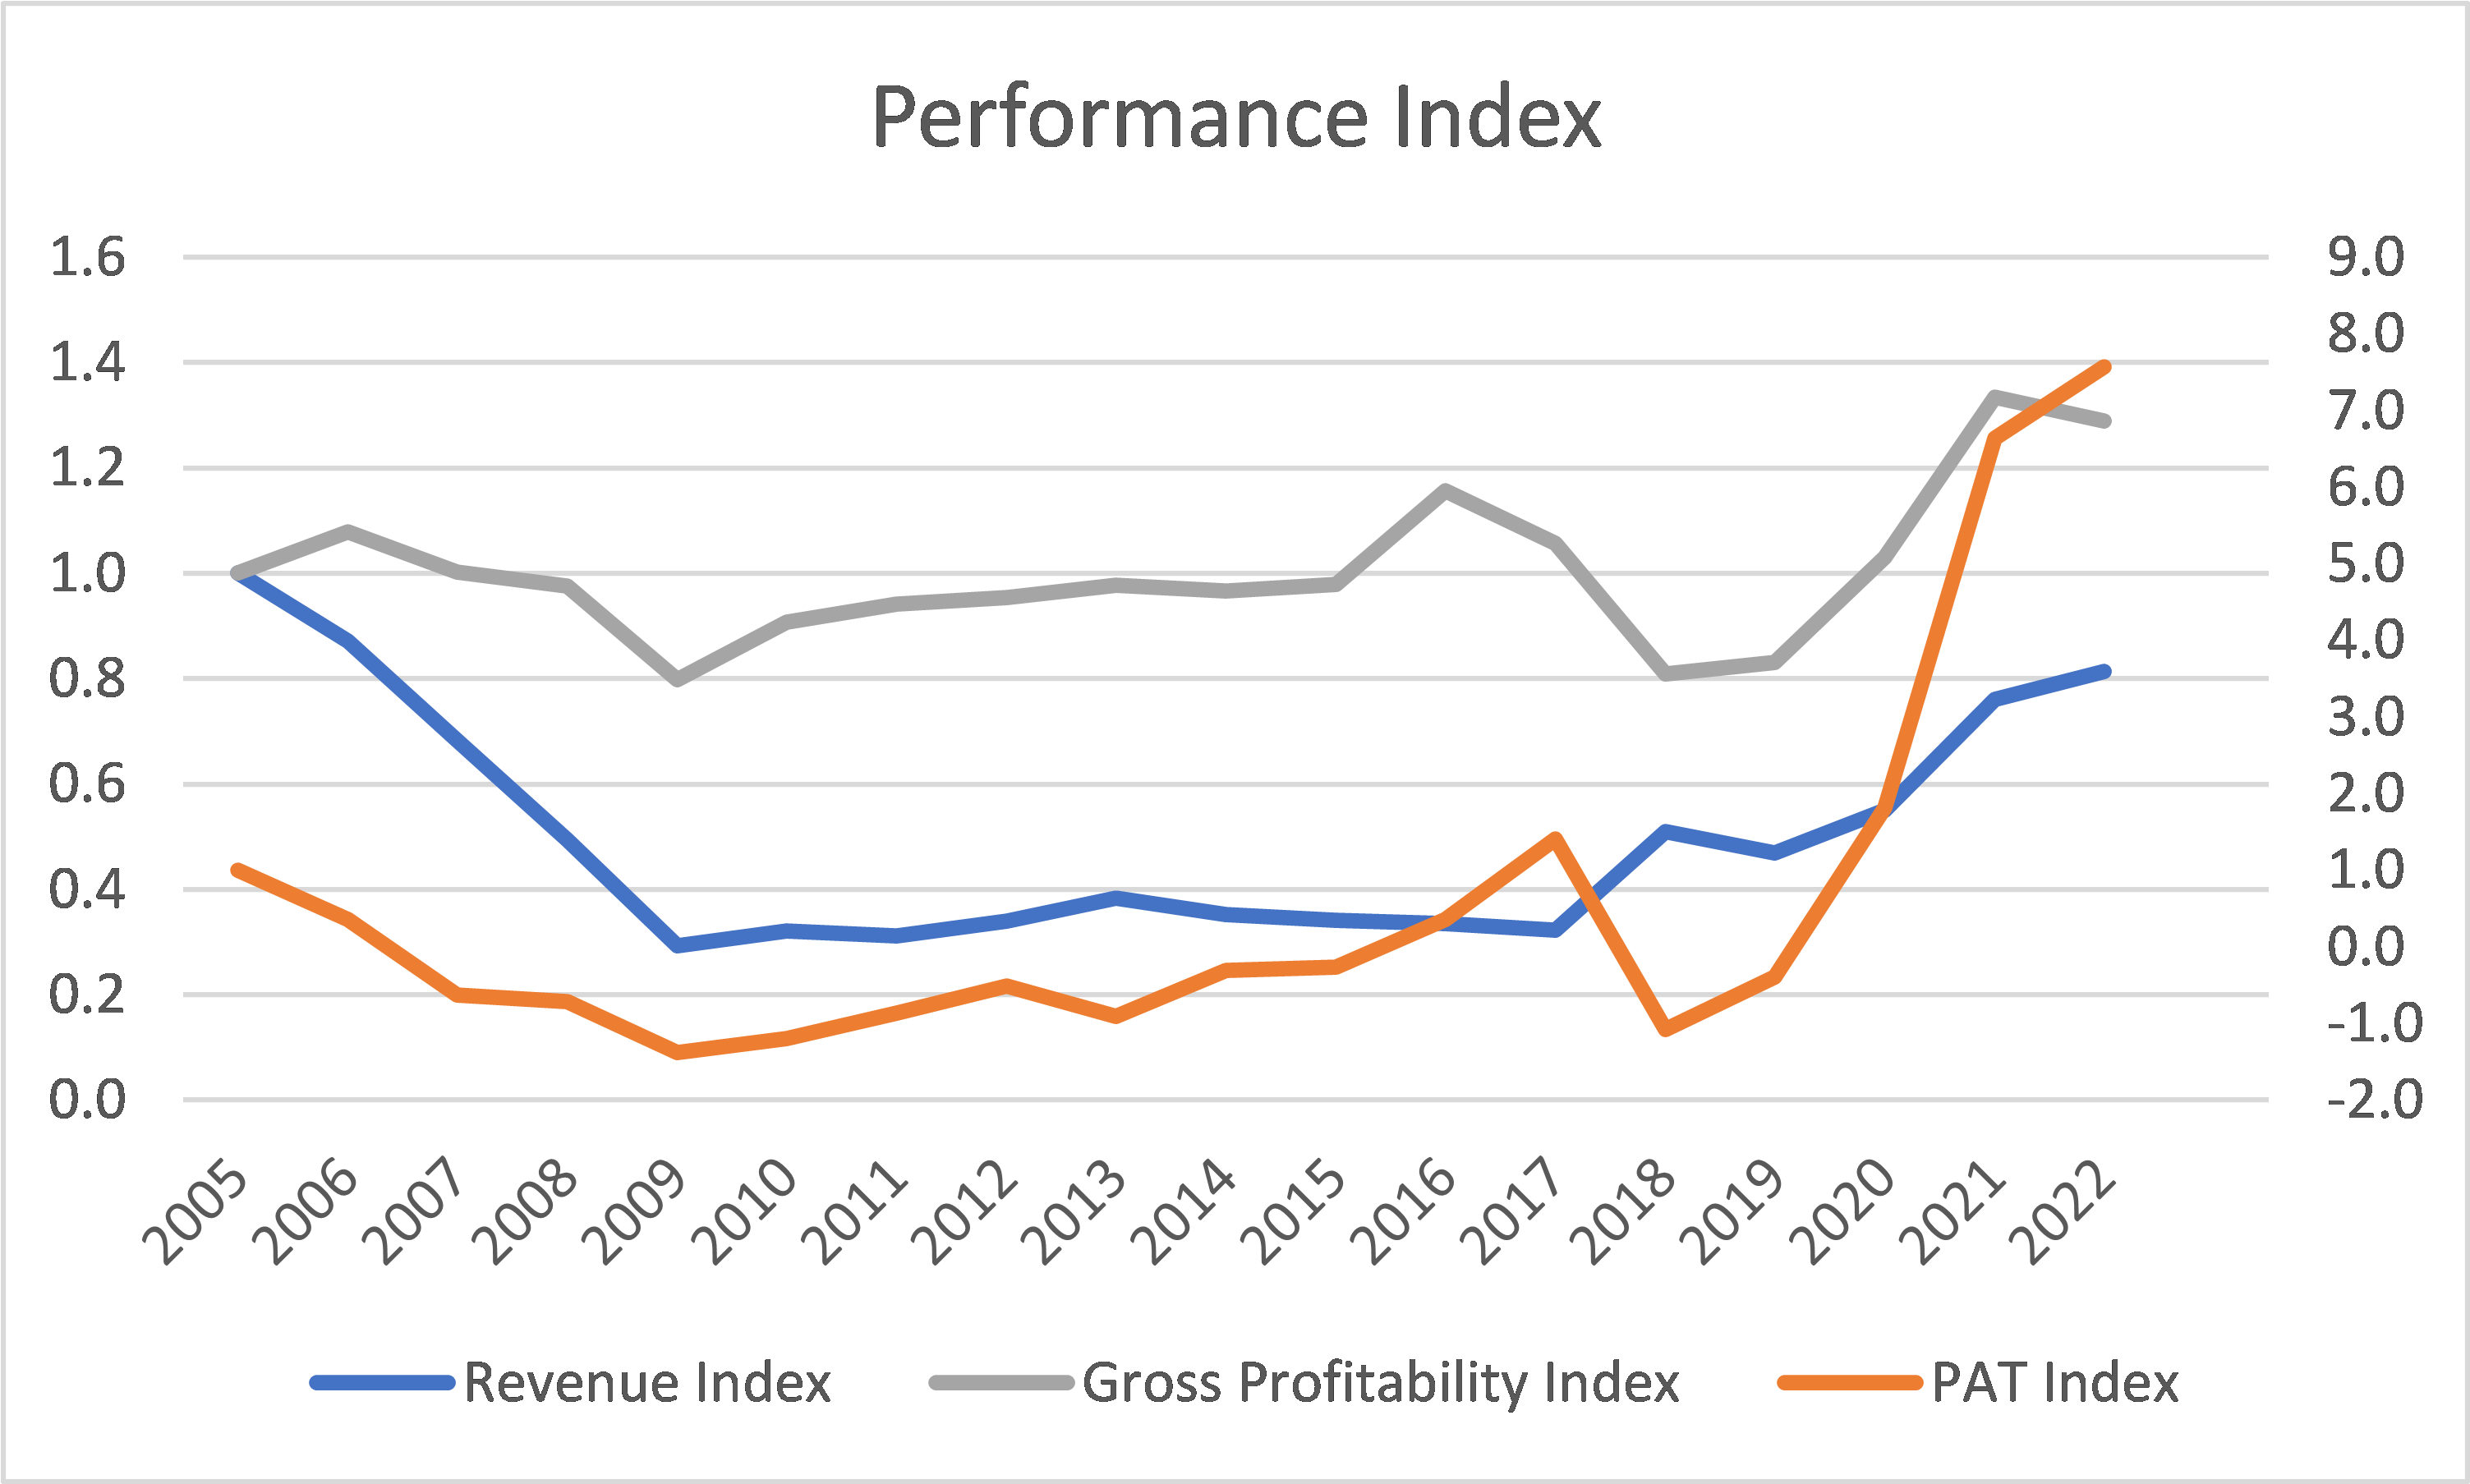
You can also get a sense of this by looking at the relative revenue and PAT trends in Chart 2.
PAT increased at a higher rate than revenue over the past two years. Gross profitability (gross profit divided by total assets) was high over the past 2 years.
While revenue began to an uptrend in 2017/18, it was still below that for 2005 for the past 18 years. You can also see that the PAT before 2017 was lower than that for 2005.
Chart 2: Performance Index (Author)
Notes to Chart 2:
a) I took the Oct 2022 LTM to represent the 2022 values.
b) Refer to the left axis for the PAT Index and the right axis for the others.
In its Jan 2022 Form 10k , BXC identified Boise Cascade and Weyerhaeuser as its peers. A comparison of BXC with these 2 as per Table 1 shows that BXC performance lies in between.
Table 1: Peer Return and Growth (Author)
Note to Table 1:
a) You would expect Weyerhaeuser's return to be lower as has bigger assets - it owns timberland and manufacturing facilities.
b) I compared the Revenue growth from 2010 to 2022 to coincide with the Housing Starts trough-to-peak period.
I also have concerns about BXC's financial strengths. Over the past 18 years, it only managed to generate positive annual Cash Flow from Operations for half of the period. While BXC currently has a 0.69 Net Debt Equity ratio, this was due to the strong cash flow generated over the past 2 years.
Compared to its peers, BXC's financial position is nothing to shout about. Refer to Table 2.
Table 2: Peer Financial Metrics (Author)
Note to Table 2: The negative Net Debt to Equity for Boise Cascade meant that it had more Cash than Debt.
Drivers of growth
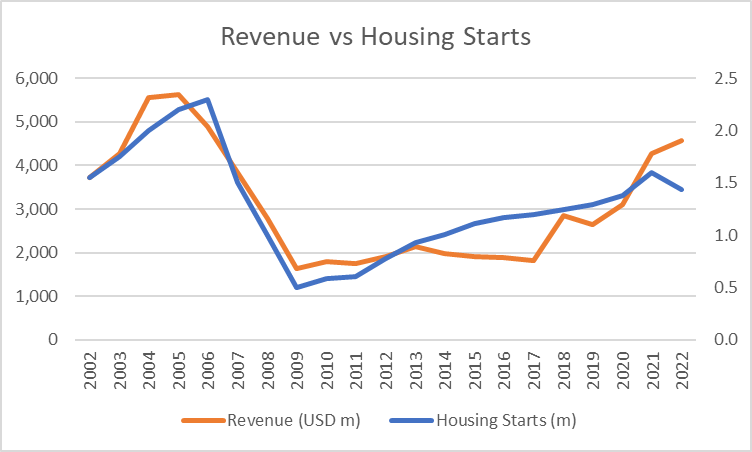
When I plotted BXC revenue against the US Housing Starts for the past 18 years, I obtained the picture as shown in Chart 3. You can see the link between them.
Chart 3: BXC Revenue vs Housing Starts (Author)
Notes to Chart 3:
a) BXC 2022 revenue was based on Oct 2022 LTM revenue.
b) Refer to the left axis for the Housing Starts and the right axis for Revenue.
I would break down the past 20 years into 3 periods to correspond with the Housing Starts uptrend and downtrend patterns. Table 3 summarizes the correlation between BXC revenue and the Housing Starts for these periods.
Since Housing Starts is cyclical, then BXC is in a cyclical company. The strong correlation provides one way to estimate the cyclical performance of BXC - follow the Housing Starts cycle.
Table 3: Correlation between BXC revenue and Housing Starts (Author)
Housing Starts
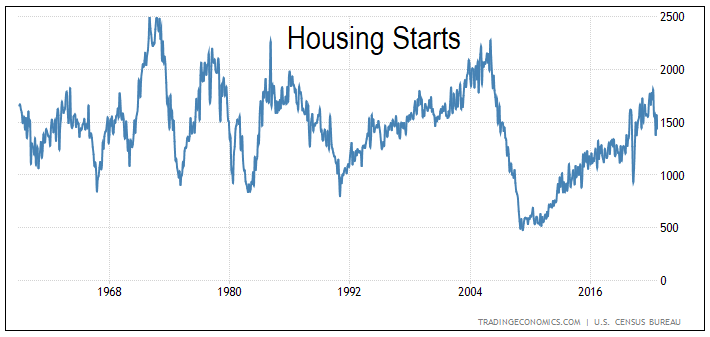
The home building industry is cyclical one where there is no growth in the long-term average annual Housing Starts of about 1.5 million units. Refer to Chart 4.
Chart 4: US Housing Starts (Trading Economics)
But the Housing Starts were based on physical units. While there is no long-term growth in volume, there was still growth in prices. The House Price Index had increased at a 4.6 % CAGR from 1992 till Aug 2022. But this growth rate is not much different from the US long-term GDP growth rate.
Valuation of cyclical companies
According to Professor Damodaran , the value of a cyclical company is more dependent on a macro variable rather than firm-specific characteristics. In valuing a cyclical company, we have to "normalize" the performance over the cycle. Damodaran has one suggestion to do this:
"In effect, we can average profit margins over time, instead of net profits, and apply the average profit margin to revenues in the most recent period to estimate normalized earnings."
Then the challenge for BXC is determining what represents the cycle. I thus looked at 2 scenarios:
- The 2005 to 2022 period. This represents the peak-to-peak period.
- The 2010 to 2022 period. This represents the trough-to-peak period.
To represent the base revenue, I took BXC 2021 revenue. This is because the Housing Starts in 2021 of 1.6 million units is around the no-growth long-term annual Housing Starts.
Valuation of BXC
To estimate the Intrinsic Value of BXC, I used a single-stage Free Cash Flow to the Firm (FCFF) model of
Value = FCFF X (1+g) / (WACC - g)
FCFF = EBIT X (1 - tax) X (1 - Reinvestment rate).
EBIT = Revenue X (Gross Profit margin - SGA margin).
g = growth = Reinvestment rate X Return. I assumed this to be based on the long-term GDP growth rate of 4%.
Given g, we can estimate the Reinvestment rate = g / Return.
Return = EBIT X (1 - tax) / Total Capital Employed or TCE.
I estimated the TCE by determining the TCE/Revenue ratio X Projected Revenue.
WACC = weighted average cost of capital obtained from the first page of a Google search of the term "BXC WACC". Refer to Table 4.
Value of Equity = Value of Firm + Non-Operating Assets - Minority Interests - Debt
Table 4: Estimating WACC (Various)
The key variables here are the Gross Profit margin, SGA margin, and TCE/revenue. Table 5 illustrates the calculation assuming the cyclical values were based on the 2005 to 2022 averages.
Table 5: Estimating the Intrinsic Value (Author)
Based on this valuation model, I estimated that the Intrinsic Values of BXC to be either USD 43 per share or USD 67 per share. Refer to Table 6.
For both scenarios, there is no margin of safety based on the market price of BXC of USD 80 per share (as of 13 Jan 2023).
Table 6: Intrinsic Values under 2 Scenarios (Author)
Reverse-engineering the market price
You could argue that the analyses above do not recognize the improvements achieved for the 3 metrics over the years.
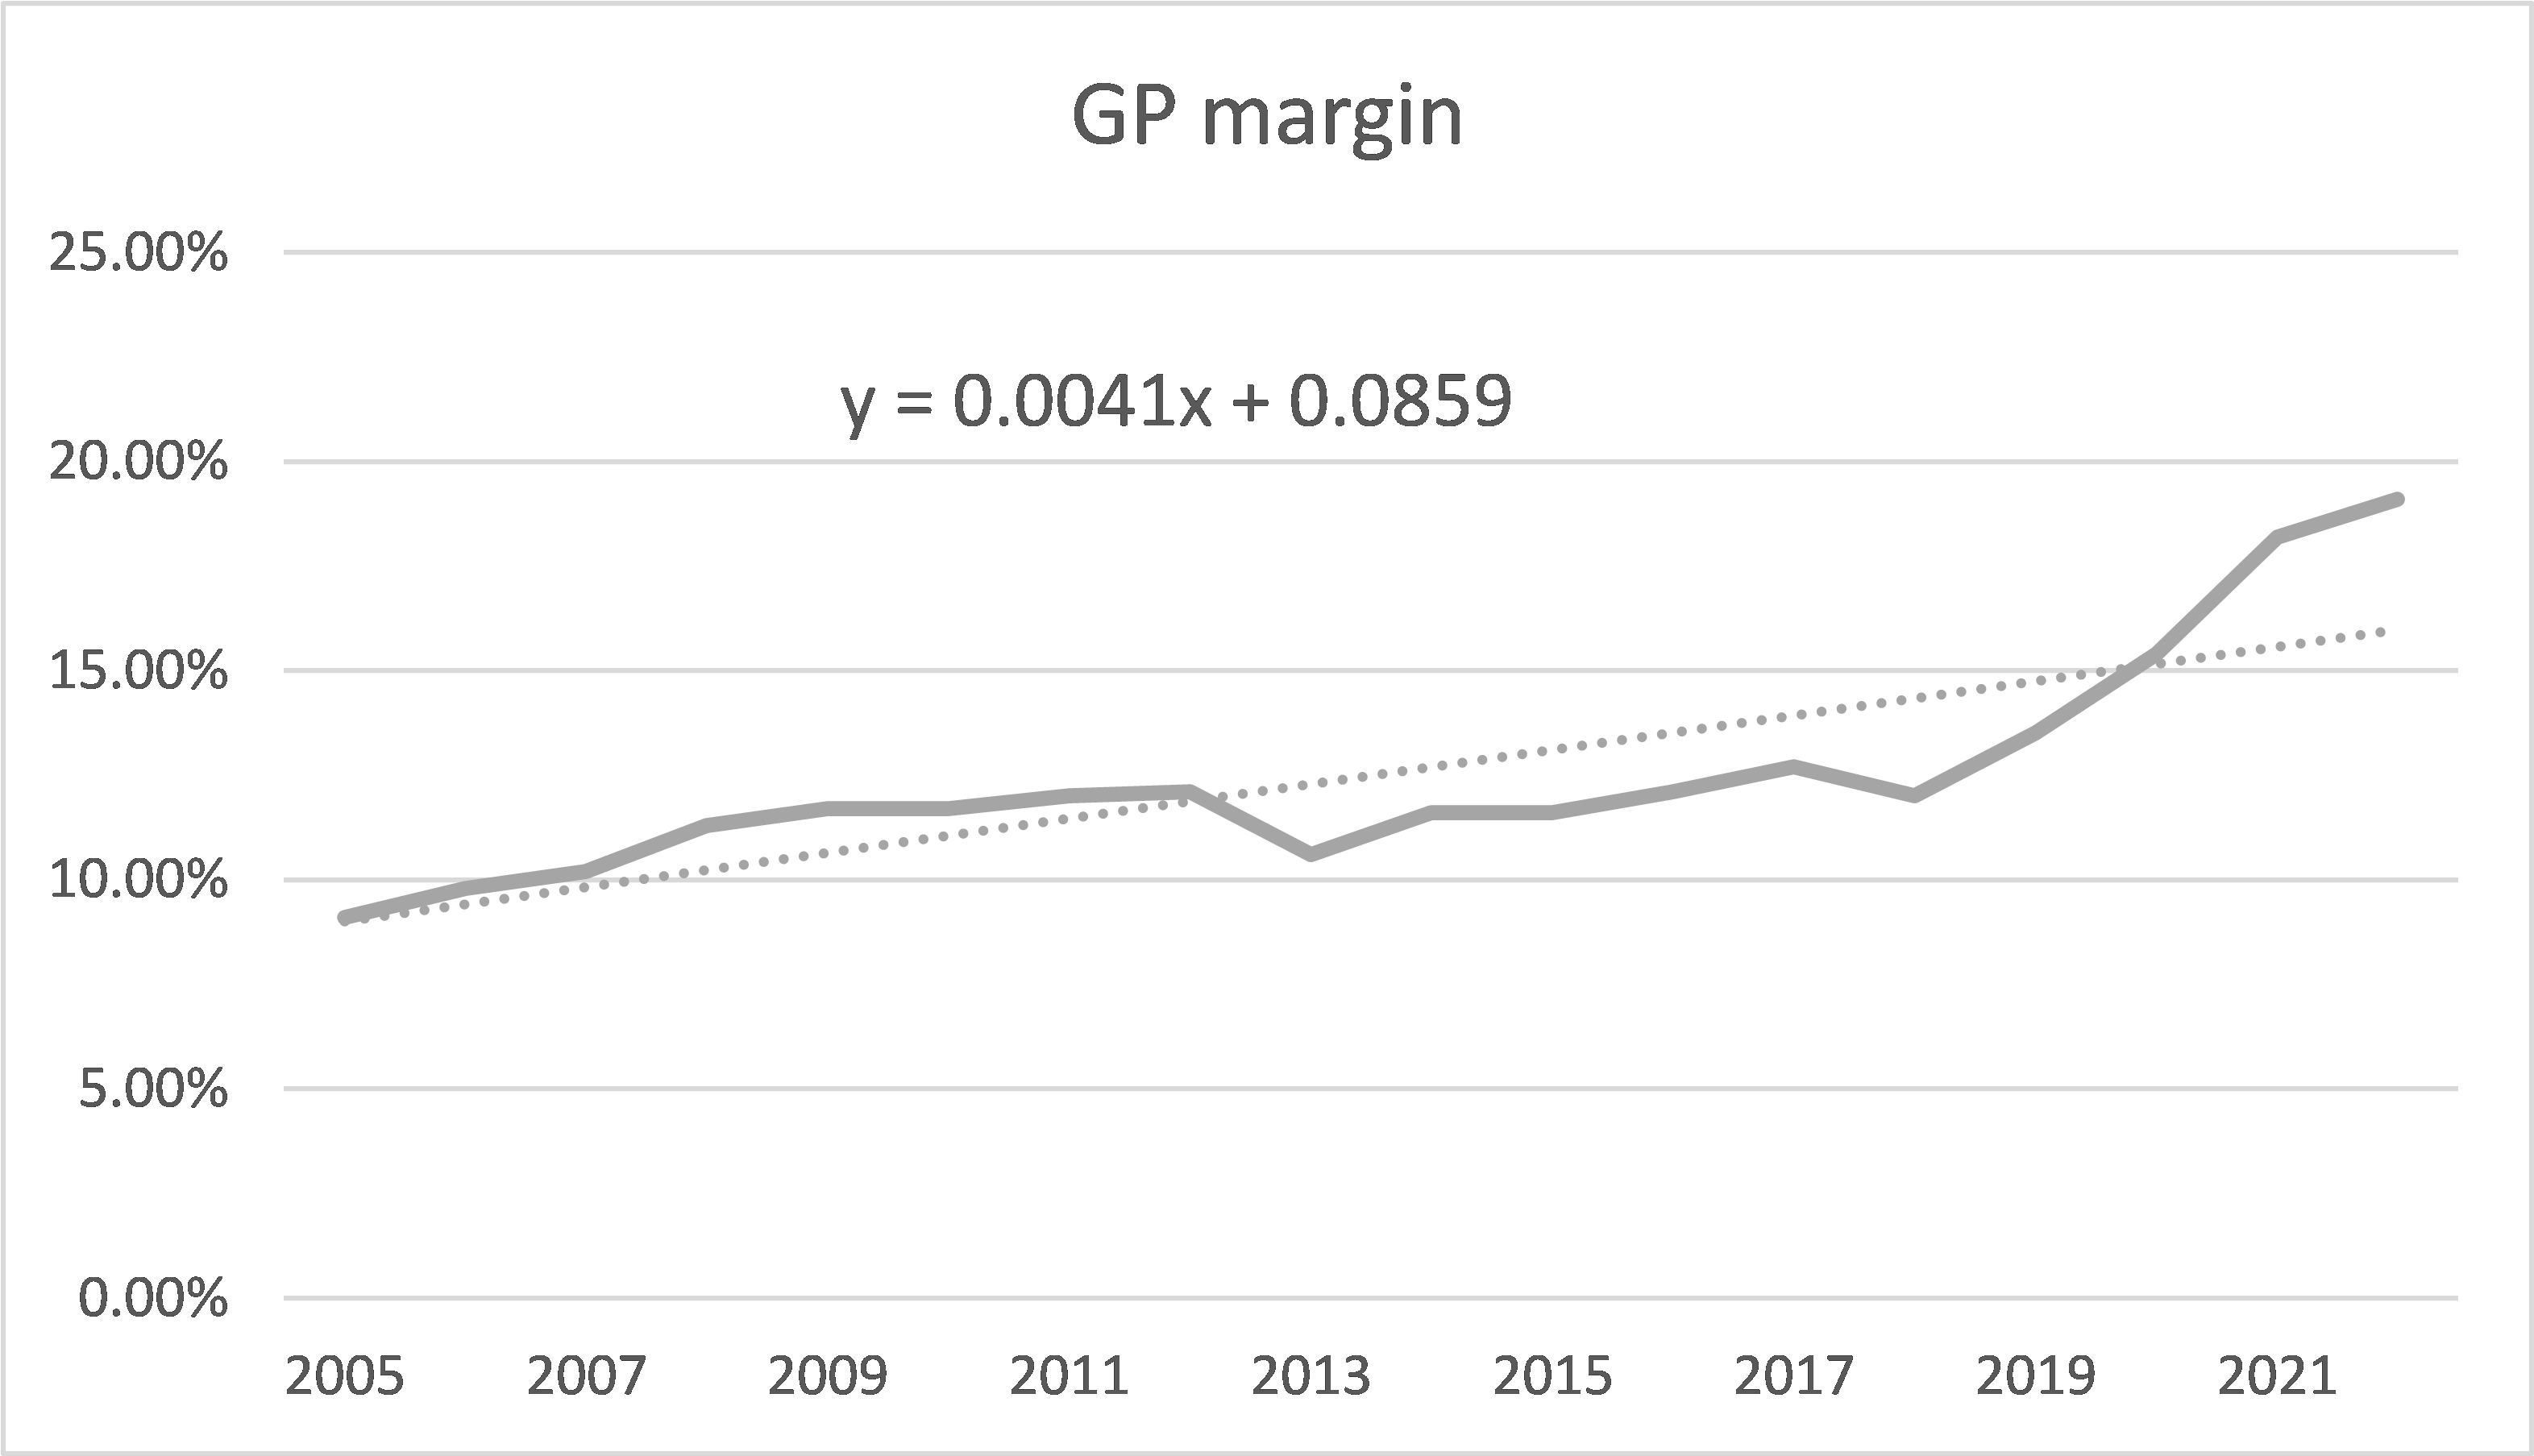
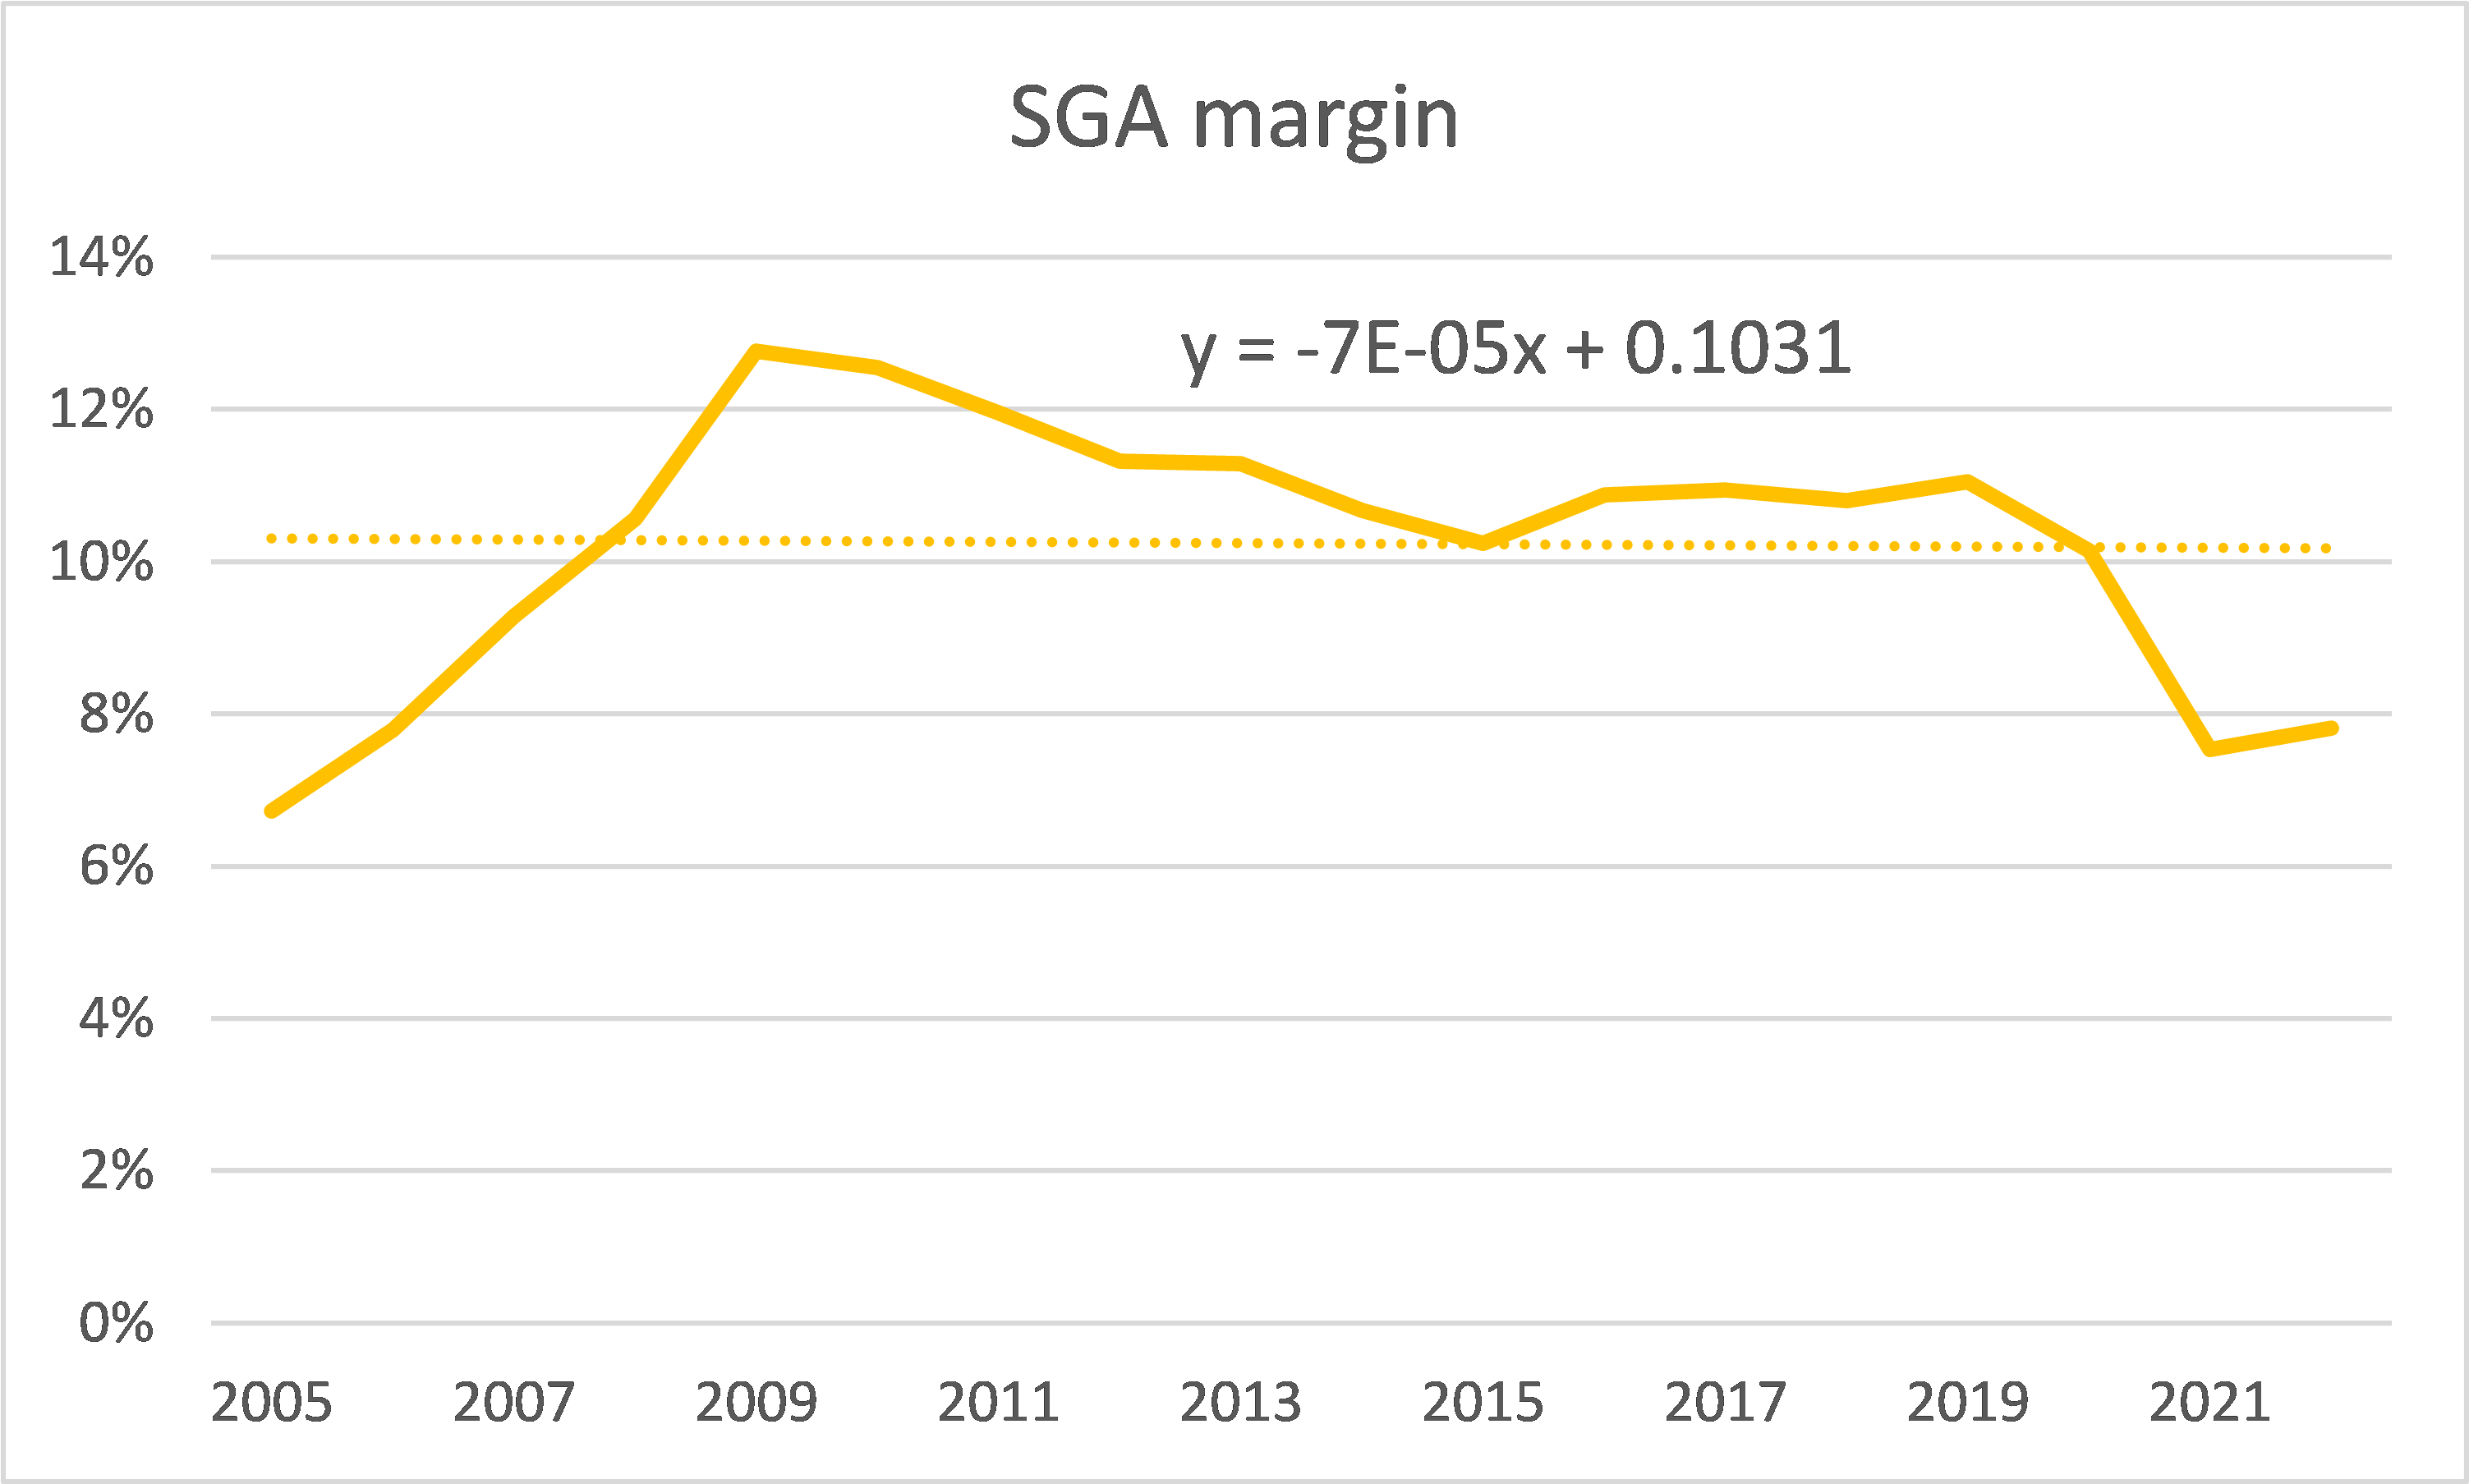
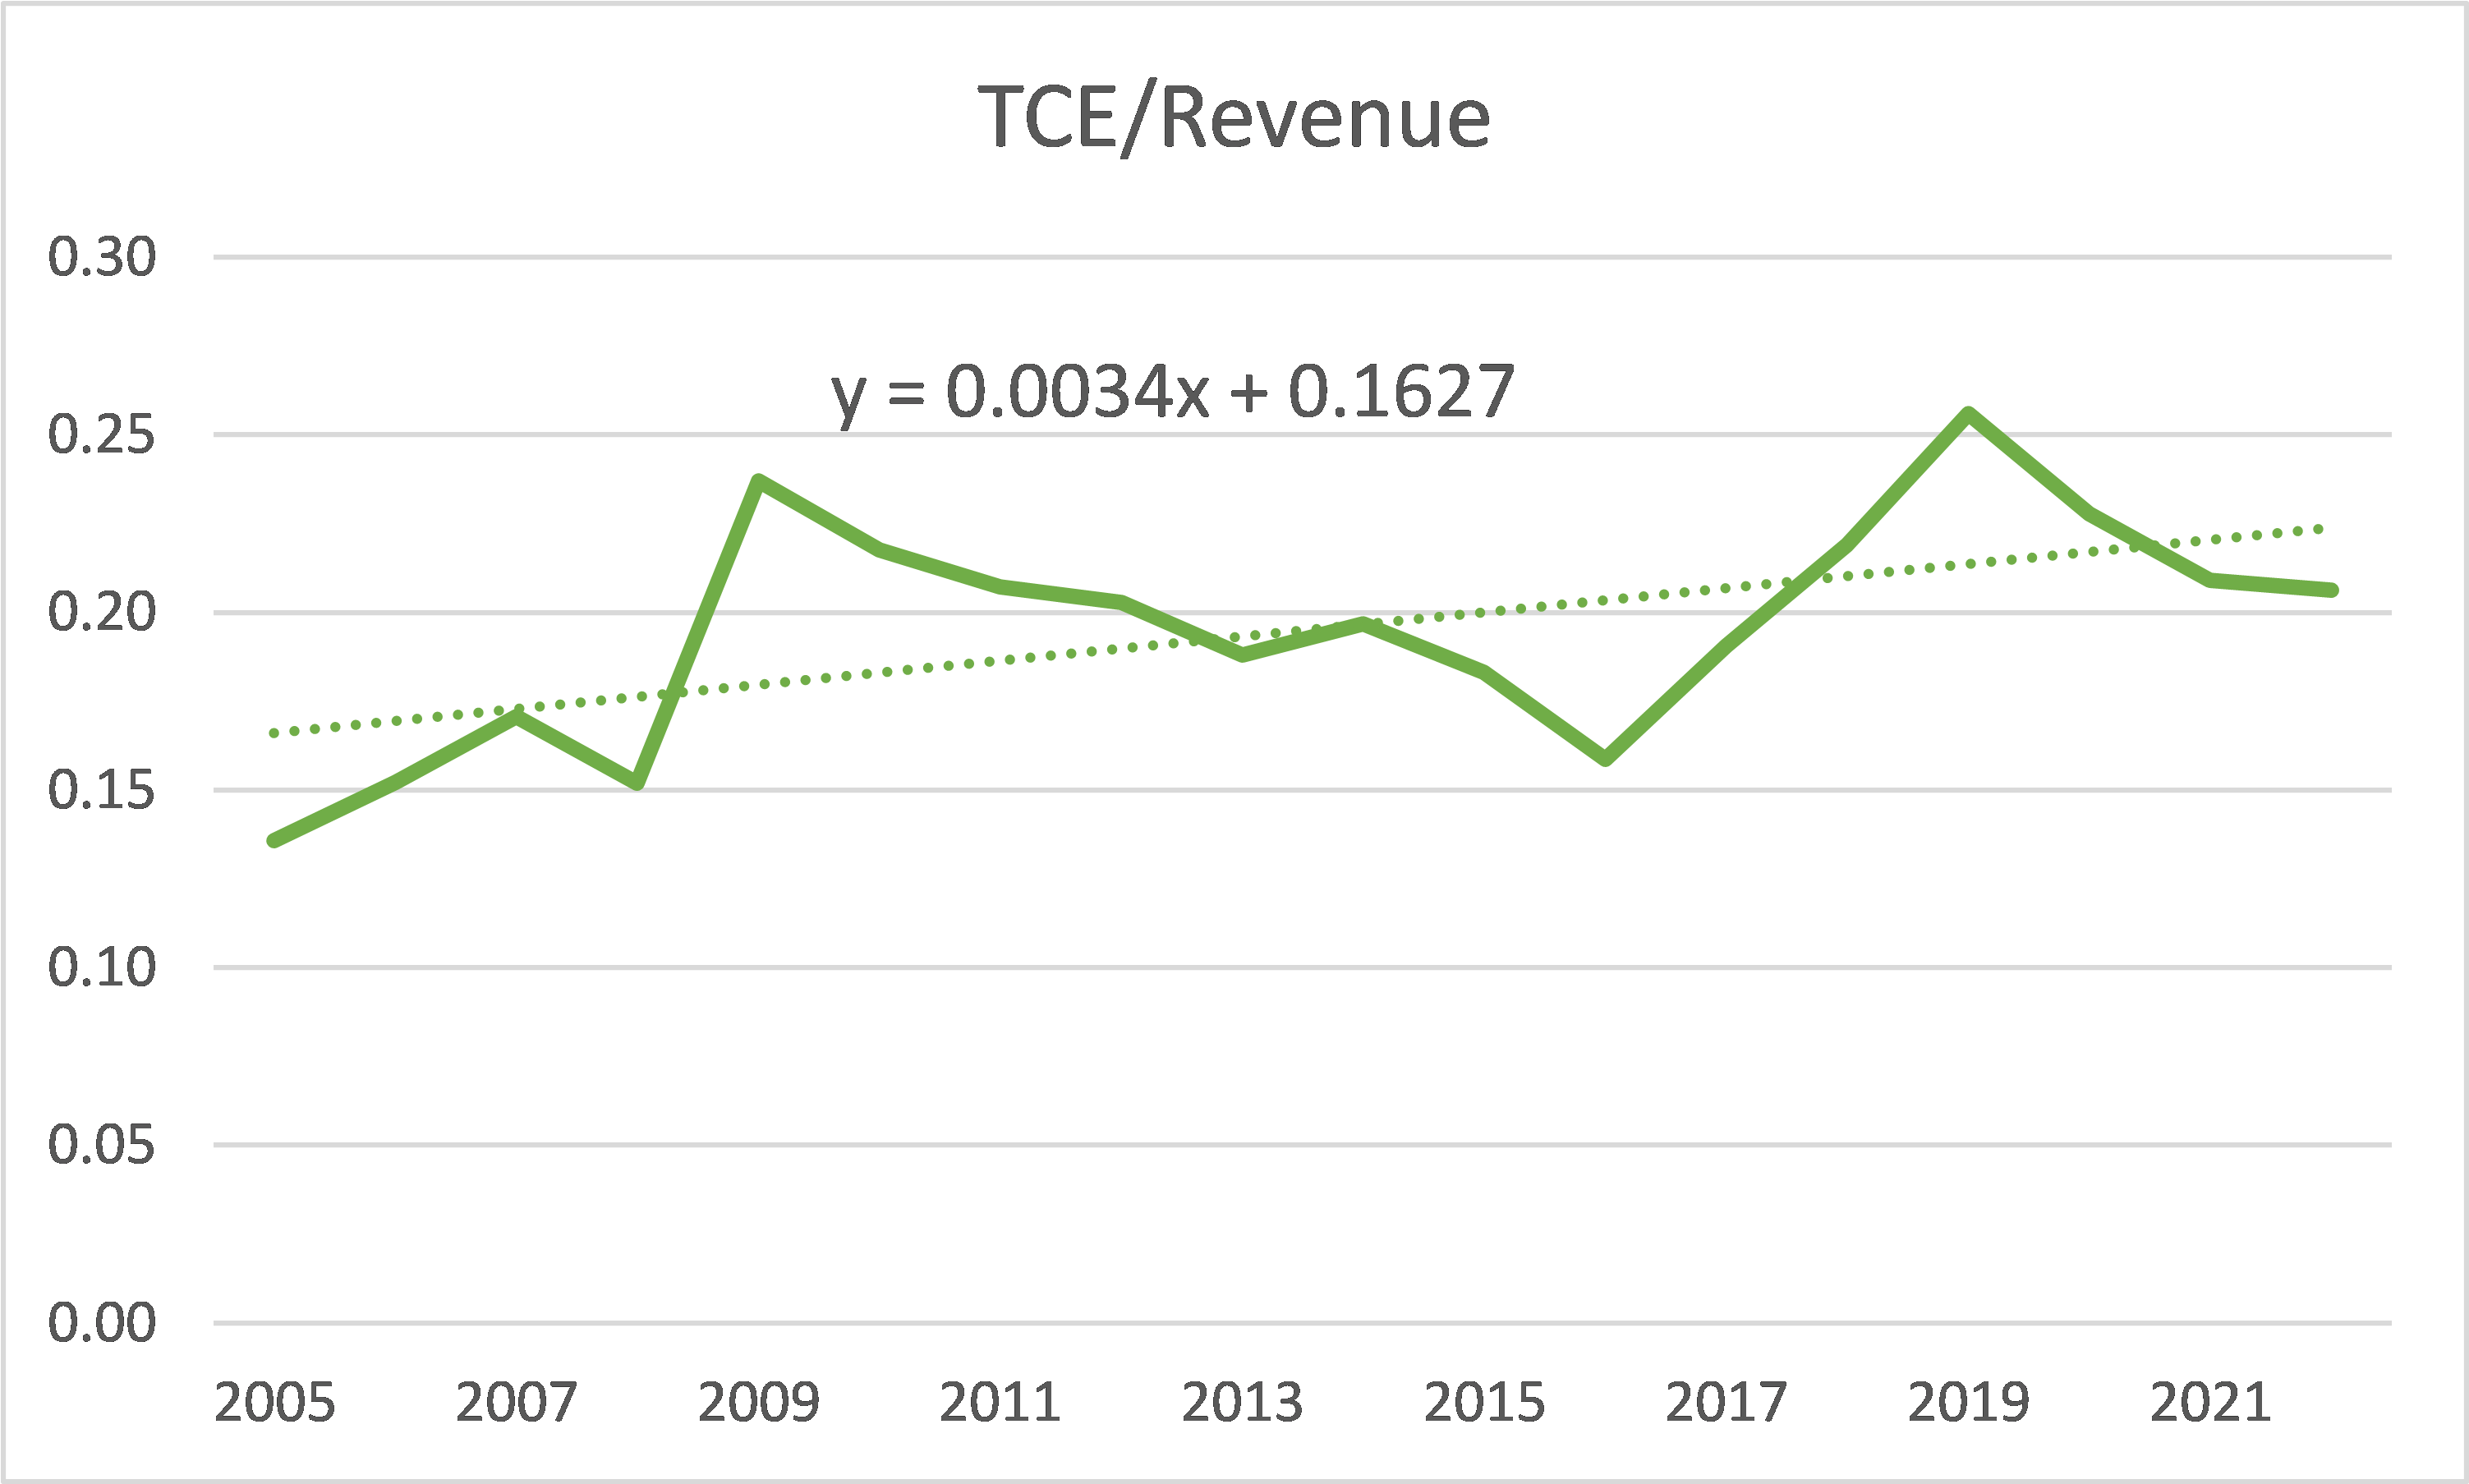
To illustrate this point, I plotted the 2005 to 2022 performance for these 3 metrics. I then used the EXCEL Trendline function to determine the best-fit straight line. Refer to Charts 5 to 7.
You can see improvements in the gross profit margin and SGA margin. However, the Capital to Revenue ratio decreased i.e. as time went by more Capital was required to generate the same Revenue.
To get the USD 80 per share market price, I had to use the derived 2015 values (of "x" = 11 in the equations) for the 3 metrics.
It is obvious that if I used the derived values based on post-2015, there will always be a margin of safety. But this is not recognizing BXC as a cyclical company.
Chart 5: Gross Profit Margin (Author) Chart 6: SGA Margin (Author) Chart 7: TCE/Revenue (Author)
Note to Chart 5 to 7: The "x" in the equation refers to the number of years relative to 2005. Thus 2005 = 1, and 2010 = 6.
Limitations and risks
It is obvious that the value of BXC will depend on what is assumed as the cyclical values. I have shown that basing them on the last peak-to-peak or trough-to-peak periods do not provide any margin of safety.
The analyses showed that for any margin of safety, you have to ignore the cyclical perspective.
When interpreting my results, you should be aware of the following 2 issues - WACC and the correlation.
WACC
In my model, the WACC was assumed to be 9.44 %. In deriving these, many of the sources used the current risk-free rate.
I am looking at either the 2005 to 2022 period or the 2010 to 2022 period to determine the cyclical values. For consistency, I should also l use the WACC over the same periods.
The average risk-free rate over these periods would be lower than the current rate. At the same time, instead of using the current risk premium, we should also use the risk premium over the cycle.
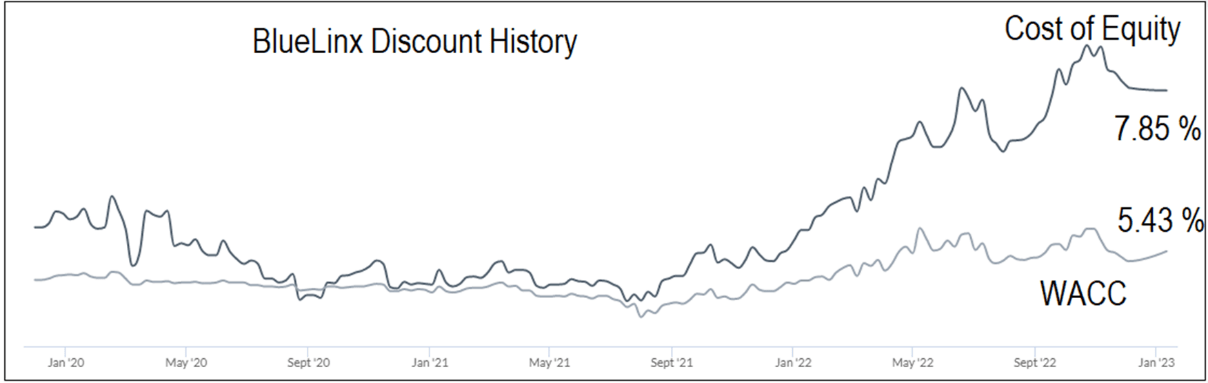
My point is that the WACC used is probably on the high side. You can see this illustrated in Chart 8. If I factor this in, my current valuation is on the low side.
For example, if I assumed that the WACC is lower by 20% and all things been equal, the Intrinsic Value is US 87 per share. This is based on the 2005 to 2022 average values for the 3 metrics.
Chart 8: BXC Historical Discount (Alphaspread)
Note to Chart 8: The values shown in the Chart refer to the latest value. Source: Alphaspread
Correlation
In my analysis, I had assumed that all of BXC revenue is linked to the Housing Starts. If you look at the correlation results in Table 3, you will see that for most of the period, the Housing Starts explained bit more than half of the performance. (Note that this is based on the square of the correlation).
In other words, there are other factors that accounted for BXC revenue. These could be new products, business acquisitions or improvements in the operations. I would rely on the margin of safety as the mitigation measures.
Conclusion
There are two issues here. BXC may not be as strong fundamentally as suggested by the past 2 years' performance.
Secondly, BXC is a cyclical company and any valuation should be based on its performance over the cycle. While used a DCF model to estimate the Intrinsic Value, the same concept applies even if you are using multiples. In other words, the earnings or cash flow for the multiple should be based on the cyclical values.
The real valuation challenge is then what to use as the cyclical values. I have shown that if you use the historical averages, there is no margin of safety.
But if you ignore the cyclical picture and use some projected values, you can have a margin of safety. The real question is whether it is appropriate to use such projected values for cyclical companies.
In this context, I would like to refer to what Damodaran said about the performance of cyclical companies. If you accept BXC as a cyclical company, you have to be consistent and follow the cyclical values.
On such a basis, I concluded that there is no margin of safety for BXC. The market is pricing BXC as if it is not a cyclical company.
I have mentioned about the limitations of my analysis. For example a 20 % lower WACC could match the current market price. My point is that even with this, there is not enough margin of safety.
From a conservative perspective, I would not invest in BXC currently.
For further details see:
BlueLinx: The Market Is Not Pricing This As A Cyclical Company