BCC - Boise Cascade Benefited From High Product Prices. But This Is Not Sustainable
2023-11-02 12:14:42 ET
Summary
- BCC's growth in PAT over the past decade was driven mostly by the past 2 years' outlier product prices, which have since declined.
- The company is fundamentally sound with strong financials, but I have concerns about its operating efficiencies. It is not a high growth company.
- BCC is a cyclical company heavily influenced by the housing sector, and valuations based on probability-weighting the outlier prices show no margin of safety.
Investment thesis
Boise Cascade Company’s ( BCC ) PAT in 2022 was about 7 times larger than that in 2013. But this growth was mostly driven by outlier product prices over the past 2 years. Product prices have declined since then.
The company is fundamentally sound with good returns, strong financials, and sustainable Reinvestment rates. But it is not a high-growth company and I have concerns about its operating efficiencies.
BCC is also a cyclical company. A valuation on such a basis taking into account the outlier price spike showed that there is no margin of safety.
Business background
BCC is one of the largest producers of engineered wood products and plywood in North America. It is also a leading U.S. wholesale distributor of building products. This is a US-centric business with about 98 % of the 2022 revenue from the US.
The company IPO in 2013 and as such I based my analysis from 2013 to 2022.
The company has 2 reportable segments with a high degree of vertical integration.
- Wood Products. This segment manufactures laminated veneer lumber ((LVL)), I-joists, and laminated beams.
- Building Materials Distribution ((BMD)). This segment operates a nationwide network of distribution facilities that sell a broad line of building materials, including oriented strand board, plywood, and lumber. This segment is the largest customer of its Wood Products segment.
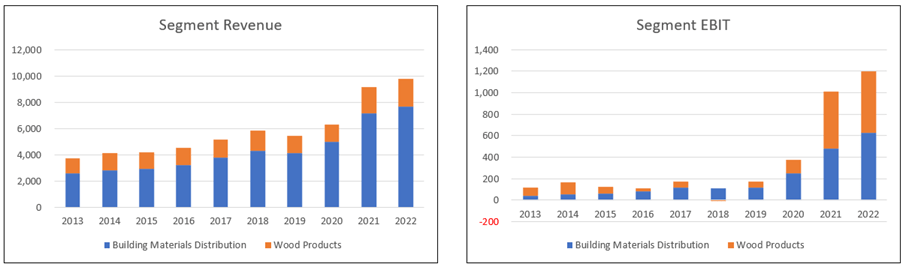
The BMD segment is the larger revenue and earnings contributor as can be seen from Chart 1. In 2022, it accounted for about ¾ of the company's revenue and about half of its earnings.
Chart 1: Revenue and Earnings Trends (Author)
Cyclical sector
BCC products are used in the construction of new residential housing. We know that the housing sector is cyclical and as such I would consider BCC a cyclical company.
From 2013 to 2022, there was a 66 % correlation between the US Housing Starts and BCC's revenue. This meant that Housing Starts explained about half of the variation in BCC's revenue.
You may think that this is a low correlation. One reason is that while Housing Starts are measured in physical units, BCC's revenue has both a volume and price component.
Wood product prices over the past 2 years have been exceptionally high as can be seen from Chart 2. When I washed out the effect of the price changes over the past 10 years, the correlation increased to 82 %.
Note: To wash out the price changes, I estimated the revenue from 2013 to 2022 at 2013 prices. To determine this constant 2013 price picture, I divided the segment revenue for each year by the respective average product prices. For the BMD segment revenue, I used the reported 3/8” plywood average selling prices. For the Wood Products segment revenue, I used the reported average LVL and I-joists prices.
Chart 2: Wood product prices from 2013 to 2023. (FRED)
Valuation of cyclical companies
Damodaran opined that cyclical companies’ performance depends on where they are in the cycle. Extrapolating the performance based on the current earnings can lead to misleading valuations.
To overcome the cyclical issue, we have to normalize the performance over the cycle. To reflect the current size of the business, Damodaran suggested that we should take the current revenue and determine the earnings by multiplying it with the normalized margins.
However, there are several challenges to doing this for BCC.
- Its 2022 dollar-revenue reflected not only a larger company compared to that in 2022, but also an outlier product price situation. I had to first wash out the price effect to estimate its current size.
- The 2021 to 2022 product prices appear to be outlier prices. In the long run, prices would revert to their “non-outlier” situation. I thus used some probability-weighted values to represent the long-run picture.
Operating trends
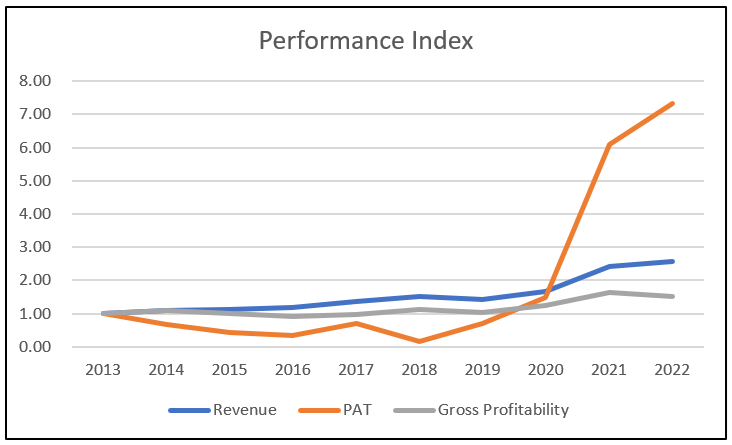
I looked at 3 metrics to get an overview of the overall performance – revenue, PAT, and gross profitability (gross profits / total assets). Refer to Chart 3.
Over the past 10 years, there were growth trends in the 3 metrics.
PAT in 2022 was about 7 times larger than in 2013, while revenue was only 2 ½ times larger. The higher PAT growth was attributed to the growth in gross profit margins. This increased from an average of 40 % in 2013/14 to an average of 61 % in 2021/22.
Given the increase in the gross profit margins and revenue, you should not be surprised to see the uptrend in the gross profitability.
But do not be misled by the results. If you ignore the past 2 years' outlier price situation, the gross profitability in 2019/20 averaged 44 % compared to the 2013/14 average of 40%. Not exactly a fantastic improvement.
Chart 3: Performance Index (Author)
Note to Chart 3:
a) To plot the various metrics on one chart, I have converted the various metrics into indices. The respective index was created by dividing the various annual values by the respective 2013 values
b) The relative decline in PAT in 2018 was due to the one-off accelerated depreciation of a curtailed facility and impairment charges.
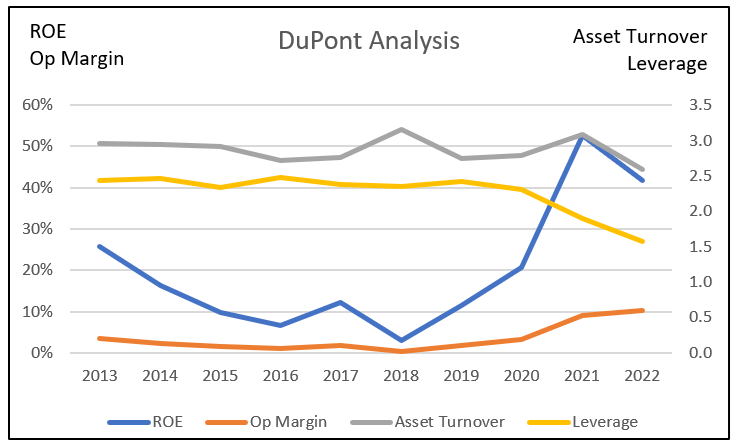
We see a similar dismal picture in the ROE as per the DuPont analysis in Chart 4. The ROE jumped over the past 2 years due to the improved operating margin. But if you ignore the past 2 years' results, you can see that the ROE was lower than that in 2013 for all the years.
From 2013 to 2022, there were hardly any improvements in the operating margin, asset turnover, and leverage. It is ironic that in many of its Annual Reports, the company talked about improving efficiencies.
Looking at Charts 2, 3, and 4, I would say that the better operating metrics over the past 2 years because of high product prices. It was due more to external factors rather than management efforts.
Chart 4: DuPont Analysis (Author)
Year-to-date Q3 2023
In the 9 months ended Sep 2023, revenue decreased by 23 % compared to that for the same period in 2022. For the same period, PAT decreased by about half compared to that for the first 9 months of 2022.
According to the company, the decrease in sales was driven by the reduction in selling prices and volumes. On a year-to-date basis through September 2023,
- Total Housing Starts decreased 12% resulting in lower sales volume by the company.
- Average composite lumber and average composite panel prices were 52% and 40% lower.
- There were lower selling prices for the engineered wood products.
In the context of long-term cyclical performance, I consider quarterly results as “noisy”. I pay less attention to them compared to the longer-term trends.
Growth
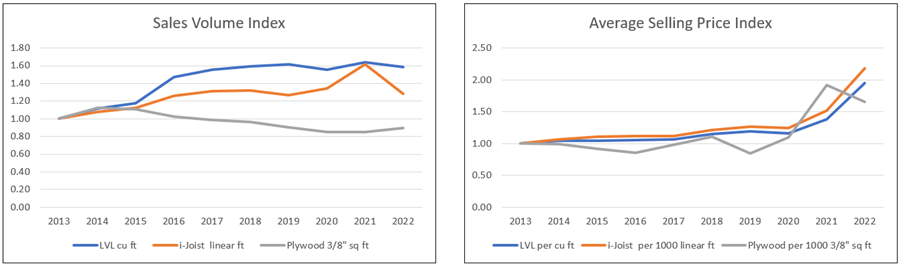
Over the past 10 years, revenue grew at 11.0 % CAGR. You can see from Chart 5 that this growth came from both volume growth as well as price growth.
On a 2013 constant price basis, revenue grew at 4.7 % CAGR. Price growth contributed a bit more to the overall revenue growth. Given the past 2 years outlier prices, I would not consider BCC as a high growth company.
Chart 5: Revenue components (Author)
Note to Chart 5: To enable the trends to be seen clearly, I plotted the metrics in index format. The respective index was created by dividing the various annual values by the respective 2013 values.
The volume growth came from a combination of acquisitions and organic growth.
- The jump in the LVL and I-joists volume in 2016 was due to the acquisitions of 2 engineered wood products facilities.
- The decline in the plywood volume is in line with its strategy of diverting its production away from plywood to engineered wood products.
- The company attributed the reduction in I-joists volume in 2022 due to the decline in Housing Starts and significant customer inventory destocking.
Over the past 10 years, BCC spent USD 816 million on CAPEX and USD 875 million on cash acquisitions. Using these as the basis, I would conclude that acquisition accounted for about half of the growth. If nothing else this suggests that it is a mature sector.
Reinvestments
Growth needs to be funded and one metric for this is the Reinvestment rate. This is defined as:
Reinvestment with acquisitions = CAPEX & Acquisitions – Depreciation & Amortization + Net Changes in Working Capital.
I then determined the Reinvestment rate = Reinvestment / after-tax EBIT.
Acquisitions are an integral growth driver for the company. As such I have included the annual acquisition expenditure as part of the CAPEX.
Over the past 10 years, the total Reinvestment amounted to USD 1.1 billion. The after-tax EBIT for the same period came to USD 2.5 b. This resulted in a Reinvestment rate of 44 %.
There is another perspective on the Reinvestment rate that is derived from the fundamental growth equation:
Growth = Return X Reinvestment Rate
Return = EBIT(1-t) / TCE
TCE = Total capital employed = Total equity + total debt – cash
I estimated the annual return on this basis. The average return from 2013 to 2022 came to 23.1 %.
Taking the historical growth as 11.0 % and the Return as 23.1 %, the fundamental Reinvestment rate = 11.0 / 23.1 = 48 %.
Comparing the historical 44 % and the 48 %, I would conclude that management had been a good capital allocator.
Did growth over the past 10 years create shareholders’ value? For growth to create shareholders' value, the returns have to be greater than the cost of funds.
Over the past 10 years, the average return as measured by EBIT(1-t) / TCE was 23.1 %.
As can be seen from Table 1, this 23.1 % far exceeded the weighted average cost of capital of 9.5 %. Even if you ignored the past 2 years' outlier results, the average return was 14.0%.
Table 1: Estimating the Cost of Capital (Various)
Note to Table 1: Based on the Google search for the term “BCC WACC”
Financial position
I would assess BCC as financially sound based on the following:
It has a 0.23 Debt Capital ratio as of the end of Jun 2023. As per the Damodaran Jan 2023 dataset , the Debt Capital ratio for the paper and forest product sector was 0.30. It was 0.23 for the construction supplies sector.
As of the end of June 2023, it had USD 1.3 billion in cash and equivalents. This was about 35 % of its total assets.
Over the past 10 years, it generated positive cash flow from operations every year. Over this period, it generated about USD 2.9 billion in cash flow from operations compared to its PAT of USD 2.2 billion. This is a good cash conversion ratio.
BCC has a good capital allocation track record as can be seen in the following section.
Capital allocation
Over the past 10 years, BCC generated about USD 2.9 billion of funds from cash flow from operations. Refer to Table 2.
You can see that the cash flow from operations was sufficient to fund the dividends & buybacks as well as CAPEX and acquisitions. It also enabled the company to increase its cash.
Given the 44% historical Reinvestment rate and the built-up in cash, I would consider BCC a cash cow.
Table 2: Sources and Uses of Funds (Author)
Valuation
I do not consider BCC a high-growth company. As such I valued it based on a single-stage Free Cash Flow to the Firm (FCFF) model as represented by:
Value of firm = FCFF X (1 + g) / (WACC – g).
FCFF = EBIT(1-t) X (1 – Reinvestment rate).
Because of the past 2 years outlier price situation, I broke down the valuation into 2 components:
- The “non-outlier price” situation as represented by the 2013 to 2020 performance.
- The “outlier price” situation is represented by the 2021 and 2022 performance.
The long-term value of BCC is some probability-weighted scenario. I assumed that there was a 90 % probability of the non-outlier scenario and a 10 % probability of the outlier scenario. I guesstimated this probability by looking at the past 10 years' performance.
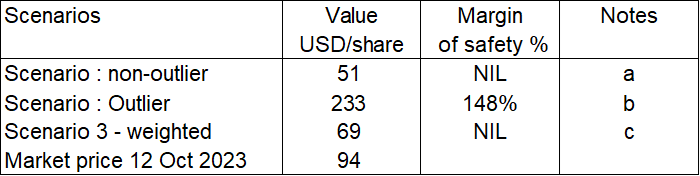
The results of the valuation are shown in Table 3. There is only a margin of safety under the outlier price scenario. We know that this cannot be representative of the future. Rather the weighted scenario is more realistic. On such a basis, there is no margin of safety.
Table 3 Summary of valuation (Author)
Notes to Table 3.
a) 2013 to 2020 average values.
b) 2021 to 2022 average values.
c) Weighted average with 90% probability of the non-outlier scenario and 10 % probability of the outlier scenario.
Valuation model
The valuation model had to address the following challenges:
- BCC today is much larger than what it was in 2013.
- The past 2 years' product prices were outliers.
- BCC is a cyclical company and we have to normalize its performance over the cycle.
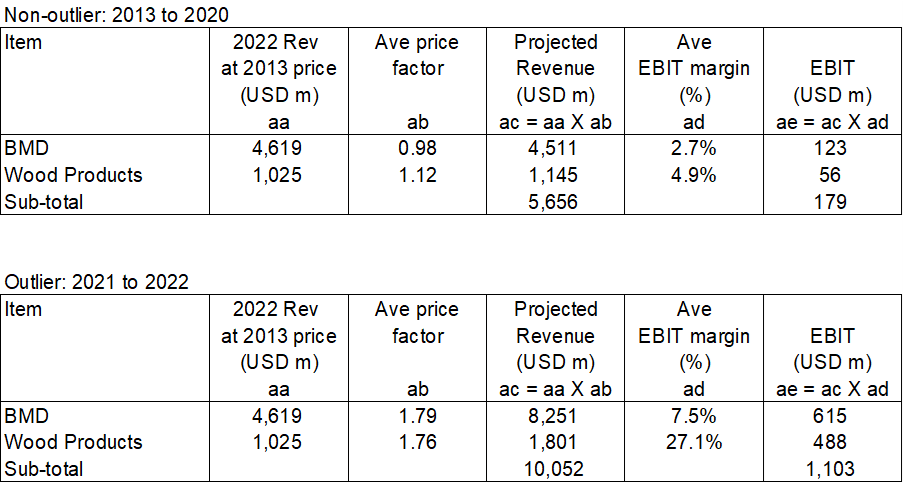
To address the first issue, I estimated the current revenue at 2013 prices. This is equivalent to estimating the “notional volume”. Refer to item “aa” of Table 4.
The next step was to determine the price changes since 2013. At the same time. I had to consider the cyclical situation. I used the average annual price relative to 2013 as the basis to determine the scenario price factor. Refer to item “ab” in Table 4.
- For the non-outlier scenario, I used the average 2013 to 2020 prices.
- For the outlier scenario, I used the average 2021 to 2022 prices.
Based on the “notional volume” and price factor, I then determined the revenue. Refer to item “ac” in Table 4.
The normalized EBIT margin was similarly estimated for the non-outlier and outlier cases. These were based on the data provided in the various segment reports. Refer to item “ad” in Table 4.
Finally, I determined the EBIT as per item “ae” in Table 4.
Table 4: Estimating the EBIT (Author)
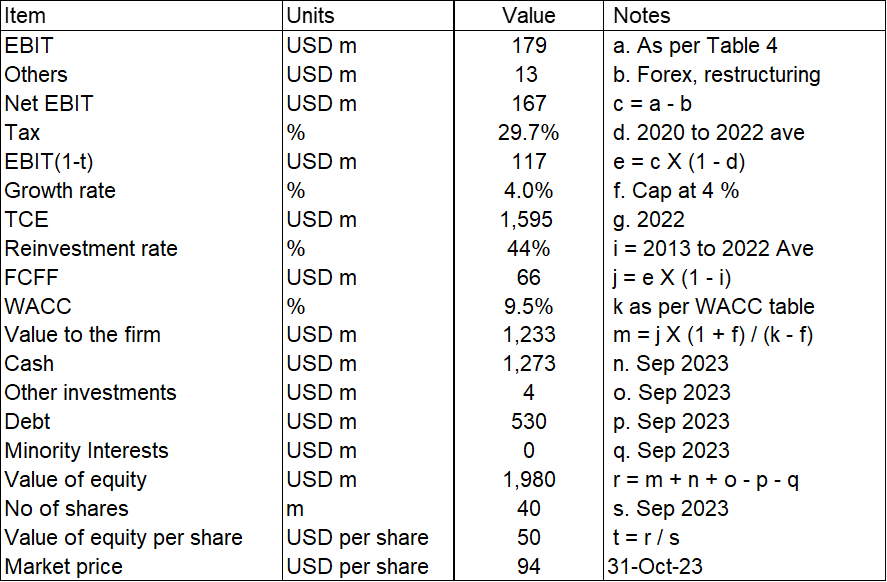
A sample calculation is shown in Table 5. Most of the items in Table 4 are self-explanatory except for the following:
Item b. This is to account for the past 10 years' forex and other costs such as restructuring and asset write-downs.
Item d. Tax rate. I assumed the 2020 to 2022 average rates
Item f. Growth rate. I assume that it was 4% based on the long-term US GDP growth rate.
Item i. Reinvestment rate. I assumed the historical rate.
Item r. Value of equity = Value of the firm less Debt and Minority Interests plus Non-operating assets such as Cash and Other Investments.
Table 5. Sample calculation of the intrinsic value (Author)
Risks and limitations
There are 3 critical assumptions in my valuation:
- Estimating the revenue at 2013 constant prices.
- 2013 to 2022 to represent the cycle.
- Probability of the outlier scenario
My valuation model hinges on determining the revenue based on a “notional volume” multiplied by a price factor. The notional volume was estimated by estimating the revenue for the various years at the 2013 constant price.
To determine the constant price for the 2 business segments, I used the LVL, i-joists, and plywood prices. The constant revenue picture would be different if I had used different product prices. For example, I could have used the FRED plywood and lumber prices instead. The only way to mitigate this is to look for high margins of safety.
In my valuation, I took the average values from 2013 to 2022 to represent the cyclical performance. However, I have shown that there is a strong link between BCC's revenue and Housing Starts.
Shouldn’t it be more appropriate to look at the Housing Starts cycle with 2005 to 2022 (latest peak-to-peak) as the cycle period? Unfortunately, BCC IPO in 2013, and there is not enough ready data to cover this period.
The 2013 to 2022 only covered the uptrend part of the Housing Starts cycle. As such I may have over-estimated the intrinsic value.
Finally I used a 10% probability for the outlier price situation. The margin of safety will change with the probability. The market price is equal to about a 23 % likelihood of the outlier price scenario. Based on the past 20 to 30 years product price trends, this 23 % seem very unlikely. But your guess is as good as mine.
Conclusion
BCC is a reasonably sound company from a fundamental perspective considering its pros and cons. The positive points are:
- It is financially sound. I would even consider it as a cash cow.
- It delivered returns that were greater than its cost of funds.
- It had a historical Reinvestment rate that is close to that based on the fundamental growth equation.
On the negative side, there were not significant improvements in the operating efficiencies. Its double-digit growth over the past 10 years was due more to external price increases over the past 2 years.
However, a valuation based on its performance over the cycle did not provide any margin of safety.
I would like to highlight that I have looked at BCC several times over the past 2 years at various price points. While I have looked at its performance from different perspectives, they all point to sound fundamentals. The company today seemed to have addressed some of my earlier concerns.
But the margin of safety depended on the price points. I have used different valuation methods to estimate the intrinsic value. Refer to the following (with the oldest last in the list):
- Boise Cascade Is A Cyclical Stock - Value It As Such
- Boise Cascade - The Risk Is In The Valuation
- Boise Cascade: Better Prospects But Still Not Time To Buy
- Boise Cascade: Overpriced And A Potential Value Trap
In my last article " Boise Cascade Is A Cyclical Stock - Value It As Such" in Dec 2022, I had concluded that there was a margin of safety. But it was then trading at USD 76 per share. It is today trading at USD 94 per share.
Moral of the story? BCC is a cyclical company and there will be repeated opportunities to invest as it goes through the performance cycle. So wait.
I am a long-term value investor and my analysis and valuation are based on this perspective. This is not an analysis for those hoping to make money over the next quarter or so.
For further details see:
Boise Cascade Benefited From High Product Prices. But This Is Not Sustainable