PLAN - Bonhoeffer Capital Management Q2 2023 Letter
2023-10-11 11:45:00 ET
Summary
- The Bonhoeffer Fund, LP, is a value-oriented investment partnership. The fund's objective is to grow capital at a faster rate than market indices over full market cycles and provide minimal.
- Bonhoeffer Fund's investment portfolio consists of value-oriented special situations and growth-oriented firms with active capital allocation.
- Bonhoeffer Fund is investigating consolidation plays in industries with attractive returns on invested capital.
- We include a case study on Academy Sports and Outdoors, highlighting its growth plan and potential for high returns.
Dear Partner,
While this letter serves as an overdue report on the Bonhoeffer Fund’s activities in the second quarter of 2023, I will be addressing two timely subjects: (1) the incorporation of changes into our value investing framework (The Second Dimension of Valuation); and (2) a profile of Henry Singleton, CEO of Teledyne, whom Warren Buffet described as the best capital allocator he knew.
Bonhoeffer Fund Portfolio Overview
Bonhoeffer’s investment portfolio consists of value-oriented special situations, as well as growth oriented firms that exhibit unique qualities when applying a value framework. We are particularly interested in companies that generate growth through organic growth, transition, and consolidation. We also like to see active capital allocation through funding organic growth, opportunistic buybacks, and synergistic acquisitions. An example of a capital-allocation master is Henry Singleton, described in the profile below. There were modest changes within the portfolio in the second quarter, which is in line with our low historical turnover rates. We sold some of our slower-growing investments and invested some of our cash into Academy, described in the detailed case study in the appendix.
As of June 30, 2023, our largest country exposures include: United States, South Korea, United Kingdom, Philippines, South Africa, and Latin America. The largest industry exposures include: distribution, telecom/media, real estate/infrastructure, and consumer products.
We are investigating additional consolidation plays with modest valuations in industries that have attractive returns on invested capital such as specialized construction, chemicals, leasing, distributors, housing, and specialty finance.
Compound Mispricings (29.6% of Portfolio; Quarterly Average Performance -14.4%)
Our Korean preferred stocks and the nonvoting shares of Wilh. Wilhelmsen ( WLLSF ) all feature characteristics of compound mispricings. The thesis for the closing of the voting, nonvoting, and holding company valuation gap includes evidence of better governance and liquidity. We are also looking for corporate actions such as spinoffs, sales, or holding company transactions and overall growth.
Lotte Chilsung is a compound mispricing which has become more interesting as its price has increased less than its NAV. The company includes stakes in the largest beverage company in South Korea and a large land block in Gangnam, Seoul, South Korea. Analyst estimated earnings are projected to increase by 14% per year over the next four years (EBITDA has grown by 13% per year since the 2017 corporate restructuring) and preferred shares have a dividend yield of 5% for a total return of 19%, assuming no reduction in discount to NAV or changes in multiples. Below is the RoIIC analysis for Lotte Chilsung before and after the 2017 restructure.
| Lotte Chilsung |
| Corp Restructure |
| 2012 |
| 2013 |
| 2014 |
| 2015 |
| 2016 |
| 2017 |
| 2018 |
| 2019 |
| 2020 |
| 2021 |
| 2022 |
| Capital Invested |
| 120.7 |
| 214.4 |
| 288.4 |
| 236.9 |
| 348.6 |
| 291.1 |
| 229.5 |
| 139.4 |
| 115 |
| 130.6 |
| 152.3 |
| 2-yr sum |
| 502.8 |
| 525.3 |
| 585.5 |
| 639.7 |
| 520.6 |
| 368.9 |
| 254.4 |
| 245.6 |
| 282.9 |
| 4-yr sum |
| 1088.3 |
| 1165 |
| 1106.1 |
| 1008.6 |
| 775 |
| 614.5 |
| 537.3 |
| CFO |
| 220.9 |
| 250 |
| 167.7 |
| 270.5 |
| 260 |
| 155.2 |
| 219.7 |
| 231.6 |
| 240 |
| 337.7 |
| 347.5 |
| 2yr change |
| -53.2 |
| 20.5 |
| 92.3 |
| -115.3 |
| -40.3 |
| 76.4 |
| 20 3 |
| 106.1 |
| 107.5 |
| 4yr change |
| 39.1 |
| -94.8 |
| 52 |
| -38.9 |
| -20 |
| 182.5 |
| 127.8 |
| 5-yr avg |
| 2-yr ROIIC |
| -10.6% |
| 3.9% |
| 15.8% |
| -18.0% |
| -7.7% |
| 20.7% |
| 8.0% |
| 43 2% |
| 38.0% |
| 20.4% |
| 4-yr ROIIC |
| 3.6% |
| -8.1% |
| 4.7% |
| -3.9% |
| -2.6% |
| 29.7% |
| 23.8% |
| 10.3% |
The returns on incremental capital have increased to the 20 to 40% range post restructuring which should provide a tailwind for increasing returns on capital going forward.
Below is an intrinsic value for Lotte Chilsung based on the value of the underlying subsidiaries they hold.
| Lotte Chilsung (?bn) |
| EBITDA |
| Multiple |
| Value |
| % of Value |
| Beverage & Liquor Ops |
| ?400 |
| 7.8 |
| ?3,110 |
| 76% |
| Gangnum Real Estate |
| ?950 |
| 23% |
| 50% of sale value |
| ?89,962 |
| Lotte Akhtar Beverage |
| ?48 |
| 1% |
| 52% of Akhar Beverage (October 2018) |
| Cash |
| ?269 |
| 3/2022 cash |
| Debt |
| -?1,379 |
| 3/2022 debt |
| Valuation (?bn) |
| NI (?bn) |
| ?2,399 |
| 100% |
| Hold co Disc |
| 20% |
| Shares ( M ) |
| ?128 |
| 10.560000 |
| Value Per Share |
| ?12,121 |
| NI Mult |
| ?227,156 |
| Discount |
| Common Shares |
| 10.7 |
| ?130,000 |
| -42.8% |
| 75% |
| Tang BV |
| ?703 |
| Ex Real Esate |
| Preferred Shares |
| 5.5 |
| ?66,900 |
| -65.5% |
| 190% |
| BV/Share |
| ?66,563 |
| RoTE |
| 18.2% |
| EBITDA Multiple |
| Upside |
| Tang BV |
| 7 |
| ?203,672 |
| 204% |
| PP&E |
| ?2,160 |
| 8 |
| ?233,975 |
| 250% |
| NWC |
| ?367 |
| 9 |
| ?264,278 |
| 295% |
| Debt |
| ?1,379 |
| 10 |
| ?294,581 |
| 340% |
| Tang BV |
| ?1,148 |
| BV/Share |
| ?108,712 |
| EBITDA Multiples |
| RoTE |
| 11.1% |
| Korean Alcohol Comps |
| 5.65 |
| Hite Jinro & Muhak |
| 7 |
| 4.3 |
| International Beverage Bottlers |
| 9.9 |
| Coca-Cola Cons, Coca-Cola Europacific, Coca-Cola FEMSA, Coca Cola Amatil, Arca Continental, Icecek Cola-Cola, Coca-Cola HBC |
| 6.7 |
| 13 |
| 8.3 |
| 14.7 |
| 8.2 |
| 8.9 |
| 9.6 |
Exclusive of excess real estate, Lotte Chilsung is generating returns on tangible equity of 18%, in line with the total expected returns above. In addition, Lotte Chilsung can be purchased for an earnings multiple of a little over 5x for the preferred shares.
Public LBOs (48.0% of Portfolio; Quarterly Average Performance 9.3%)
Our broadcast TV franchises, leasing, building products distributors, plastic packaging, and roll-on/roll-off ((RORO)) shipping fall into this category. One trend I find particularly compelling in these firms is growth creation through acquisitions which provides synergies and operational leverage associated with vertical and horizontal consolidation and the subsequent repurchasing of shares with debt. The increased cash flow from acquisitions and subsequent synergies are used to repay the debt and repurchase stock, and the process is repeated. The effectiveness of this strategy is dependent upon a spread between borrowing interest rates and the cash returns from the core business and acquisitions. Over the past 12 months, interest rates have been increasing, and this has reduced the economics of this strategy; but a large spread still exists if assets can be purchased at the right price. Increasing interest rates have affected the returns on public LBO firms.
Berry Global ( BERY ), a portfolio holding, is an example of a private LBO. Recently, an investor group, led by Canyon Capital, convinced management to focus on maximizing the efficiency of operations and buying back stock with its excess cash flow versus buying more businesses. This is the same strategy followed by Henry Singleton (described in the profile below), when buying back stock had better economics than engaging in mergers and acquisitions. Given Berry’s current valuation of a 13% earnings yield, buybacks are accretive, assuming no growth. The expected actual net income annual growth is expected to be between 4-5% over the next four years. Which would imply a 17-18% total return. Below is the history of Berry’s RoC and RoIIC.
| BERY |
| CEO change |
| Activist Board |
| 2012 |
| 2013 |
| 2014 |
| 2015 |
| 2016 |
| 2017 |
| 2018 |
| 2019 |
| 2020 |
| 2021 |
| 2022 |
| 2023E |
| Capital Invested |
| 285 |
| 730 |
| 441 |
| 183 |
| 2571 |
| 784 |
| 1035 |
| 6577 |
| 597 |
| 676 |
| 687 |
| 652 |
| 2-yr sum |
| 1171 |
| 624 |
| 2754 |
| 3355 |
| 1819 |
| 7612 |
| 7174 |
| 1273 |
| 1363 |
| 1339 |
| 4-yr sum |
| 3925 |
| 3979 |
| 4573 |
| 10967 |
| 8993 |
| 8885 |
| 8537 |
| 2612 |
| CFO |
| 407 |
| 530 |
| 477 |
| 585 |
| 812 |
| 920 |
| 1021 |
| 973 |
| 1421 |
| 1635 |
| 1756 |
| 1644 |
| 2yr change |
| 70 |
| 55 |
| 335 |
| 335 |
| 209 |
| 53 |
| 400 |
| 662 |
| 335 |
| 9 |
| 4yr change |
| 405 |
| 390 |
| 544 |
| 388 |
| 609 |
| 715 |
| 735 |
| 671 |
| 5-yr avg |
| 2-yr ROIIC |
| 6.0% |
| 8.8% |
| 12.2% |
| 10.0% |
| 11.5% |
| 0.7% |
| 5.6% |
| 52.0% |
| 24.6% |
| 0.7% |
| 16.7% |
| 4-yr ROIIC |
| 10.3% |
| 9.8% |
| 11.9% |
| 3.5% |
| 6.8% |
| 8.0% |
| 8.6% |
| 25.7% |
| 10.5% |
| Return on Capital |
| 8.2% |
| 9.7% |
| 8.3% |
| 10.4% |
| 9.8% |
| 10.7% |
| 10.5% |
| 6.1% |
| 9.1% |
| 9.6% |
| 9.3% |
From this data, the return on capital has been about 10%, with a four-year RoIIC of slightly higher returns but lower than the current share price. The estimated total return for Berry is about 26% (five-year average RoE * (one-payout ratio) + dividend yield) given Berry’s payout ratio of 15% and dividend yield of 1%. These historical numbers have been aided by lower interest rates. The expected return on equity is expected to decline to the mid-20%s over the next few years. Given this change, the total return would decline to the low-20%s.
Distribution Theme (46.6% of Portfolio; Quarterly Performance 32.2%)
Our holdings in car dealerships and branded capital equipment dealerships, convenience stores, building product distributors, automobile transportation logistics, and capital equipment leasing firms all fall into the distribution theme. One of the main key performance indicators for dealerships is velocity or inventory turns. We own some of the highest-velocity dealerships in markets around the world. Over the past two years, there have been challenges in some markets hit by COVID, like South Africa and Latin America, but we are seeing recovery now that vaccines have been approved and distributed.
One of our holdings in the distribution theme is Ferreycorp ( FRYCF ), a Caterpillar mining capital equipment dealer located primarily in the copper mining regions of Latin America (Peru and Chile). Ferreycorp’s growth model is to retain about 50% of earnings to invest in new buildings and facilities to support the outsourced maintenance of its large mining and construction customers. Given the recent post-COVID returns on equity of 18%, the expected earnings growth is 9%. Adding the current dividend yield of 10% and the buyback rate of 1% per year results in a total return of 20% per year. Below is Ferreycorp’s RoC and RoIIC over the past few years.
| Ferreycorp |
| 5-yr total |
| 2012 |
| 2013 |
| 2014 |
| 2015 |
| 2016 |
| 2017 |
| 2018 |
| 2019 |
| 2020 |
| 2021 |
| 2022 |
| 29.3% |
| Capital Invested |
| 295.7 |
| 331.4 |
| 213.2 |
| 217.8 |
| 142.9 |
| 150.2 |
| 161 |
| 262.2 |
| 153.5 |
| 109 |
| -46 |
| 639.7 |
| 2-yr sum |
| 544.6 |
| 431 |
| 360.7 |
| 293.1 |
| 311.2 |
| 423.2 |
| 415.7 |
| 262.5 |
| 63 |
| 4-yr sum |
| 905.3 |
| 724.1 |
| 671.9 |
| 716.3 |
| 726.9 |
| 685.7 |
| 478.7 |
| CFO |
| 355.3 |
| 276 |
| 256.9 |
| 317.6 |
| 362.2 |
| 393.2 |
| 358.2 |
| 448.2 |
| 260.7 |
| 542.7 |
| 580.4 |
| 187.2 |
| 2yr change |
| -98.4 |
| 41.6 |
| 105.3 |
| 75.6 |
| -4 |
| 55 |
| -97.5 |
| 94.5 |
| 319.7 |
| 4yr change |
| 6.9 |
| 117.2 |
| 101.3 |
| 130.6 |
| -101.5 |
| 149.5 |
| 222.2 |
| 5-yr avg |
| 2-yr ROIIC |
| -18.1% |
| 9.7% |
| 29.2% |
| 25.8% |
| -1.3% |
| 13.0% |
| -23.5% |
| 36.0% |
| 507.5% |
| 106.3% |
| 4-yr ROIIC |
| 0.8% |
| 16.2% |
| 15.1% |
| 18.2% |
| -14.0% |
| 21.8% |
| 46.4% |
| 17.5% |
| Return of Capital |
| 9.4% |
| 11.0% |
| 9.5% |
| 12.4% |
| 11.3% |
| 10.3% |
| 9.9% |
| 10.0% |
| 10.2% |
| 17.1% |
| 13.4% |
Ferreycorp currently trades for a FY2023 EPS multiple of about 5.6x and an earnings yield of 18%, with 10% expected EPS growth. Given a conservative projected EPS growth of 10% per year, Ferreycorp should trade at 28.5x earnings using Graham’s formula of 8.5 + 2 * growth rate. If we apply a 50% for Ferreycorp’s location, a 15x multiple is a fair value multiple. Applying this multiple results in about a 3x return today and a 5x return in five years.
| Ferreycorp |
| EPS Growth |
| 10% |
| 2021 |
| 2022 |
| 2023 |
| 2024 |
| 2025 |
| 2026 |
| 2027 |
| 2028 |
| 2029 |
| S/ 2.46 |
| 3.65 |
| 5-yr fwd PE |
| 10% growth PE |
| 18.0% |
| 5.55 |
| Earnings/FCF Yield |
| 28.5 |
| Revs |
| S/ 5,715 |
| S/ 6,577 |
| S/ 6,912 |
| S/ 7,603 |
| S/ 8,364 |
| S/ 9,116 |
| S/ 9,846 |
| S/ 10,535 |
| S/ 11,167 |
| 15% |
| 5% |
| 10% |
| 10% |
| 9% |
| 8% |
| 7% |
| 6% |
| Revenue Drivers Peru Dis Factor |
| 50% |
| Revenue Growth - 4% |
| Growth Hi Cu Price (09-12) - 20% |
| NI |
| S/ 347 |
| S/ 419 |
| S/ 528 |
| S/ 532 |
| S/ 585 |
| S/ 638 |
| S/ 689 |
| S/ 737 |
| S/ 782 |
| NI/share - 9% |
| 6.1% |
| 6.4% |
| 7.6% |
| 7.0% |
| 7.0% |
| 7.0% |
| 7.0% |
| 7.0% |
| 7.0% |
| Share buyback - 1% |
| Inv Turns |
| EPS |
| S/ 0.37 |
| S/ 0.44 |
| S/ 0.56 |
| S/ 0.56 |
| S/ 0.62 |
| S/ 0.67 |
| S/ 0.73 |
| S/ 0.78 |
| S/ 0.83 |
| Market Cap |
| Target Price |
| S/ 9.61 |
| 21% |
| 26% |
| 1% |
| 10% |
| 9% |
| 8% |
| 7% |
| 6% |
| Shares |
| 946.1 |
| S/ 2,327.41 |
| IRR |
| 31.3% |
Telecom/Transaction Processing Theme (30.6% of Portfolio; Quarterly Performance -28.1%)
Within this theme, the increasing use of transaction processing in the markets of our respective firms— as well as the rollout of fiberoptic and 5G networks—is providing growth opportunities. Given that most of these firms are holding companies and have multiple components of value (including real estate), the timeline for realization may be longer than for more mono-industry-focused firms. We are seeing event driven situations unfold in Consolidated Communications ( CNSL ) and Millicom ( TIGO ). With CNSL, there has been a series of publicly disclosed shareholder letters to the committee reviewing a take-out offer asking them to turn down the current take-out offer of $4/share and illustrating much higher values for CNSL. For Millicom, Xavier Niel, the firm’s number-one shareholder, continued buying after the Apollo bid was rejected by Millicom. Mr. Niel has also nominated board members, and Millicom has moved its CEO to the chairman position and replaced him with an associate of Mr. Niel.
Consumer Product Theme (11.9% of Portfolio; Quarterly Performance 4.0%)
Our consumer product, tire, and beverage firms comprise this category. The defensive nature of these firms can lead to better-than-average performance. One theme we have been examining is the development of category-killer retail franchises. These firms have developed local franchises which have higher inventory turns, margins, and sales per square foot than competitors, all resulting in great unit economics and high returns on incremental invested capital. They also have some unique characteristics, such as a specialty niche (like tire stores) or doing something the competitors will not do (like selling hunting supplies). An example of this is Academy Sports + Outdoors, the subject of this quarter’s case study.
Real Estate/Construction Theme (28.1% of Portfolio; Quarterly Performance 20.2%)
The pricing of our real estate holdings is positively impacted by the reopening of China and Hong Kong from COVID restrictions and its effects on Hong Kong’s tourism from China. The current cement and construction holdings (in US/Europe via Builders FirstSource ( BLDR ) and Vistry ( BVHMF ), and in Korea via Asia Cement) should do well as the world recovers from COVID shutdowns and governments worldwide incentivize infrastructure programs. Even so, Asia Standard ( ASASF ) still sells for 5% of book value including its mark-to-market changes in its real estate and investment portfolio. The portfolio includes Chinese real estate developer bonds, which should recover in value as the Chinese government provides incentives for further real estate development.
The Second Dimension of Valuation—Underlying Growth
The long-term changes of firm values are driven by underlying firm free cash flow growth. The first dimension of firm value is the value today and is reflected in the firm’s pricing ratios such as price/earnings and price/free cash flow. The second dimension analyzes historical cash flows compared to future cash flow sources and trends. Understanding the direction of value creation in a firm is an important metric to understand and track if you want to see value creation going forward.
The components of free cash flow growth include organic ( M arket) growth, acquired or M&A growth, operation leverage, and the amount of investment or capital to fund this growth. Return on capital is a way to break down the elements of free cash flow growth. If we can estimate incremental change in return on capital, then we can get clues as to future returns on capital and thus free cash flow growth. Free cash flow growth also determines the correct FCF multiple or yield for a given firm. The Graham formula of FCF multiple = 8.5 + 2*(seven-year forward FCF growth rate) [1] , provides a formula for this relationship. This relationship provides a valuable insight into future firm values. If we can estimate FCF growth via return on capital and incremental returns on invested capital analysis, we can estimate a reasonable multiple for a firm.
When looking at investing in equities, the opportunity cost is investing in other more certain cash flow securities such as bonds. Today, portfolios of well underwritten first-lien loans with growing underlying collateral can generate total returns of 12-13% via BDCs. Thus, to invest in equity, we are looking for a total return (FCF growth plus dividend yield plus valuation changes) in excess of 17% (bond returns plus historical equity risk premium) provides a margin of safety in the current interest rate environment.
One risk value investors typically assume is valuation change risk. Typically, value theses assume some multiple increase or discount narrowing to achieve its expected return. However, valuation risk can increase if the implied growth rate in the current valuation declines or the implied discount increases, a not-uncommon occurrence. Valuation risk has also increased, as opportunity cost due to higher debt rates over the past 24 months has increased from 8% to 13%. These opportunity-cost increases have reduced the value of lower-growing firms.
If we don’t want to rely on changes in valuation—an uncertain way to generate returns—then we are looking for FCF growth plus dividend yields of greater than 17%. The estimated FCF growth can be estimated by return on equity times (1 – dividend payout ratio) and total return as FCF growth plus dividend yield.
Looking at growth first and its resiliency, then valuation second, has some interesting impacts on the security selection process. Growth resiliency can be measured by returns on invested capital, returns on equity, incremental returns on invested capital, and the volatility of these measures. Resiliency sources can be examined via the depth of moat the subject company possesses and changes in the depth over time. One issue is how to deal with cyclicality in the return data. An approach to deal with volatility is to calculate returns on invested capital over multiple years. Measuring the returns over the entire relevant business cycle is also important.
As an example, let’s look at Builders FirstSource, a current holding, using this approach. Builders FirstSource has the following history of RoIC and RoIIC:
| Builders FirstSource |
| 5-yr total |
| 2012 |
| 2013 |
| 2014 |
| 2015 |
| 2016 |
| 2017 |
| 2018 |
| 2019 |
| 2020 |
| 2021 |
| 2022 |
| 109.4% |
| Capital Invested |
| 12.7 |
| 12.46 |
| 94.79 |
| 1512.5 |
| 38.4 |
| 59.4 |
| 96.6 |
| 198.9 |
| 136.2 |
| 1344.6 |
| 957.5 |
| 2733.8 |
| 2-yr sum |
| 107.25 |
| 1607.29 |
| 1550.9 |
| 97.8 |
| 156 |
| 295.5 |
| 335.1 |
| 1480.8 |
| 2302.1 |
| 4-yr sum |
| 1658.15 |
| 1705.09 |
| 1706.9 |
| 393.3 |
| 491.1 |
| 1776.3 |
| 2637.2 |
| CFO |
| -32.7 |
| 13.9 |
| 19 |
| 72.6 |
| 192.6 |
| 263.5 |
| 369.4 |
| 396.2 |
| 477.6 |
| 2264.7 |
| 3254.5 |
| 2991 |
| 2yr change |
| 51.7 |
| 58.7 |
| 173.6 |
| 190.9 |
| 176.8 |
| 132.7 |
| 108.2 |
| 1868.5 |
| 2776.9 |
| 4yr change |
| 225.3 |
| 249.6 |
| 350.4 |
| 323.6 |
| 285 |
| 2001.2 |
| 2885.1 |
| 5-yr avg |
| 2-yr ROIIC |
| 48.2% |
| 3.7% |
| 11.2% |
| 195.2% |
| 113.3% |
| 44.9% |
| 32.3% |
| 126.2% |
| 120.6% |
| 87.5% |
| 4-yr ROIIC |
| 13.6% |
| 14.6% |
| 20.5% |
| 82.3% |
| 58.0% |
| 112.7% |
| 109.4% |
| 76.6% |
| Return on Invested Capital |
| -2.0% |
| 12.8% |
| 11.9% |
| 5.4% |
| 11.0% |
| 13.2% |
| 17.1% |
| 16.0% |
| 18.2% |
| 28.1% |
| 43.2% |
| 24.5% |
We can see that Builders FirstSource has an expected total return (five-year average RoE * (one-payout ratio) + dividend yield) of 25% as Builders FirstSource pays no dividends. The remaining question: is the last five-year RoE sustainable going forward. I would argue that the conditions of the last five years include both bad and good conditions and analysts’ forecasts estimate that the 25% return on equity is also sustainable going forward. In addition, Builders FirstSource has developed and has expanded local economies of scale and scope moats in the regions in which it operates. Next, we are going to examine a case of a high return on capital compounder from history, Henry Singleton and Teledyne.
Teledyne ( TDY ) & Henry Singleton: A Capital Allocation Champion
Henry Singleton was a cofounder and CEO of Teledyne from 1960 to 1990. Over that time, Teledyne’s share price compounded by 20% per year. In addition, Teledyne Technologies, the spinoff firm that focused on Teledyne’s core industry of defense and electronics, compounded its share price by 18% per year from 1999 to 2023. This record of almost 55 years of 18-20% annual returns has to be amongst the highest in corporate history.
Henry was an Annapolis- and MIT-trained engineer whose early career was as an engineer and executive for aerospace firms such as Hughes Aircraft and Litton Industries. Henry cofounded Teledyne in 1960, and it went public in 1961, funded by venture capital pioneer Arthur Rock. Henry had some allocation rock stars on his board of directors from the early days of Teledyne, including Claude Shannon, the inventor of information theory, and Arthur Rock.
Teledyne provides an example of a compounder that focused on a long-term trend (the application of integrated circuit electronics and metals to defense) and other high return on capital applications, and used various forms of capital allocation to increase intrinsic value over 30 years. In its initial years— 1960 through 1968—Teledyne used mergers and acquisitions primarily in the defense, electronics, and metals businesses to grow its intrinsic value. The acquisitions were funded primarily using Teledyne stock. Teledyne purchased these businesses from entrepreneurial families who had built these businesses in the post-WW II boom and wanted an exit. These businesses were in the growth phase of their lives. Most of these entrepreneurs stayed on to run their businesses after being purchased by Teledyne. Over the same period of time, Henry built a decentralized control structure, a stable of managers, and an incentive system based on returns on capital to optimize the operational performance of the firms acquired. The purchase prices ranged from the mid-single-digit to low-double-digit multiples of earnings (never more the 12x earnings [2] ). These businesses also had modest capital requirements, with capital expenditures averaging about 33% of cash flow from operations.
Initially, the pace of acquisitions was modest, as Teledyne was still small. In 1965, Teledyne won a large defense contract which caused the price of Teledyne stock to increase fourfold. With this higher stock price (with forward multiples of 30 to 50x) [3] , Teledyne’s acquisitions increased (with a higher stock price used to purchase firms at lower multiples) until 1968, when the growing firms Teledyne liked to buy were selling for too high a price. During the late 1960s, Teledyne purchased financial firms such as insurance and banking firms. In these acquisitions, Teledyne always received more than they paid in acquisitions. Another example of this approach was when Teledyne approached Berkshire to potentially be acquired. Teledyne wanted Berkshire stock as consideration; but Buffett was unwilling to part with it.
From 1968 to 1975, Teledyne’s forward P/E multiple contracted from 50x to 2x. After Teledyne’s PE declined below 10x, Teledyne repurchased over 60% of its shares via Dutch tender offers. Over the 1970s, operations were improved, and the return on equity increased from 13% to 26%. Initially, the common shares were exchanged for borrowed cash that was quickly paid back from cash flows from Teledyne’s high return on equity businesses that had modest capital requirements. Subsequent tender offers exchanged debt for cash directly, as the yield on the debt issued was at a substantial discount to the earnings yield of the shares tendered. During the 1970s and early 1980s, minority interests of businesses could be purchased at significant discounts to entire businesses. This provided an opportunity for Teledyne’s insurance companies to purchase minority interests in businesses for their investment portfolios and to earn outsized returns going forward.
As equity prices increased during the 1980s, Teledyne turned to spinoffs (the final chapter of the Teledyne capital allocation story) of its subsidiaries to generate returns. One of the spinoffs, Teledyne Technologies, continued to focus on the application of integrated electronics and has generated returns of 18% annually since the spinoff in 1999.
Teledyne provides an example of a champion capital allocator investing in businesses with long-term tailwinds leading to outstanding returns for shareholders. A great summary of the Teledyne story can be found in the book Distant Force written by George Roberts, Teledyne’s president. At Bonhoeffer, we are searching for these types of situations for our portfolio and believe we have found one in Academy Sports + Outdoors described in the case study below.
Conclusion
As always, if you would like to discuss any of the investment frameworks or investments in deeper detail, then please do not hesitate to reach out. As we wrap up the third quarter, I want to thank you for your continued confidence in our work.
Warm Regards,
Keith D. Smith, CFA
CASE STUDY: ACADEMY SPORTS AND OUTDOORS, INC. ( ASO )
Academy Sports and Outdoors (Academy) is a sports, outdoor, and recreational product retailer with locations primarily in the South. Academy’s value proposition is to provide a wide selection of value priced merchandise to customers. Academy currently has 268 locations across 18 states. Academy’s products can be divided into four segments: sports and fitness (21% of sales); outdoors (31% of sales); footwear (20% of sales); and apparel (28% of sales). Over the past four years, Academy has generated revenue growth via store growth (8% annually) and same-store sales growth (5.4% annually). This is a more balanced growth profile versus other competitors like Dick’s and Hibbett, whose growth is more reliant on same-store growth versus new-store openings. Academy also has the highest sales/square foot and profit per store versus the larger Dick’s and the smaller Hibbett.
Management has a four-year plan to grow sales to $10 billion and net income to $1 billion. This plan envisions 50% new stores in both the existing and the edges of the current footprint and within delivery distances from its three distribution facilities in Texas, Georgia, and Tennessee. Management is also expecting return on invested capital to increase to 30%, from 23% last year, as local economies of scale are realized from filling out and expanding its existing footprint at its edges. Inventory turns likewise are expected to increase to 3.5x, from 3.0x currently, as more distribution efficiencies are realized in the supply chain. These are higher turns than both Dick’s and Hibbett. The plan also calls for increased net income margins from 9% today to 10% in four years from economies of scale. The execution of the growth plan will also generate 65% EBITDA FCF conversion allowing ample cash flows for buybacks at low stock prices or dividends at higher valuations.
Academy has four levers for cash flow growth: 1) new store expansion within supply distance of distribution centers, developing higher sales and margins due to local economies of scale; 2) higher same store sales; 3) higher inventory turns; and 4) distributing excess cash as dividends or buying back shares.
Academy was founded in 1938 in Katy, Texas. In 2005, Academy was purchased by the private equity firm KKR. In 2018, as a part of a turnaround plan, Ken Hicks, who previously turned around Foot Locker, was hired as CEO. His plan was to reverse the historic revenue and EBITDA per store decline from 2013 to 2018 of 18% and 60%, respectively. The plan was to enhance the differentiated customer experience and provide a wide selection of goods at value price points. The plan was to increase sales to $6.5 billion from $4.8 billion in 2023, with additional 2023 targets of 5% net income margin, 10% EBITDA margin, 17% return on invested capital, 3x inventory turns, and $325 sales/sq foot. All of these targets were met or exceeded by 2023. In addition, Academy had industry-leading sales per square foot and revenue and EBITDA per store metrics. Academy went public in September 2020, when KKR sold about 20% of Academy’s common shares for $13 per share. Subsequently, in 2021, KKR sold the rest of the shares they owned in a series of secondary offerings.
Since IPO, Academy has opened nine stores in existing states and developed a growth plan described above. I have diligence from two of these newly opened stores and the customer experience was outstanding, with large selections, good pricing, and excellent customer service. One area in particular where Academy is the leader is hunting equipment and recreational shooting. Dick’s has chosen to exit this market, leaving Academy as the selection and volume leader. In addition, Academy has further developed its customer experience and omnichannel sales through COVID. In 2023, the president and CEO transitioned to the chairman of the board, the CFO became CEO, and the chief merchandise officer became president.
Industry Overview
Academy competes with mass general merchants, large-format sporting goods retailers, traditional sporting goods retailers, specialty outdoor retailers, specialty footwear retailers, and catalogue and internet retailers in the United States. The mass general merchants include Walmart, Kohl’s, and Target; large-format retailers include Dick’s and Scheels; traditional sporting goods retailers include Hibbett and Big 5 Sporting Goods; specialty outdoor retailers include Sportsman’s Warehouse and Bass Pro Shop/Cabela’s, specialty footwear retailers such as Foot Locker, and catalogue and internet retailers such as Amazon, eBay and Fanatics. Academy’s primary competitors are mass general merchants and large format sporting goods retailers.
Academy has the higher Net Promoter Score (NPS), a measure of customer experience, versus its competitors. Its Q4 2022 NPS was 43 vs. 26 for Dick’s, 33 for Bass Pro Shops, 37 for Amazon, 21 for Walmart, and 15 for Target. In addition, Academy’s NPS has grown from 32 in Q2 2020 to 43 in Q4 2022 and held a consistent 10 to15 point lead over both Dick’s and the retailer market average NPS. Academy’s sales per square foot has also been higher than Dick’s (currently 18% higher) and other competitors over the past five years.
The sporting goods retail market is a fragmented market. The overall TAM of the markets Academy directly competes in is estimated to be $175 billion. The sports and fitness market is estimated to be a $13 billion market, the outdoors market a $27 billion market, the footwear market is estimated to be a $47 billion market, and the apparel market is a $88 billion market. The largest competitor in this market is Dick’s, with a 7% market share, followed by Academy with a 3% market share, and Hibbett and Sportsman’s Warehouse having less than 1% market shares.
Sources of growth for Academy include same-store and new-store growth. New-store growth is expected to increase by 10% annually over the next five years. Same-store growth is expected to grow by 2% per year, driven by online sales and increased foot traffic and lager basket sizes. Organic sales growth is expected to be 12% annually with cash flow growth coming from sales growth, operational leverage, and share repurchases or dividends from the 65% FCF conversion from CFO.
Academy’s operations have become better over time, as Ken has implemented his customer-focused growth strategy utilizing economies of scale and efficiencies from increased automation. The return on assets has increased from 1% in FY2009, to 23% in FY2023; and the return on equity increased from 1% in FY2009, to 40% in FY2023. The drivers included increases in net income margins from 0.4% in FY2009, to 9.8% in FY2023, and increases in inventory turnover from 3.0x in FY2013, to 3.4x in FY2023. Leverage also declined from 6.1x, to 1.5x EBITDA.
The incremental return on invested capital over the past five years is close to 100%, which has increased Academy’s RoIC over the past five years. This was influenced by COVID, so a more reasonable target of 30% as laid out by management is appropriate. See the calculations below.
| ASO |
| 2012 |
| 2013 |
| 2014 |
| 2015 |
| 2016 |
| 2017 |
| 2018 |
| 2019 |
| 2020 |
| 2021 |
| 2022 |
| 2023 |
| Capital Invested |
| 106 |
| 98 |
| 63 |
| 247 |
| 76 |
| 108 |
| 222 |
| 2-yr sum |
| 204 |
| 161 |
| 310 |
| 323 |
| 184 |
| 4-yr sum |
| 514 |
| 484 |
| 494 |
| CFO |
| 196.3 |
| 145.2 |
| 210 |
| 464 |
| 898 |
| 771 |
| 705 |
| 2yr change |
| 13.7 |
| 318.8 |
| 688 |
| 307 |
| -193 |
| 4yr change |
| 701.7 |
| 625.8 |
| 495 |
| 5-yr avg |
| 2-yr ROIIC |
| 6.7% |
| 198.0% |
| 221.9% |
| 95.0% |
| -104.9% |
| 83.4% |
| 4-yr ROIIC |
| 136.5% |
| 129.3% |
| 100.2% |
| 122.0% |
Downside Protection
Academy’s risks include both operational leverage and financial leverage. Operational leverage is based upon the fixed vs. variable costs of the store and logistics operations. Academy has built distribution infrastructure to support the four-year plan of rolling out 50% more stores in and adjacent to the existing store footprint. There are some local economies of scale in terms of distribution and shared advertising and general and administrative costs, as the business is primarily located in the South and is expanding in the Midwest and the Great Lakes region of the United States.
Financial leverage can be measured by the debt/EBITDA ratio. Academy has below-average net debt/EBITDA of 1.5 versus other sporting goods retailers (like Sportsman’s Warehouse, Hibbett, and Big 5) and versus Academy’s history. The history and projected financial performance for Academy is illustrated below.
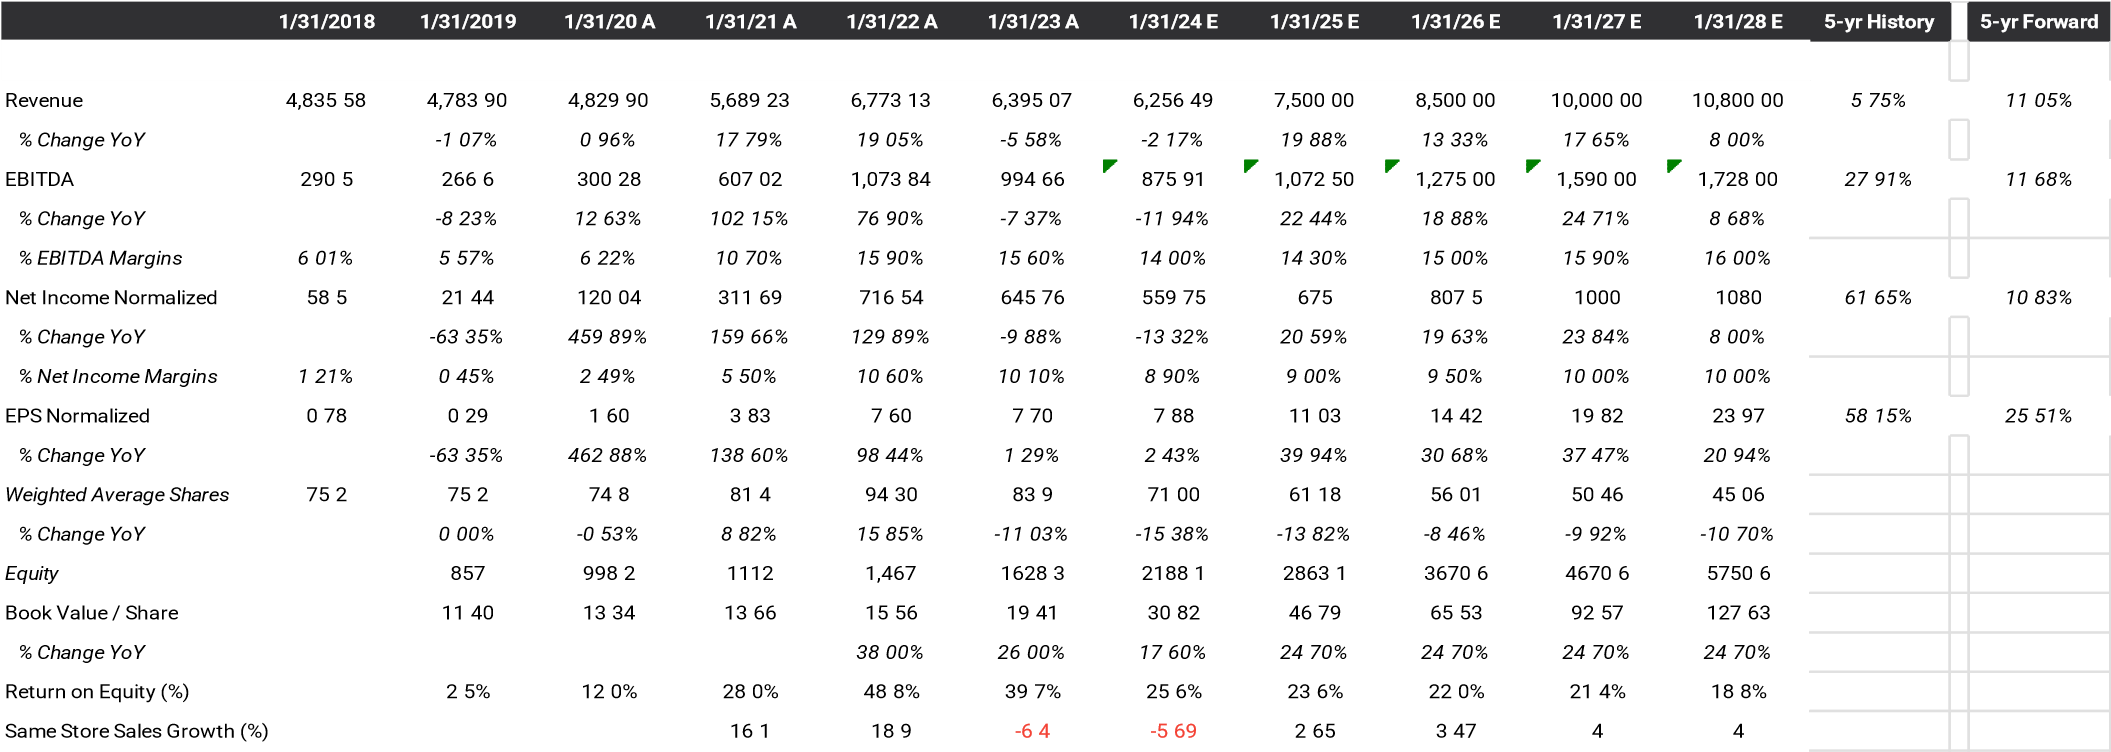
Management and Incentives
Academy’s management team has developed a growth engine and operationally efficient firms in the retailing of sporting and outdoor goods. They have developed a store rollout plan to capture a similar demographic as their existing core customer, the Southern sports and outdoorsman, by infilling their existing footprint and expanding at the footprint’s edges. Management plans on returning cash to shareholders from its business plan via buybacks. This should be accretive to value at current share prices and earnings levels, 7.1x EPS.
The base compensation for the CEO is 67% higher than for the remaining management team (top five officers). Over the past three years, the management team’s total compensation was about $26 million per year, about 5% of net income per year. Academy has the following shareholding guidelines for managers: CEO 5x base salary, EVPs 3x base salary, SVPs 2x base salary, and VPs 0.5 to 1x base salary. The CEO currently hold 1.5 million shares and options (worth $76.6 million), about 1.9% of shares outstanding, which is more than 6.7 times his FY2023 salary and bonus of $11.4 million. Other members of the management team hold 2.7 million shares (worth $137.9 million).
The CEO’s compensation is structured to include $1.1 million of base pay and $4.0 million in performance bonuses. Short-term incentives are based upon net sales and adjusted EBIT targets and are paid in cash. Long-term incentives include: performance-based restricted shares based upon three-year adjusted EBIT and return on invested capital targets (50% of total), three-year time-vested restricted shares (25% of total), and three-year time-vested options (25% of total).
Board members have an investment in Academy. They have to hold 3x their annual director’s fees in Academy shares. Non-management directors hold 114 thousand shares (worth $5.9 million).
Valuation
| Valuation |
| Senstitivity Table |
| Price |
| Upside |
| Current Adjusted Earnings |
| $6.98 |
| 7-year Expected EPS Growth Rate |
| 20% |
| -0.4% |
| $50.92 |
| 0.0% |
| Historical EPS Growth Rate |
| 40% |
| 3.0% |
| $95.56 |
| 87.7% |
| Current AAA Bond Rate |
| 4.7% |
| Growth Rate |
| 5.0% |
| $121.93 |
| 139.4% |
| Implied Graham Mutiplier * |
| 45.79 |
| 10.0% |
| $187.83 |
| 268.9% |
| Implied Value |
| $319.64 |
| 20.0% |
| $319.64 |
| 527.7% |
| Current Price |
| $50.92 |
| 25.0% |
| $385.55 |
| 657.2% |
| * (2*Growth Rate + 8.5)* (4.4%/AAA bond r |
| ate) |
The key to the valuation of Academy is the expected growth rate. The current valuation implies an earnings/FCF decrease of 0.4% in perpetuity using the Graham formula ((8.5 + 2g)). The historical 10year earnings growth has been 40% per year including acquisitions and the current return on equity of 40%.
A bottom-up analysis based upon unit (10% per year) and SSS growth rates (3% per year) of Academy’s markets results in an organic revenue growth rate of 13% for Academy. Historically, Academy’s revenue growth rate was 6% per year, driven by lower unit growth. The net income increased by 40% per year, in part by operational leverage and by COVID. Going forward, if we assume steady net income margins of 10%, with operational leverage offsetting the COVID decline, we arrive at a net income growth rate of 13%. Academy is expected to return excess cash to shareholders (65% of CFO) via repurchases or dividends. This will result in share reductions of about 10% to 15% per year, assuming a $10 increase in price per share for Academy over the next seven years. The resulting increase in EPS will be about 20% per year. Using a 20% expected growth rate, the resulting current multiple is 46x of earnings, while Academy trades at an earnings multiple of 7x. If we look at high-growth comparables, they have an average earnings multiple of 36x. If we apply 15x earnings to Academy’s estimated FY2024 earnings of $7.88, then we arrive at a value of $118.2 per share, which is a reasonable short-term target. If we use a 20% seven-year growth rate, then we arrive at a value of $319.54 per share. This results in a five-year IRR of 44%.
Growth Framework
| Academy Sports & Outdoors |
| EPS Growth |
| 25.3% |
| 2021 |
| 2022 |
| 2023 |
| 2024 |
| 2025 |
| 2026 |
| 2027 |
| 2028 |
| 2029 |
| $ 50.92 |
| 2.57 |
| 5-yr fwd PE |
| % growth PE |
| 15.2% |
| 6.57 |
| Earnings/FCF Yield |
| 20.5 |
| Revs |
| $6,773 |
| $6,395 |
| $6,239 |
| $6,702 |
| $7,516 |
| $8,713 |
| $10,000 |
| $10,800 |
| $11,664 |
| -6% |
| -2% |
| 7% |
| 12% |
| 16% |
| 15% |
| 8% |
| 8% |
| 13% growth (10% unit growth (PLAN) & 2% SSS) |
| Decline thereafter |
| NI/FCF |
| $717 |
| $645 |
| $550 |
| $589 |
| $687 |
| $828 |
| $1,000 |
| $1,080 |
| $1,166 |
| Inv Turn |
| 3.79 |
| 10.6% |
| 10.1% |
| 8 8% |
| 8.8% |
| 9.1% |
| 9.5% |
| 10 0% |
| 10.0% |
| 10.0% |
| 3 04 |
| EPS |
| $ 8.09 |
| $ 8 .43 |
| $ 7 .75 |
| $ 8 .91 |
| $ 11.23 |
| $ 14.78 |
| $ 19.82 |
| $ 23.97 |
| $ 29 34 |
| $ - |
| 88.6 |
| $4,511.51 |
| 4% |
| -8% |
| 15% |
| 26% |
| 32% |
| 34% |
| 21% |
| 22% |
| Share BB |
| $ 406.30 |
| % of FCF |
| 88.6 |
| 76.5 |
| 71.0 |
| 66.1 |
| 61.2 |
| 56.0 |
| 50.5 |
| 45.1 |
| 39.8 |
| 39.8 |
| 51% |
| 50% |
| 8.1 |
| 5.5 |
| 4.9 |
| 4.9 |
| 5.2 |
| 5.6 |
| 5.4 |
| 5.3 |
| 0.0 |
| 0.0 |
| 40 |
| 50 |
| 60 |
| 70 |
| 80 |
| 90 |
| 100 |
| 110 |
| 120 |
| 130 |
Another way to look at growth and the valuation of companies is to estimate the EPS five years into the future and see how much of today’s price incorporates this growth. Using the same revenue described above results in a FY2028 EPS of $23.97, or 2.6x the current price. If we assume a steady-state growth rate from 2028 on of 6%, and 50% of NI is used to repurchase shares, then this results in a fair value Graham multiple of 20.5x or $406.3 per share, higher than the five-year-forward valuation above of $319.54 per share.
Comparables and Benchmarking
Below are sporting goods and high-growth retailers located in the United States and Canada. Compared to these firms, Academy has debt on the low end of the range and has better growth prospects and a below-average multiple. Academy also has high RoEs and the highest five-year growth rates.
| Sporting Goods Retailers |
| 5-yr |
| 22 Annual |
| EBITA |
| EBITA |
| 5-yr |
| EBITDA |
| Sales/ |
| Same Store |
| Debt/ |
| Price |
| Book Value |
| Earnings |
| Inv Turns |
| Margin |
| Coverage |
| RoE |
| Growth |
| P/E |
| P/BV |
| Sq Ft |
| Growth |
| EBITDA |
| Academy Sports |
| 50.94 |
| 21.99 |
| 6.98 |
| 3.41 |
| 13.2% |
| 16.40 |
| 33.8% |
| 27.0% |
| 7.3 |
| 2.32 |
| 340.00 |
| -6.4% |
| 1.50 |
| Dick's |
| 111.67 |
| 30.74 |
| 12.06 |
| 3.15 |
| 12.1% |
| N/A |
| 34.5% |
| 20.0% |
| 9.3 |
| 3.63 |
| 290.00 |
| -0.5% |
| N/A |
| Hibbert |
| 45.03 |
| 29.55 |
| 7.25 |
| 3.45 |
| 9.9% |
| 33.60 |
| 29.6% |
| 22.0% |
| 6.2 |
| 1.52 |
| 266.00 |
| -2.2% |
| 1.42 |
| Big 5 Sports |
| 8.06 |
| 11.82 |
| 0.23 |
| 2.24 |
| 3.4% |
| 40.40 |
| 16.1% |
| 5.6% |
| 35.0 |
| 0.68 |
| 192.00 |
| -14.5% |
| 2.17 |
| Sportsman's Warehouse |
| 4.93 |
| 7.34 |
| 0.54 |
| 2.02 |
| 4.1% |
| 6.60 |
| 43.3% |
| 5 9% |
| 9.1 |
| 0.67 |
| 286.00 |
| -12.2% |
| 3.40 |
| High Growth Retailers |
| Ulta Beauty |
| 319.88 |
| 33.01 |
| 10.57 |
| 3.71 |
| 16.1% |
| N/A |
| 42.1% |
| 17.1% |
| 30.3 |
| 9.69 |
| 701.00 |
| 15.6% |
| 0.00 |
| Ollie's Bargain Basement |
| 93.53 |
| 16.8 |
| 3.04 |
| 2.64 |
| 14 9% |
| N/A |
| 18.1% |
| 24.1% |
| 30.8 |
| 5.57 |
| 118.30 |
| -3.0% |
| 0.00 |
| five Below |
| 192.32 |
| 13.61 |
| 4.01 |
| 3.60 |
| 11 8% |
| N/A |
| 29.5% |
| 23.5% |
| 48.0 |
| 14.13 |
| 241.60 |
| -3.2% |
| 0.00 |
Risks
The primary risks are:
- slower-than-expected sales growth (currently projected to be 13% based upon 10-store growth and 3% SSS growth);
- lower-than-expected net income margins (currently projected to grow at 10% by FY2027); and
- higher stock prices, making buybacks less accretive.
Potential Upside/Catalyst
The primary catalysts are:
- higher-than-expected sales growth;
- higher-than-expected net income margins; and
- increased local scope or purchase of local scale in new markets.
Timeline/Investment Horizon
The short-term target is $120 per share, which is almost 140% above today’s stock price. If the continued organic growth thesis plays out over the next five years (with a resulting 20% earnings per year growth rate), then a value of $363 (midpoint of the two methods described above) could be realized. This is a 48% IRR over the next five years.
Footnotes[1] See page 536-538, Security Analysis Principles and Technique, Sixth Edition, Benjamin Graham, David Dodd, and Sidney Kottle, 1962 [2] See page 41, The Outsiders, William Thorndike, Jr., 2012 [3] See page 41, The Outsiders, William Thorndike, Jr., 2012 DisclaimerThis letter does not contain all the information that is material to a prospective investor in the Bonhoeffer Fund, L.P. (the “Fund”). Not an Offer: The information set forth in this letter is being made available to generally describe the philosophies of the Fund. The letter does not constitute an offer, solicitation or recommendation to sell or an offer to buy any securities, investment products or investment advisory services. Such an offer may only be made to accredited investors by means of delivery of a confidential private placement memorandum, or other similar materials that contain a description of material terms relating to such investment. The information published and the opinions expressed herein are provided for informational purposes only. No Advice: Nothing contained herein constitutes financial, legal, tax, or other advice. The Fund makes no representation that the information and opinions expressed herein are accurate, complete or current. The information contained herein is current as of the date hereof but may become outdated or change. Risks: An investment in the Fund is speculative due to a variety of risks and considerations as detailed in the Confidential Private Placement Memorandum of the Fund, and this letter is qualified in its entirety by the more complete information contained therein and in the related subscription materials. No Recommendation: The mention of or reference to specific companies, strategies or instruments in this letter should not be interpreted as a recommendation or opinion that you should make any purchase or sale or participate in any transaction. |
Editor's Note: The summary bullets for this article were chosen by Seeking Alpha editors.
For further details see:
Bonhoeffer Capital Management Q2 2023 Letter