QQQA - Born Under Some Bad Signs
Summary
- The U.S. stock market found some renewed life late last week.
- Despite the recent rally, anticipate more U.S. stock downside ahead.
- Technical resistance remains heavy.
- Fundamental challenges remain, including a renewed and persistent widening in CCC and lower spreads.
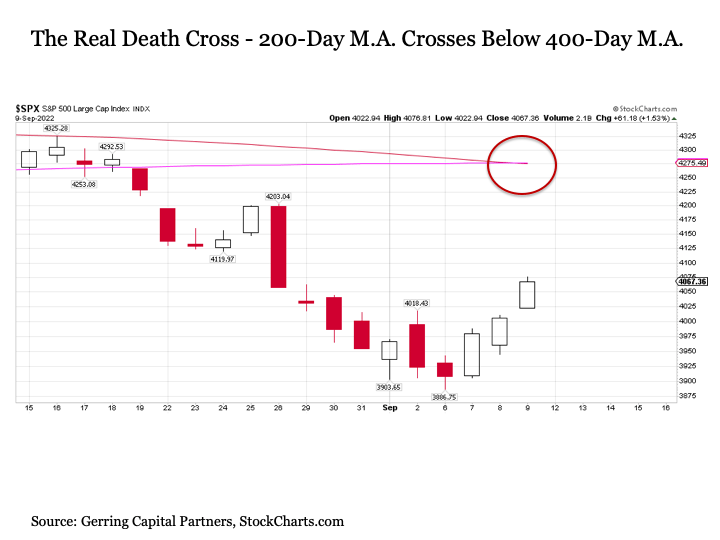
- A rare historical precedent has also taken place that bodes ill for stocks if it holds.
Head-fake . U.S. stocks have perked up as of late. After trading lower in 10 out of 14 trading days and shedding more than -10% in the process since peaking on August 16, the S&P 500 has bounced nearly +5% over the last three trading days to close out the week. Is a new rally in U.S. stocks underway? Perhaps, but it is likely to be fleeting at best, as this latest rally has been born under some bad signs.
Technical resistance . The first reason why the latest bear market rally in stocks is likely to soon get stopped in its tracks is technical, as the S&P 500 is confronted with numerous layers of technical resistance to overcome.
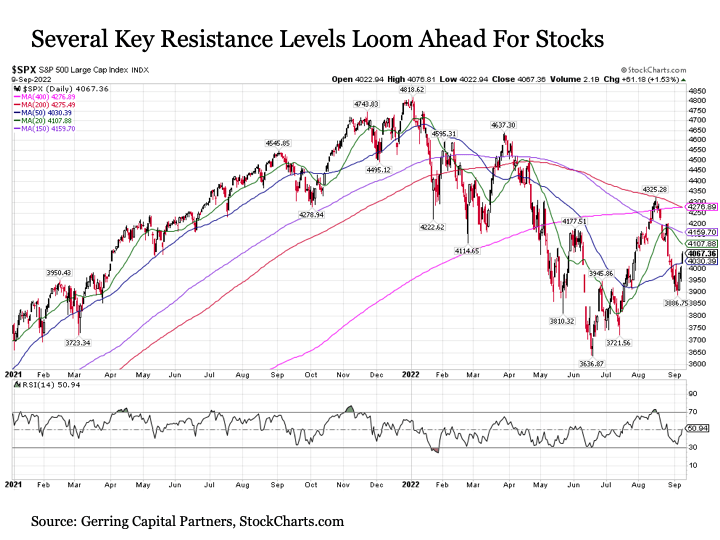
First, the S&P 500 is now drifting into a thicket of moving average resistance levels that threaten to turn it back lower. While the S&P 500 advanced assertively above its medium-term 50-day moving average (blue line on chart above), it is charging fast toward short-term 20-day moving average resistance (green line) that has stopped various previous upside surges in stocks in their tracks. The downward sloping 150-day M.A. resistance (purple line) lies not far beyond the 20-day. And then we have the increasingly sharply downward sloping long-term 200-day moving average resistance (red line), which put an end to the summertime rally in mid-August. All of these moving average resistance levels lurk within +5% above where the S&P 500 closed on Friday.
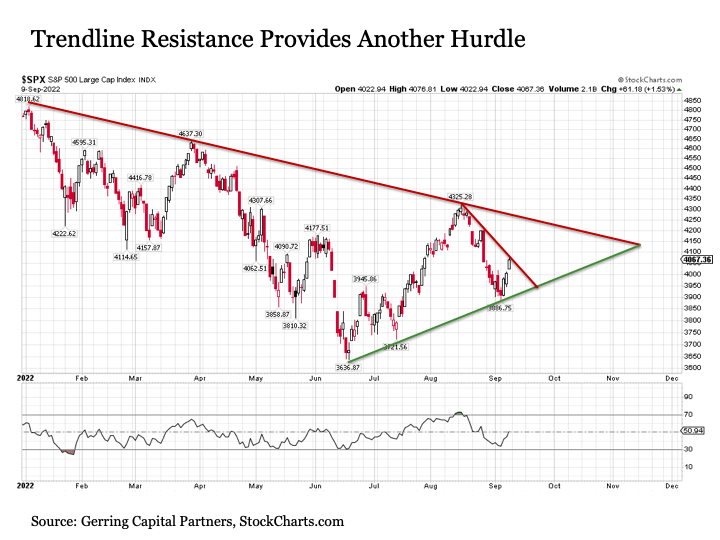
U.S. stocks are also confronting several layers of trendline resistance. The S&P 500 has been in a narrowing wedge pattern over the last several months. At the current rate, this wedge pattern is set to converge by November and will impose a breakout or breakdown outcome on the S&P 500. At present, current odds favor a downside breakdown due in part to the ongoing effects of a slowing economy along with an increasingly tightening U.S. Federal Reserve. In the meantime, despite enjoying rising downside support since mid-June, stocks may be hard pressed to break above the downward sloping trendline that has served as resistance on three separate occasions since the start of the year. It is also possible that stocks may soon be stopped in their tracks in this latest rally, as the S&P 500 has also reached a short-term downward sloping trend resistance dating back to its August peaks. With the Relative Strength Index ((RSI)) for the S&P 500 having returned to the 50 level, it would not be surprising to see stocks turn back lower at current trendline resistance levels as soon as early this upcoming week.
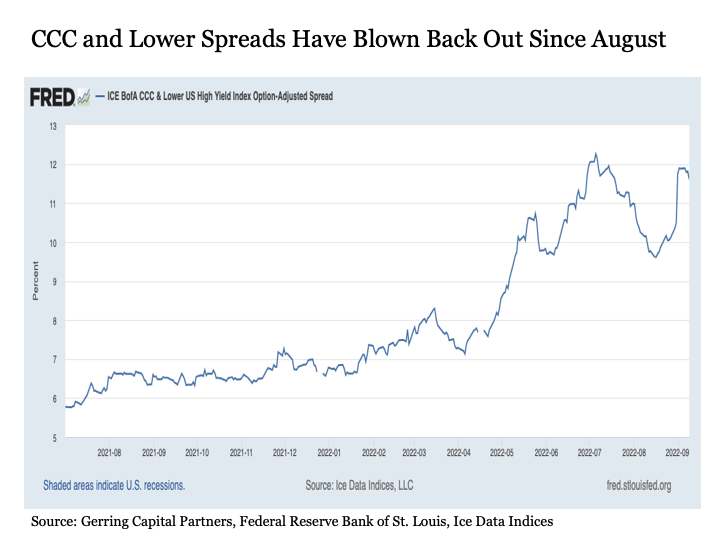
Fundamental issues . In addition to a slowing economy, deteriorating corporate earnings growth, aggressively tightening monetary policy, and persistent inflation pressures, U.S. stocks are also confronted with an issue related to speculative grade bond spreads that I first raised in an article back in August. At the time, the lowest quality segment of the U.S. corporate high yield bond market, which are CCC-rated and below credits, were benefitting from a sharp narrowing of the spread, or yield premium, that investors were requiring to own these speculative bonds instead of comparably dated U.S. Treasuries. I warned at the time that the tightening of spreads may prove fleeting and that CCC and below spreads may soon balloon back out.
And balloon out they have. After bottoming a day before the bear market rally peak on August 15, CCC and lower rated spread have widened by more than two percentage points to more than 11.6%.
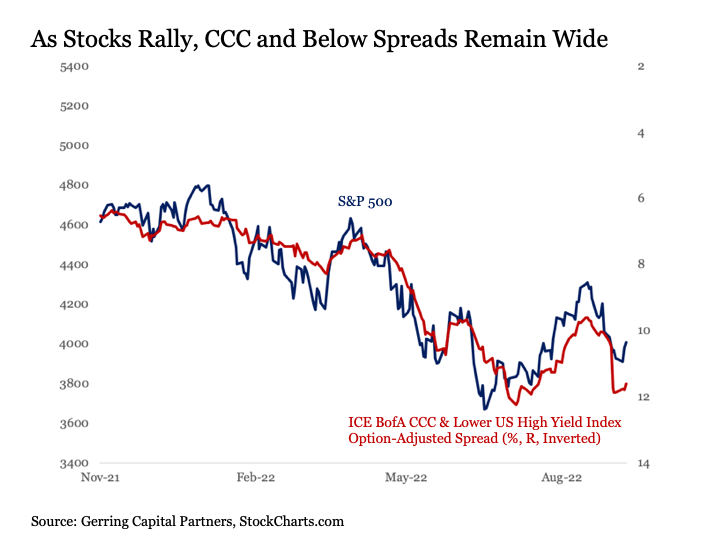
Why does this matter? Because the performance of the S&P 500 and CCC and lower spreads have been highly correlated since before Thanksgiving last year. When CCC and lower spreads are widening, the S&P 500 has fallen. And when CCC and lower spreads have narrowed, the S&P 500 has rallied. So while the S&P 500 Index has rallied strongly since late last week, CCC and lower spreads have remained stubbornly wide. This notable lack of confirmation behind the latest stock rally suggests any further upside may be fleeting and a turn back to the downside may be forthcoming as soon as the upcoming trading week.
Historical precedence . Despite the strong late week rally in U.S. stocks, a rare ominous event took place. On Friday, 200-day moving average (red line in chart below) on the S&P 500 crossed below the 400-day moving average (pink line). While a crossover of only one trading day for these long-term trend lines is far too short to draw any conclusions, the fact that this cross took place at all is notable in and of itself.
Only 18 previous times in the past hundred years for U.S. stocks have we seen where the 200-day moving average crossed below the 400-day moving average as it did on Friday. Unfortunately, this puts today’s stock market in 2022 in some dubious past company.
The good (relatively) . In selected past instances, the subsequent correction in stocks proved fleeting, where stocks found a final bottom within a few months. This included 1957, 1962, 1984, 1987, 1990, and most recently in 2016, representing one-third of all past outcomes. What is immediately notable is that in all of these past instances, monetary policy from the U.S. Federal Reserve was notably accommodative, as the Federal Funds Effective Rate was either reduced swiftly or the rate was already very low and the annual inflation rate was already low or steadily falling from already reasonable levels. Virtually none of these characteristics are similar to what we are seeing today.
The bad . In another one-third of these 18 past instances, stocks fell into a more sustainable correction lasting at least six months to well over a year. This included 1953, 1960, 1966, 1969, 1977, and 1981.
What defined many of these more pronounced prolonged corrections is that they took place during the inflationary period of the late 1960s through the early 1980s. And all six took place during periods where the U.S. Federal Reserve was assertively raising interest rates. This sounds more similar to today’s circumstances.
One key notable characteristic of these past instances, however, is that what ultimately brought stock market relief during these years was that the Fed relented and reversed tightening monetary policy by lowering interest rates. This, of course, strikes a stark contrast to a Federal Reserve today that is steaming full speed ahead with further interest rate increases to fight the persistent inflation battle, despite signs of a weakening global economy and an S&P 500 that has already ventured into bear market territory in 2022. While only time will tell if today’s Fed eventually pulls back, all of their talk remains on plans to continue tightening monetary policy.
The ugly . The final one-third of these past 18 instances took place during some of the most dubious years in capital market history. These include 1929, 1937, 1940, 1973, 2000, and 2008. It’s like a Who’s Who list of really bad stock market crashes over the past century. Whether 2022 joins this notorious bottom one-third in this 18 past member category remains to be seen, it is worth noting that all of these past instances either involved bubbles that were left to inflate for far too long (1929, 1973, 2000, and 2008 – recall that many refer to the today’s market in 2022 as “the everything bubble”), monetary policy that tightened too far (1937), or the onset of a major new World War (1940).
Hopefully, 2022 will be able to steer clear of the ugly outcomes and land in the bad or even the good categories. But one cannot help to see at least some of the similarities that today’s market exhibits with those in the ugly group. And none of this bodes well for stocks continuing their recent bounce too much further in the coming days or weeks.
Bottom line . No shortage of reasons exist that have the potential to stop the latest U.S. stock market rally in its tracks and resume their move to the downside. As a result, investors that remain heavily overweight U.S. stocks may be well served to consider reallocating from a risk control and increased portfolio diversification perspective. But for those investors that have been prepared for what 2022 has brought so far and adjusted their asset allocation in advance, changes if any at this point should be made on the margins at most.
For further details see:
Born Under Some Bad Signs