OVV - BP: Becoming Interesting At Current Levels
2023-05-23 08:00:00 ET
Summary
- Follow along as we examine the fundamentals for BP with Lyn Alden.
- Also, we take a look into the Oil/Energy sector and seek the synergy between the fundamentals and the technicals.
- The Fibonacci Princess Proclamation, a new feature in our articles designed with swing traders in mind, sizes up BP, XLE and XOP.
By Levi at StockWaves; produced with Avi Gilburt
We are absolutely surrounded by some amazing talents from the world of stock analysis. It’s of such great benefit to have research presented from different angles and methodologies. And, when these coalesce into the same conclusion, it makes for high-probability investing and trading.
We will look at the fundamentals first with Lyn Alden. Then, the Fibonacci Princess Proclamation, and finally the big picture via the technicals.
Oil Outlook With Lyn Alden
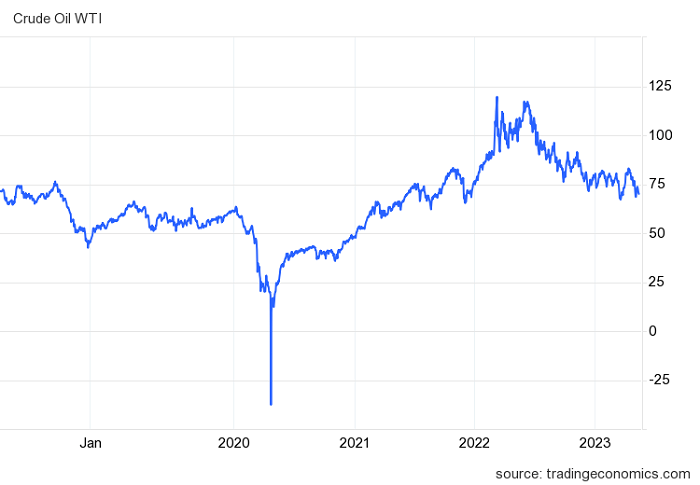
WTI crude has been chopping along between the high $60s and low $70s a barrel since late last year.
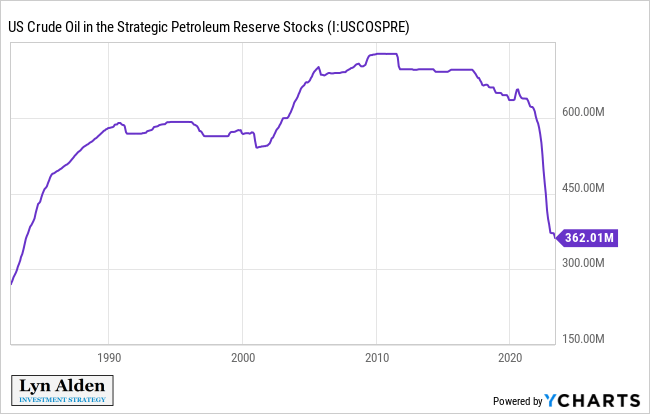
The United States continues to draw down its Strategic Petroleum Reserve, although the energy secretary said they might begin refilling it in the second half of the year.
Recessions can reduce demand for oil around the margins, although the low economic growth rate (PMI below 50, for example) has likely already done a lot of that. There are all sorts of things that could push oil lower in the next six months or so, but the long-term supply and demand picture remains very attractive.
The iShares Global Energy ETF ( IXC ) is one of the easiest ways to get diversified long-term exposure to oil stocks. Exxon Mobil ( XOM ) and Chevron ( CVX ) make up a little over a quarter of the fund, followed by the European and Canadian oil majors, and then various other North American producers and pipeline operators. It has a 0.40% annual expense ratio which is reasonable.
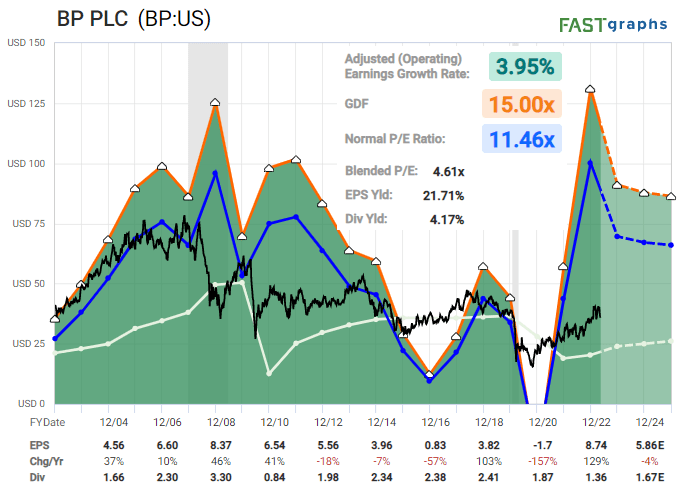
Aside from that, BP (BP) is becoming interesting at current levels .
BP is one of the least-liked oil majors, partly because of the 2010 Deepwater Horizon disaster (which they have paid tens of billions of dollars over) and partly because BP has gone back and forth a bit on the energy transition topic. While Exxon Mobil takes a stance that they are an oil and gas company, BP has attempted to take an approach of embracing the energy transition theme in a more diversified way.
In addition to producing oil and gas, BP is heavily investing in electric charging stations, biofuels, hydrogen fuels, and truck stops with convenience stores and fueling stations. In general, the European oil majors have invested more into non-hydrocarbon energy than U.S. oil majors have, and the market hasn't really liked that. BP trades at a lower valuation than its peers, at under 6x forward earnings.
The company pays a dividend yield of over 4%, is aggressively buying back inexpensive shares, and has sharply reduced its net debt. While I don't think the management is exceptional, the assets have a wide capital moat, the company is cheap, and actively making use of its cheapness by returning capital to shareholders.
I think a number of oil major stocks have a good probability of going up 2x or 3x in price this decade, while paying out 3-5% dividend yields along the way.
The Fibonacci Princess Proclamation
Tammy Marshall, The Fibonacci Princess, shares with us how the near term shapes up and gives us specific levels for swing trades in both directions.
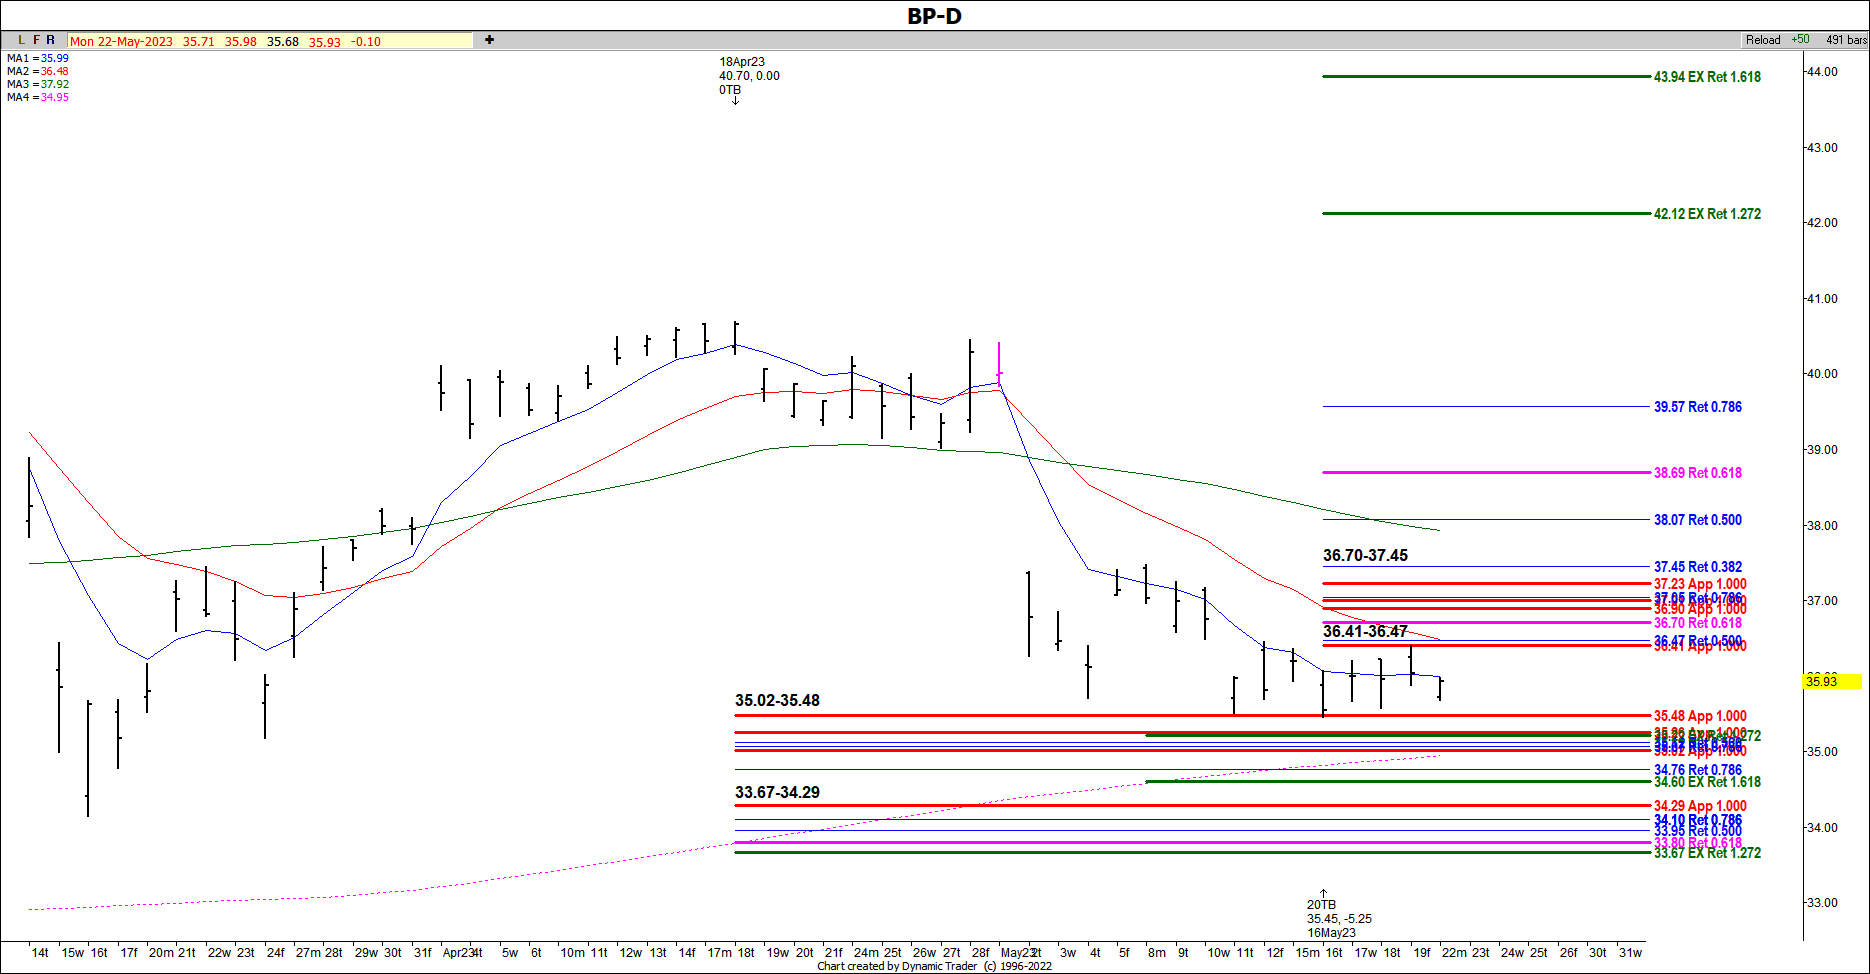
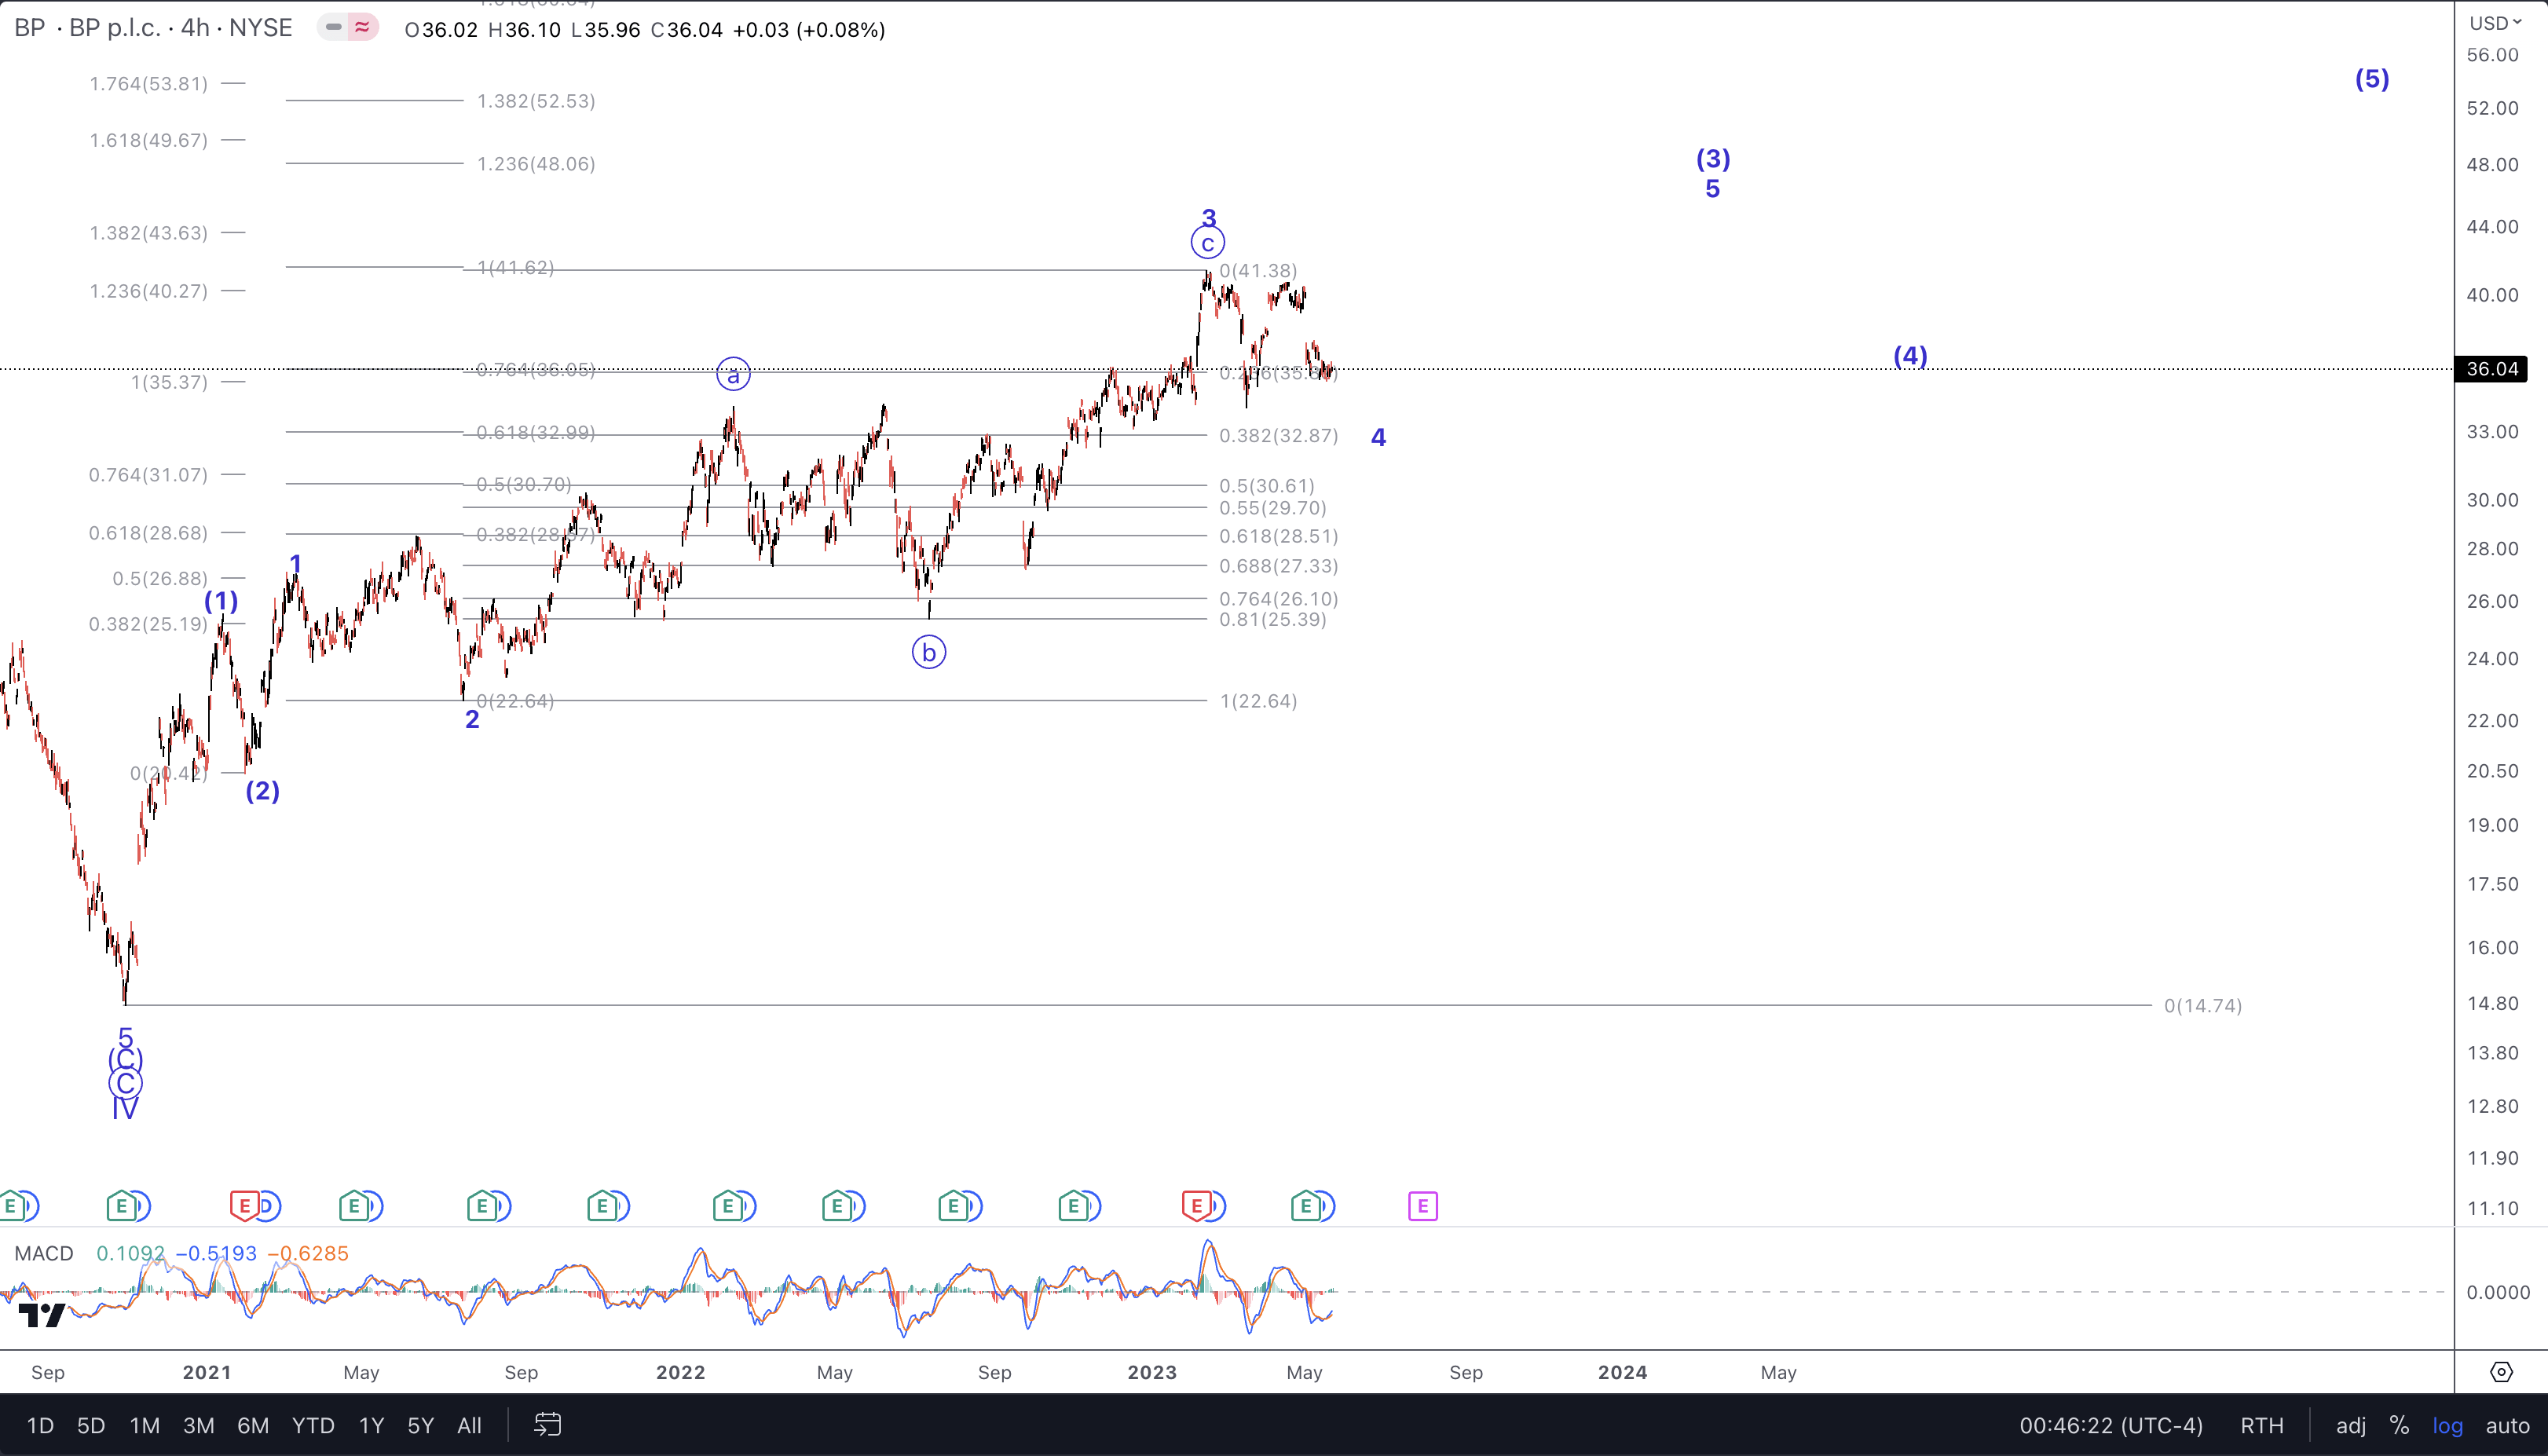
BP: Price action is above the 200 SMA, so you can make a case for the bulls. If you'd like to buy, support is $35.02-35.48 or a lower zone of $33.67-34.29. However, price is below the 50 SMA and the 5 EMA has fallen below the 13 EMA, so this suggests a bearish trend. If you would like to short BP, I have a lot of symmetry and retracements that form a cluster setup zone of resistance at $36.41-37.45.
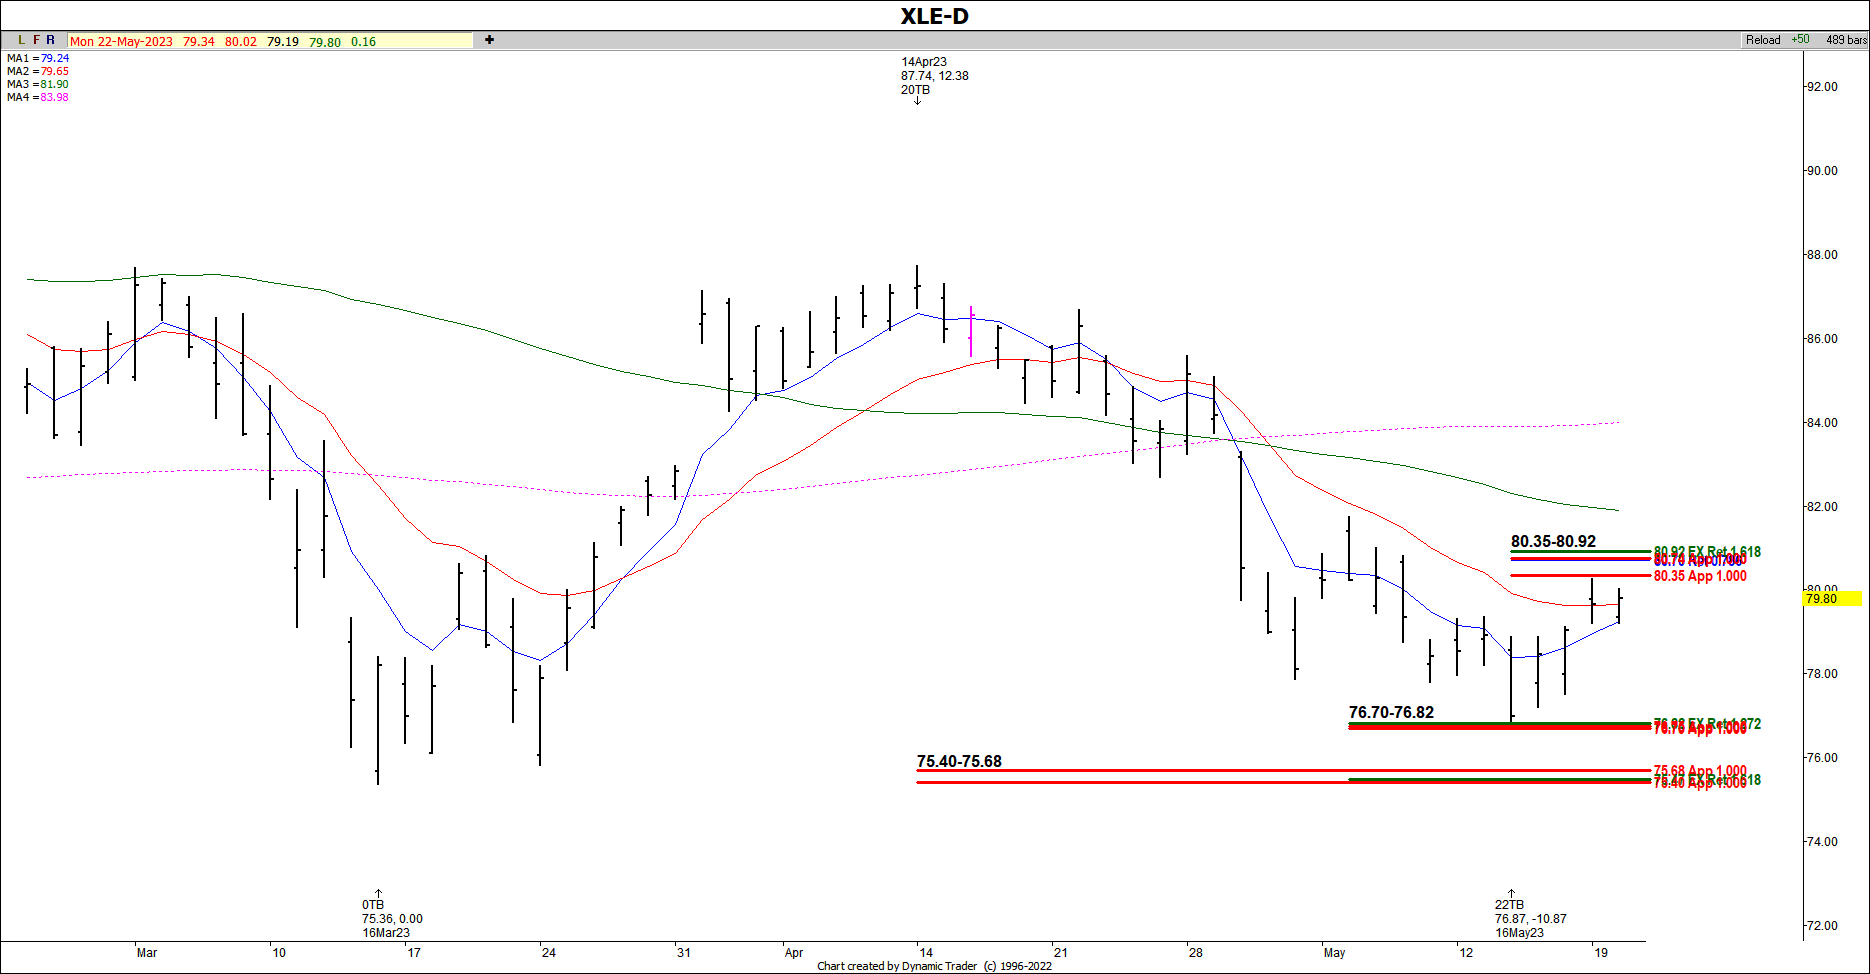
XLE: All of the moving averages are on the side of the bears on XLE, so a short off of $80.35-80.92 would be the trend trade. If you'd like to get countertrend and buy, your risk is defined at $76.70-76.82 or if we go lower off of resistance, the next setup buy zone is $75.40-75.68.
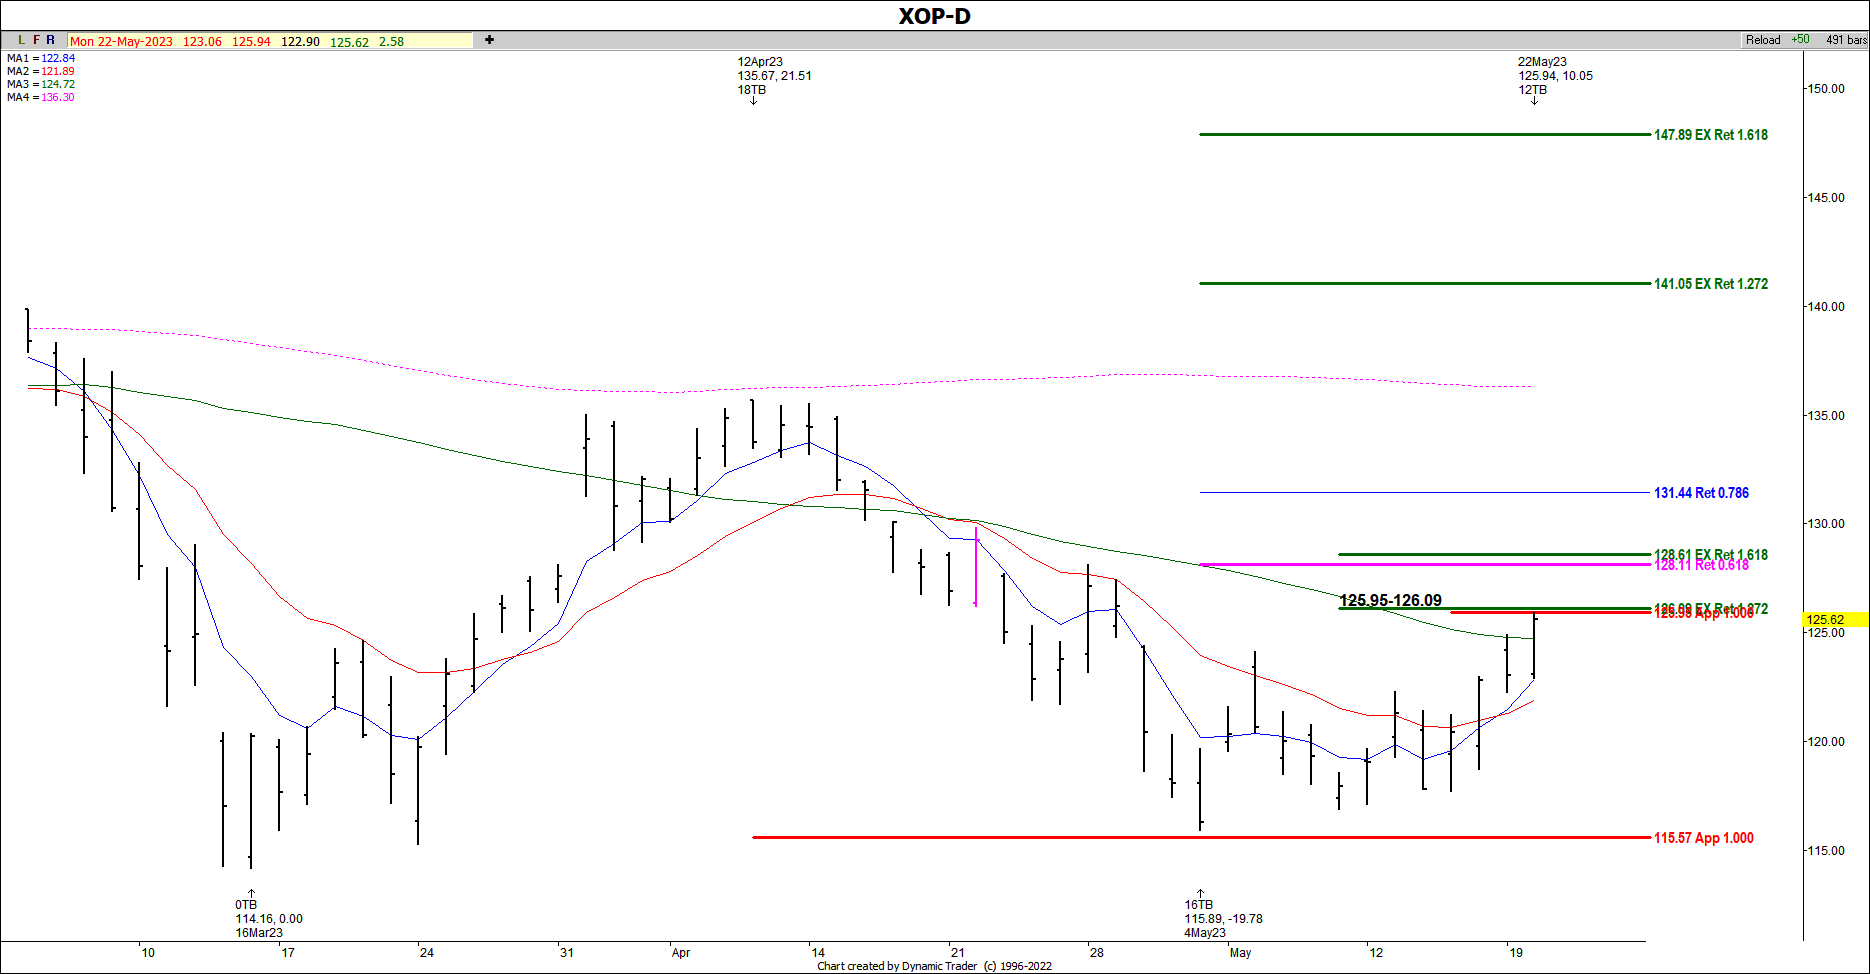
XOP: Price is below the 200SMA, so you can make a case for the bears if you'd like to short. Your zone of risk is $125.95-126.09. If you'd like to buy, we need a pullback for a closer zone of support, since price action is too far away from the symmetry setup of $115.57.
The Bigger Picture Via Technicals
Remember that we observe the structure of price and that this creates predictable patterns that repeat at all time frames. Since the market is fractal in nature, it is this self-similarity that provides us with an anticipated path forward. And, since we view the market from a probabilistic vantage point, we plot the path that is the most likely and will then provide an alternative.
Avi Gilburt compares this to a general preparing a battle plan. A primary plan is laid out with a contingency also made ready. So, you will see on our charts that there will typically be two possible paths, a primary and an alt.
It can also be quite useful to track other names in the same sector. Note the following charts and then our conclusion for BP, Ovintiv (OVV), XLE and XOP.
BP currently has main support in the $33 area. Overhead target for wave [3] is near $50 and wave [5] may eventually reach $60+.
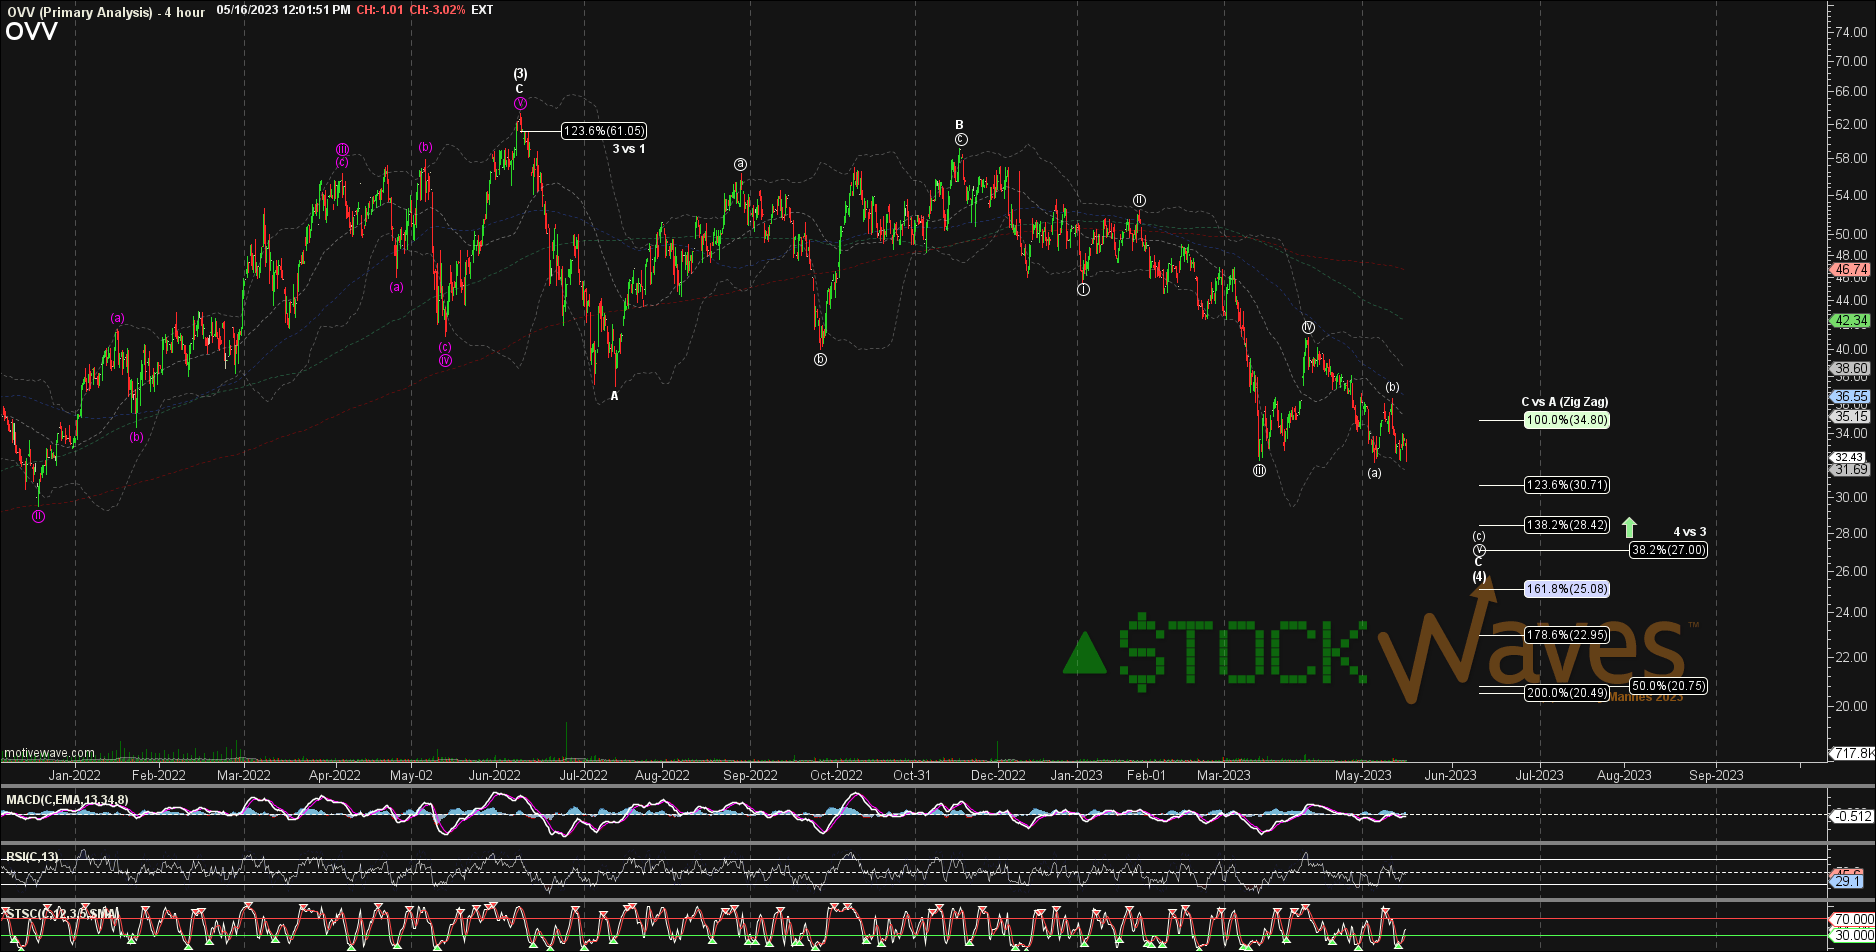
OVV is very close to seeing a major low in wave [4]. We see this one as higher risk vs. BP but with a much higher reward in percent gain possible as well.
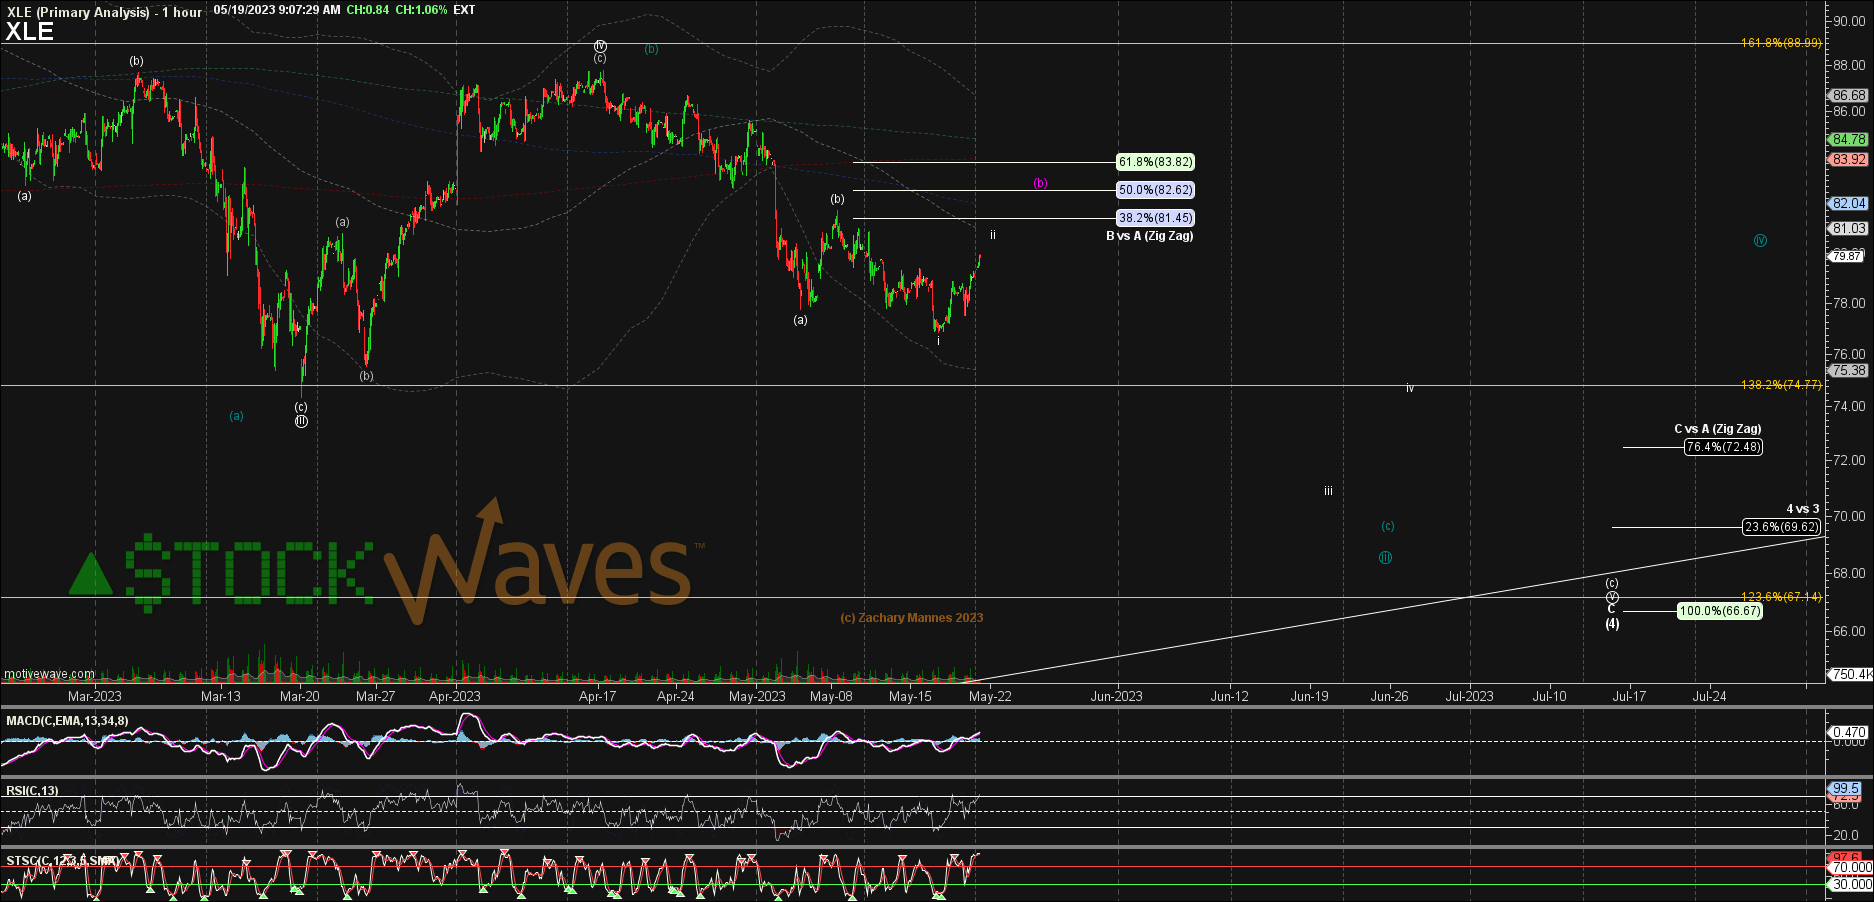
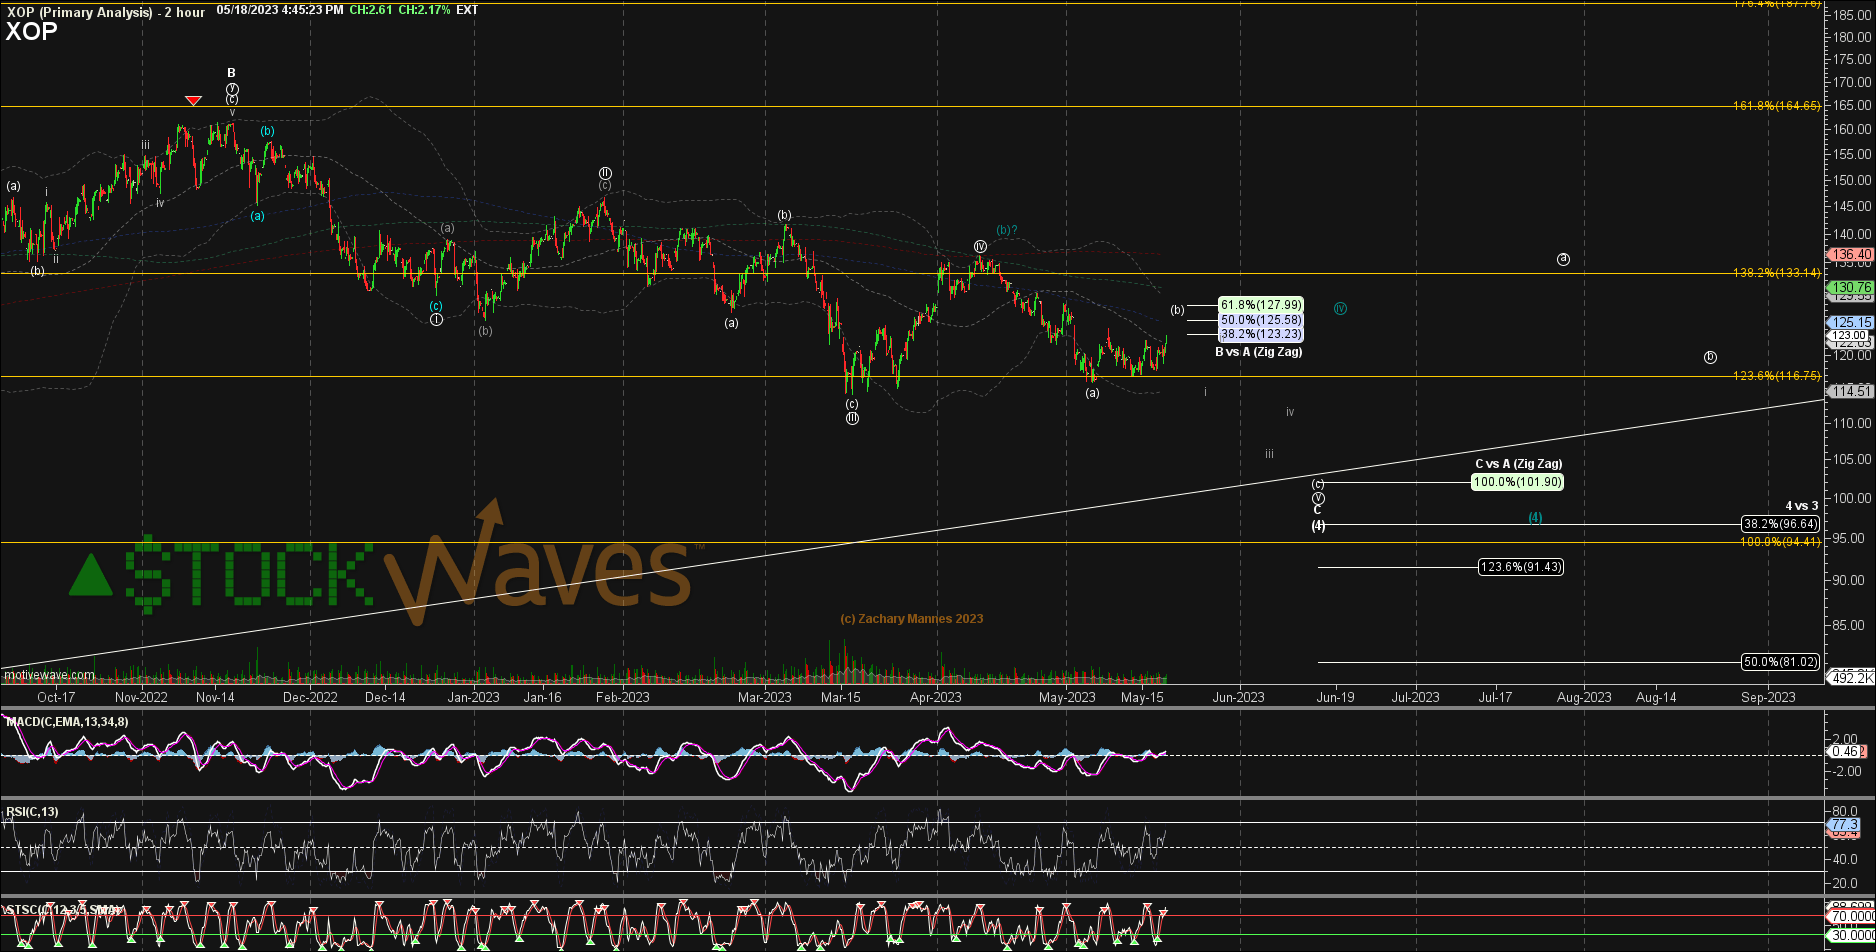
These two sector charts suggest that there is more time needed to complete the corrective structure in their respective 4th waves. On these two charts, the white path is our primary expectation with an alt possible shown in blue.
Risks: should BP see below $33 then the $31 level is the next main support zone. If BP were to decline under $29, then we would reassess the near term bullish picture.
Conclusion
As you may have seen in recent articles published for the readership, our view regarding the Energy sector is slowly edging from bearish to bullish. There are charts that appear to have already found important lows and are starting their next rally phases. Others are nearing the end of their corrective structures.
Also, please recall that it was this same methodology that turned us uber-bullish all things Energy in the Fall of 2020. Then, in late Spring 2022, we were looking for a consolidation phase to set in. The next leg of this rally will likely take several names to double or even triple their current levels. We cover dozens of names on a daily basis for our members.
There are many ways to analyze and track stocks and the market they form. Some are more consistent than others. For us, this method has proved the most reliable and keeps us on the right side of the trade much more often than not. Nothing is perfect in this world, but for those looking to open their eyes to a new universe of trading and investing, why not consider studying this further? It may just be one of the most illuminating projects you undertake.
For further details see:
BP: Becoming Interesting At Current Levels