JLL - Brookdale Senior Living: Tight ROIC Means Future Growth Will Be Expensive
Summary
- Brookdale Senior Living has undergone a significant erosion of value since 2015, as underlying market economics impact its market cap.
- Fundamentals are equally as unfavourable, such that measures of value and growth are compressed.
- We note that to sustain its growth projections, this will come at a high cost to the company and to equity holders.
- Net-net, rate hold.
Investment Thesis Summary
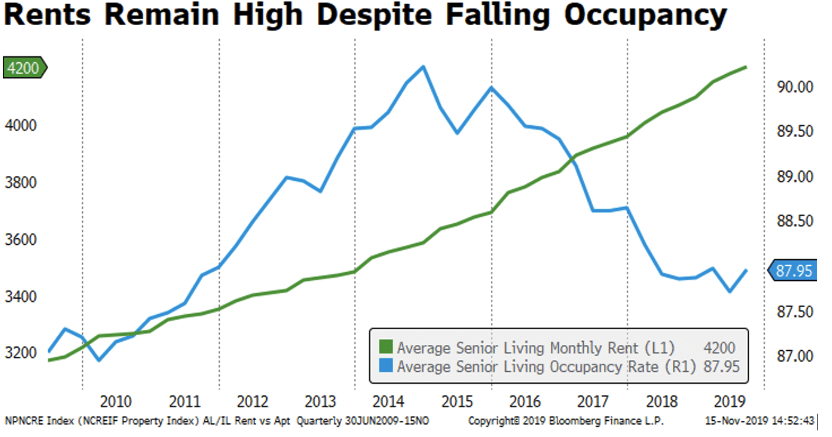
The senior living market is estimated to grow at CAGR 5.65% into 2027, with contrary evidence pointing to a c.5.5% growth into 2030. Wind-back to 2012, and the outlook was for a 8-10% CAGR into the coming decade. Data from JLL ((JLL)) shows that quarterly transaction volume peaked back in 2010 at ~$27Bn, and, despite a sharp recovery in 2015, transaction volume has been on the decline ever since [ see here : "Rolling four-quarter transaction volume"]. This, as the occupancy rates continued to decline from 2014-2019 [Exhibit 1], with the decline extending from 2019 from 87.9% to 78.7% in 2021 according to research published by Statista this year.
Exhibit 1. Senior living occupancy rates have been on the decline since 2014/15'
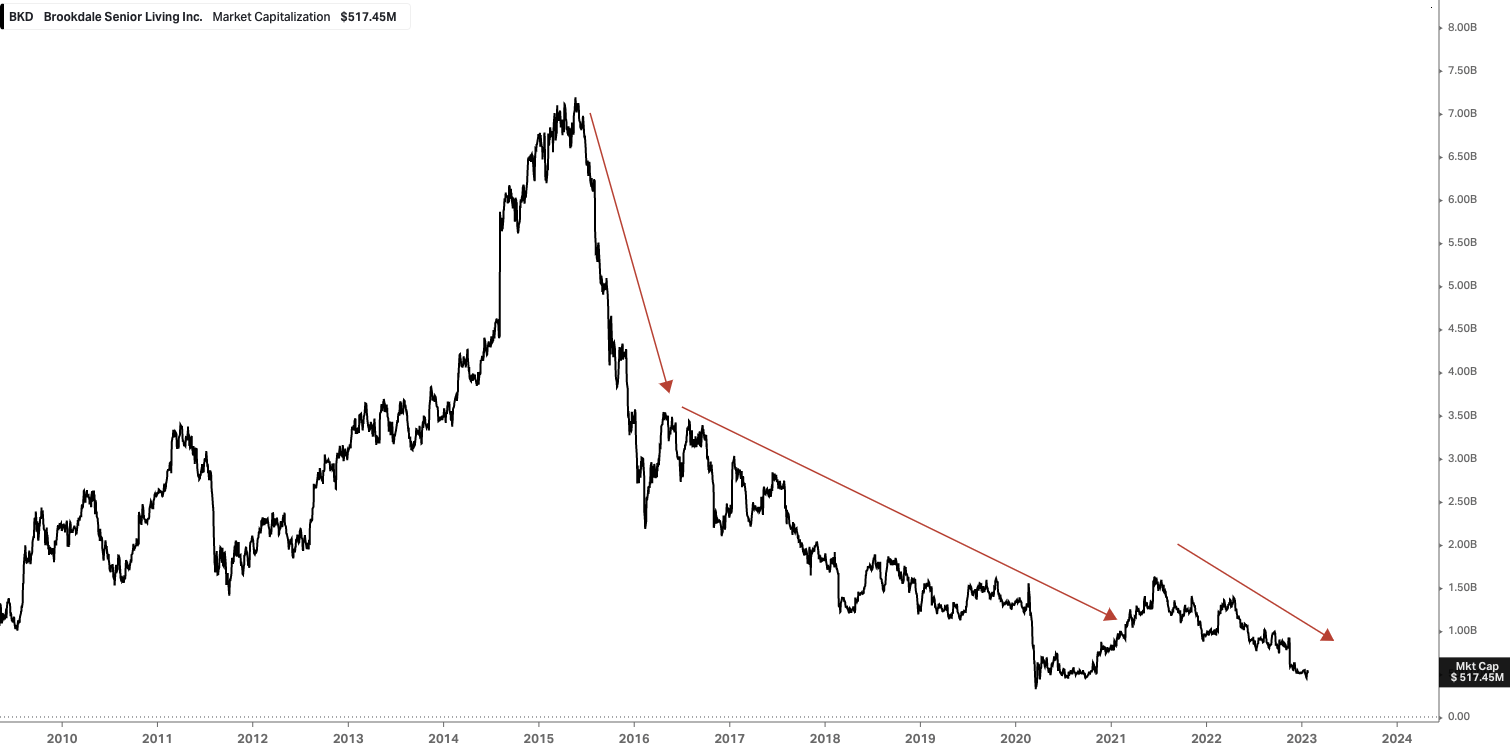
At the same time, players in the senior living space have incurred mammoth declines in market value, with trends prevailing into the present day. Such is the case with Brookdale Senior Living ( BKD ), currently the largest publicly listed senior living and care provider in terms of facilities. This is a company that has endured an enormous destruction of market capitalization since 2015 [Exhibit 2], in tandem with the undercurrents of the senior living market.
Exhibit 2. Tremendous market cap erosion for BKD 2015-date, in tandem with underlying market trends
Although, it's not just the underlying market that's compressed capital appreciation in its share price. The company has exhibited large pullback in revenue and operating income over this time, leading to a negative annualized growth rate for both of line items since 2015. In particular, revenues have collapsed off FY15' highs of $1.45Bn to a meagre $531mm over the trailing 12 months. With these points in mind, I'm here today to illustrate why we aren't buyers of BKD, even at these compressed market values. The stock trades at 27x trailing EBITDA, and is priced at ~1x book value - although, this is less appealing considering the negative 45% trailing ROE, that lifts to just 10% with the adjustments for depreciation discussed later.
One point of consideration is the raft of leadership changes BKD has announced of late. These are intriguing, and, doubtlessly, the coming periods will be a 'prove it' phase for the new management team. This could result in a positive of negative outlook, in our opinion. Still, future growth looks to come at a high expense considering the low return BKD generates on its investments, coupled with a weak earnings outlook. Net-net, without a directional view on the market, we rate BKD a hold.
Dive into BKD's ability for growth, value creation
The company's ongoing decline in top-line growth is a concern for its ability to grow and generate return from its investments above the cost of capital. It's worth noting that BKD posted its preliminary FY22' results on January 13th, and, whilst very light on numbers, a number of updates were listed. To name a few:
- Current CFO to "terminate employment" effective February 24th this year
- Chief accounting officer to move into the CFO role
- Executive VP of community operations terminated employment on January 12th
- On-track to hit FY22' guidance for RevPAR growth
- Top-line growth to outpace previous expectations
- "Adjusted EBITDA to fall "modestly below the previously issued guidance range" of $250-$260mm.
- Around 100bps increase in facility OpEx in Q4 versus Q3 FY22'.
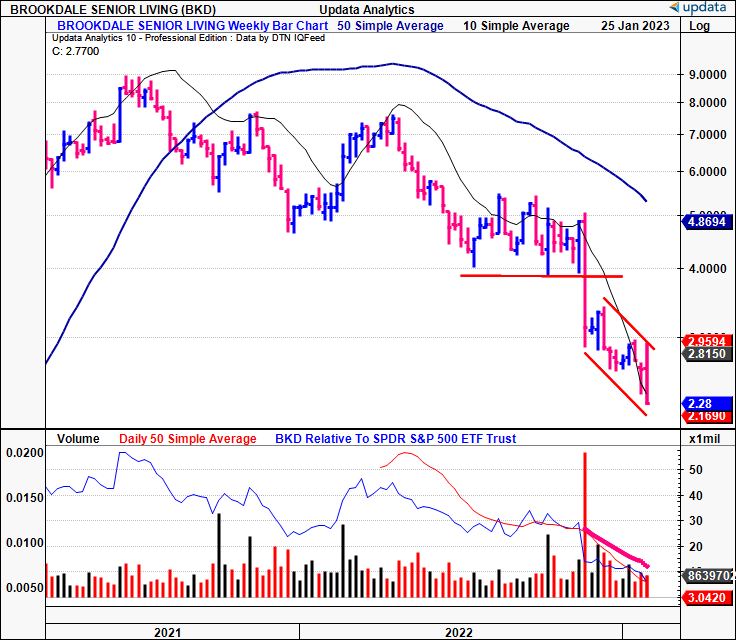
Hence, the company looks to beat at the top-line, but this isn't carried through down the income statement. Investors weren't impressed by this, either. The price response following the announcement has been poor, with the stock closing lower over the last 3 weeks, after a small jump in volatility to the upside [Exhibit 3]. Moreover, the weekly volume trend has been pulling lower since late FY22', coinciding with a steep downtrend over this same period.
Exhibit 3. Price response to preliminary FY22' results update poor, continuing longer-term downtrend
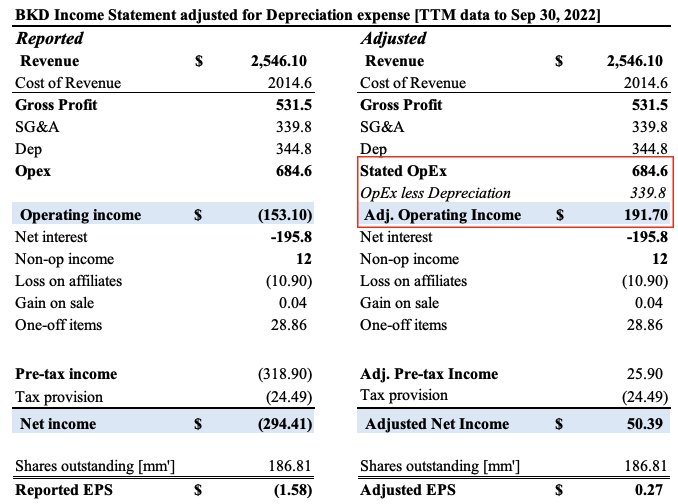
We'd also point out that BKD's reported earnings are heavily skewed by the deprecation it books each period. Keep in mind, that depreciation is a non-cash expense that is recognized on the income statement, reducing operating income. Whilst the depreciation charge has compressed since 2015, the company still clipped $339mm in depreciation in Q3 FY22'. We've highlighted the impact to bottom-line growth this has in Exhibit 4, by reconciling OpEx in backing out depreciation for the TTM to its last earnings report. Note, BKD is set to report its Q4 and full-year FY22' earnings in May. Recalibrating for OpEx, operating and net income without the non-cash depreciation charge, we see BKD book a trailing net profit of $50.4mm and EPS of $0.27.
Exhibit 4. Reconciliation of depreciation charge in Q3 FY22' [TTM data] results in upside changes to earnings
Data: Author, using figures from BKD SEC Filings
Still, BKD also clipped a $29.5mm loss on TTM CFFO in Q3 FY22' - a figure that also adds back reconciles for depreciation - down from $85.9mm the quarter prior, and down from $60mm in Q3 FY21'. The TTM net change in cash across this period fell from $84mm to negative $183mm by Q3 FY22'. Hence, growth is negligent for the company.
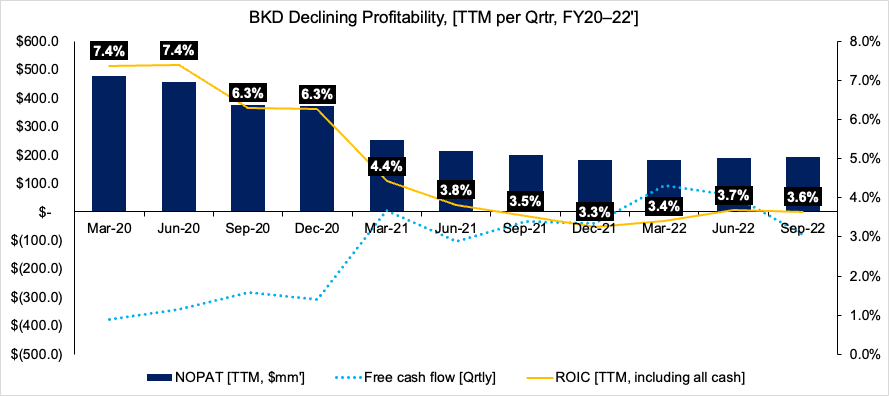
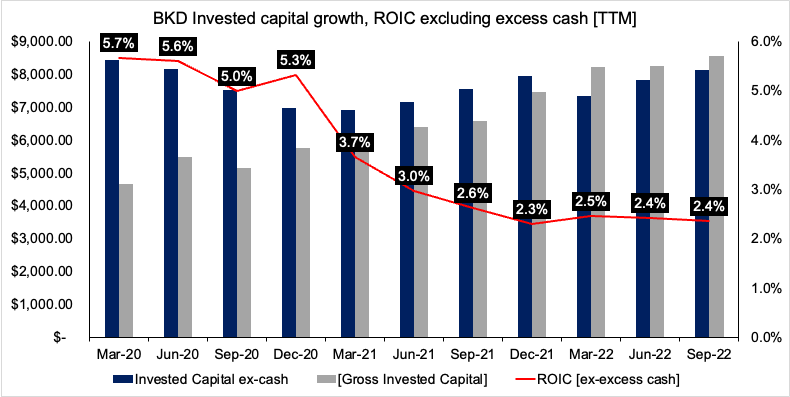
This leads into the next portion of our analysis. We've described BKD's poor growth schedule, what about its ability to create value from its investments? A company can generate value for investors if its investments generate a return above the cost of capital. To examine this, we wanted to see how much NOPAT the company generates from the level of its invested capital. Here, we calculated BKD's NOPAT using EBITDA, to remove the depreciation effect, and noted the company's ROIC has been on a steady decline over the past 2-years [Exhibit 5]. It's also worth noting that ~51.5% of BKD's working capital is comprised of on-balance sheet cash. To deal with this, we adopted research that suggests recognizing cash at 2% of sales as working capital, treating the remainder as excess cash. Doing so, there's even tighter results in ROIC [Exhibit 6].
Exhibit 5. Tightening ROIC for BKD reducing its ability to generate future growth opportunities from organic operations
Note: NOPAT is usually calculated using EBIT. Here, Depreciation is reconciled by calculating NOPAT with EBITDA (Data: Author, BKD SEC Filings)
Exhibit 6. BKD ROIC calculation stripping out excess on-balance sheet cash from working capital
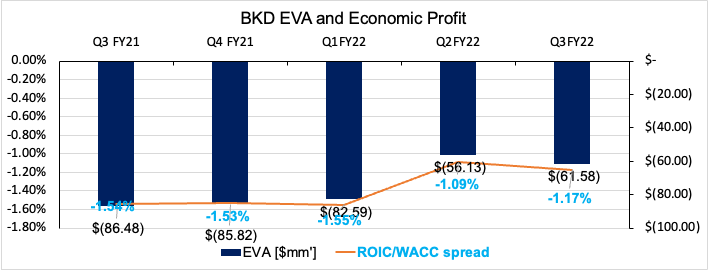
The question then turns to how does these poor returns on capital invested translates to value, or lack thereof, for BKD. You'll see in Exhibit 7 the calculation of the company's economic value added ("EVA") and economic profit ("EP"), both in the negatives since Q3 FY21'. EP measures the spread of ROIC over/under the WACC hurdle, quantifying a company's ability to create future value. As mentioned, a firm should be generating a positive EP, and a negative result means any growth at the top or bottom lines [revenue, earnings] is immediately suspicious because it likely required a large investment, or percentage of income to achieve this.
Exhibit 7. BKD's been generating negative EVA on a sequential basis for some time now
Note: All figures are calculated using TTM values (Data: Author)
We see this impact very clearly when observing Exhibit 8. Using consensus estimates for FY22' EBITDA of $242.8mm, we estimate BKD's growth in TTM NOPAT [depreciation-adjusted] to be ~26.5% from the TTM result in Q3 FY22'. At the abysmal ROIC of 3.64% - that's already below the hurdle rate - it will have to reinvest more than 7x NOPAT to sustain this. Hence, the possibility of distributable cash to equity holders is completely absent. This demonstrates that a low ROIC means that the cost of growth is prohibitively high for BKD, even more so for shareholders. Consensus has the company to print $2.82Bn in FY22' revenues [Exhibit 9], a ~10% YoY growth. With these numbers in mind, we suspect this revenue growth rate will come at a substantial cost to shareholders. Unsurprisingly, the street also bakes in a $170mm free cash outflow on these revenues.
Exhibit 8. Low ROIC means that more than 7x NOPAT must be reinvested to sustain BKD's growth rate
For further details see:
Brookdale Senior Living: Tight ROIC Means Future Growth Will Be Expensive