BEP - Brookfield Renewable Partners: Beware Of 'FFO' Depreciation Is Real
2023-10-23 18:36:22 ET
Summary
- Shares of Brookfield Renewable Partners have dropped 34.5% from 52-week highs, leading to a dividend yield of 6.4%.
- The company's latest quarter showed a 10% increase in non-GAAP Funds From Operation, but heavy debt means interest expenses have also risen.
- Brookfield Renewable Partners' preferred reporting metric, FFO, does not include depreciation, which is a significant factor for an asset-heavy infrastructure business.
- In an operating profit analysis using 50% of depreciation, the business still has a low ROIC of 2.8% making it hard to leverage returns for equity investors.
Shares of Brookfield Renewable Partners ( BEP ) have taken a 34.5% plunge from 52-week highs along with a lot of other renewable energy and infrastructure companies in the high interest rate environment pushing its dividend yield up to 6.4%. The company is a buyer of their own shares at current prices, having initiated an automated share repurchase plan on October 3rd but I am a little more skeptical of this low ROIC business in the current environment as this article will explore.
In the company's latest quarter, management reported a 10% increase in their preferred non-GAAP Funds From Operation figure to $312 million ($0.48 per share) but the company's heavy debt load also meant interest expenses rose +36.7% to $402 million. This article will take a critical look at Brookfield Renewable Partners' FFO figures as we look to establish a realistic and sustainable cash flow analysis that includes some level of depreciation for this asset heavy business.
Latest Quarterly Results
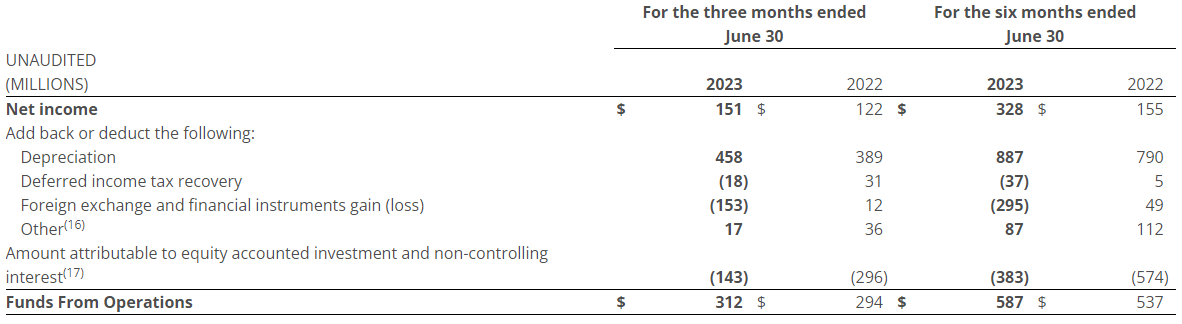
BEP last released Q2 2023 results August 4th which showed a 10% increase in managements non-GAAP funds from operations ("FFO") to $312 million ($0.48/share) from 294 million ($0.46/share). In terms of GAAP net income (loss) which includes depreciation, the company reported a loss of $39 million in the quarter, a $40 million decrease from the prior year $1 million net income. We will talk more about the differences in management's FFO to non-GAAP measures later but below is the reconciliation to net income provided by the company.
FFO to Net Income Reconciliation (from company Q2 2023 earnings release)
Revenues of $1,205 million for the quarter were down $69 million (-5.4%) but for the six month YTD period were up $126 million (+5.2%). COGS of $425 million for the quarter were up $59 million (+16.1%) and YTD increased $110 million (+15.4%). Together this resulted in YTD gross profits of 1,710 million only increasing $16 million (+0.9%). BEP has inflation escalations in the vast majority of their contracts which should allow the company to earn higher returns from its fixed asset base but the latest quarterly results don't seem to be showing that.
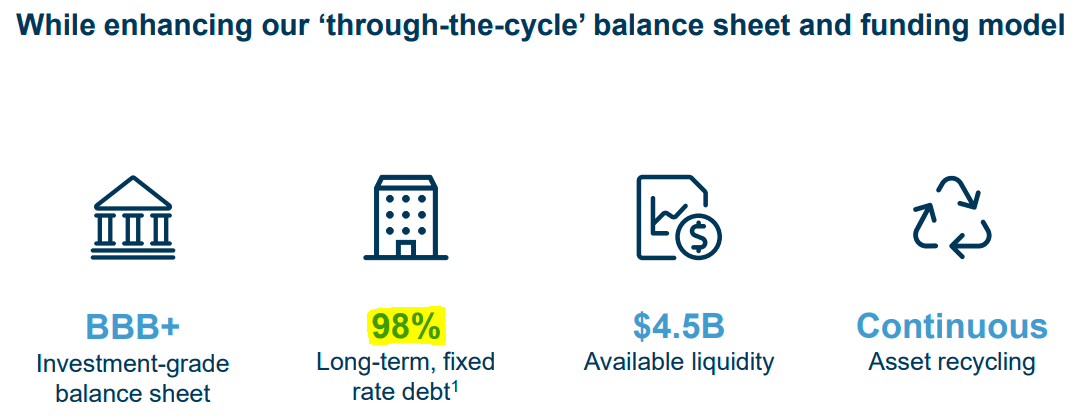
Interest expenses were $402 million (+36.7%) in the quarter compared to $294 million in the year ago quarter. This partially reflects the 8.7% higher average debt balance outstanding of $24.8 billion over the quarter compared to $22.8 billion in the prior year, but the rest of the 36.7% increase must come from interest rate increase effects. Management claims they are temporarily shielded from interest rate increases due to 98% of the company's debt being fixed , but this YoY analysis of the quarterly results tells a different story.
Balance Sheet Highlights (from company Q2 2023 presentation)
In the company's "asset recycling" program, properties and infrastructure are intensified and sold at higher valuations. This strategy also means that the business is more susceptible to capital market swings than the underlying infrastructure assets would suggest, which is what we are seeing now. In the low interest rate environment the past few years, renewable energy and infrastructure companies had a great environment to create nicely leveraged returns for equity investors. Brookfield Renewable Partners was one of the companies using the environment to their advantage to bring new projects to market. Unfortunately, the cost of debt has risen, and dramatically.
BEP has 25,900 MW of renewable energy operating capacity across the globe and the company also has a leading global development pipeline of 134GW. The company's scale and clout give it access to some of the biggest and largest global deals few other players can compete in with the help of institutional co-investor relationships. However, energy markets are competitive, politically sensitive, and regulated meaning that returns on capital are low as this article will explore.
Be Careful of Non-GAAP Metrics
It is crucial to note that Brookfield Renewable Partners' preferred reporting metric, funds from operations (FFO), is a non-GAAP metric that does not include depreciation. Investors always have to be wary of non-GAAP metrics such as FFO and EBITDA as they are subject to management biases and can exclude significant items. Value investors familiar with Warren Buffett will recall he has lectured investors in the past on his issues with EBITDA.
Brookfield Asset Management ( BAM ) uses FFO like a lot of other companies in the alternative asset investment fund space. Brookfield Corporation ( BN ) is one of the largest alternative asset managers in the world with funds and partnerships across infrastructure ( BIP ) and real estate. In the case of Brookfield Renewable Partners and FFO, depreciation is a material item for an asset-heavy infrastructure business which needs constant capital expenditures to maintain the operating performance of assets and keep up to regulatory standards. The significance of depreciation can be seen in the breakdown of the company's operating results highlighted above as well as the analysis of the company we will discuss next.
Operating Profit Analysis
The issue with management's FFO is that it adds back 100% of depreciation as if the company's assets will last forever with the ongoing maintenance spending. While this might be appropriate for certain assets like real estate where land and location are the dominant drivers of value, in the technologically advanced renewable power industry I would expect assets to have a more finite life.
Operating in the regulated and politically sensitive power supply business comes with significant liability as California's wildfires and PG&E's ( PCG ) subsequent lawsuits show. Large and unique projects like hydro dams might be one thing, but solar and wind farm equipment would have a finite lifespan as well as being subject to competitive pressures and technological obsolescence with more efficient assets constantly being developed. I would hope BEP is taking the depreciation of assets seriously.
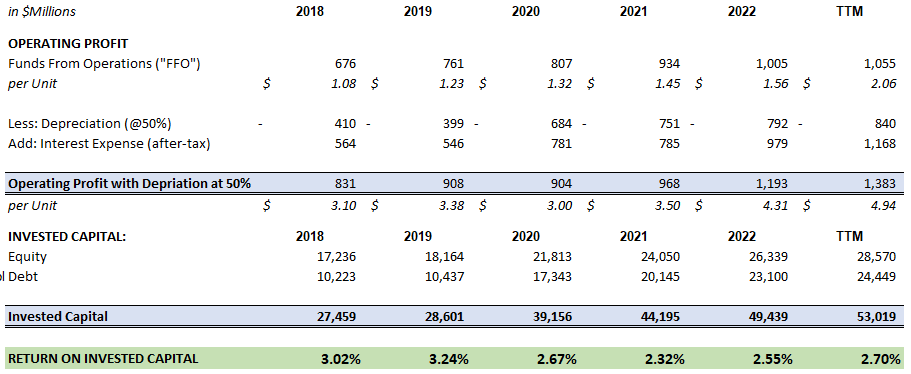
The return analysis in this article will take the middle ground, 50%, between management's FFO with no depreciation and the full depreciation going through the income statement. This TTM $840 million in depreciation represents only 1.7% of the company's $49.6 billion of property, plant, and equipment as of the beginning Q2 2022 beginning for the TTM period. This level of depreciation would imply around a 58.8 year average life which seems reasonable in my opinion. Giving this a double sanity check, I looked up wind turbine life span's and GE's largest Haliade-X wind turbine has a useful life of 25 years but it might be able to be extended to 35 years with good maintenance.
Return on Invested Capital Analysis (compiled by author from company financials)
In this analysis aiming for sustainable adjusted operating income available to all capital providers (equity & debt), the returns on invested capital ((ROIC)) are slim, averaging only 2.8% over the period. These are long-term assets that will benefit to some degree from inflation within their regulated markets, which should help increase future profits on the fixed asset base. However, I was surprised to find BEP's current ROIC was so low.
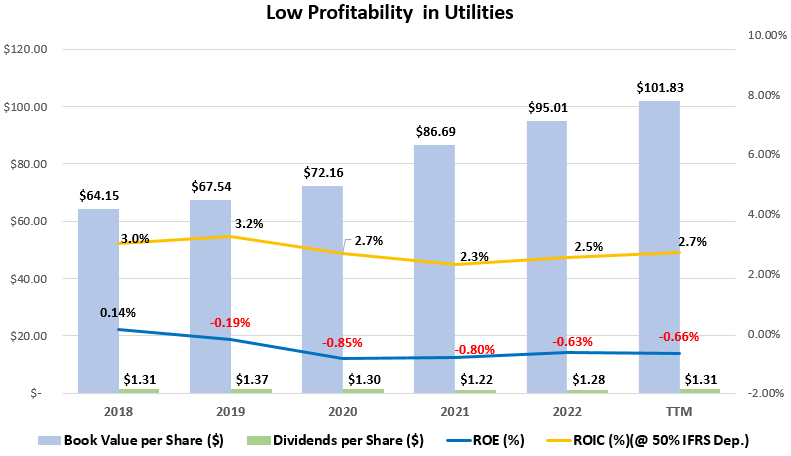
While FFO and how management thinks about the business might be backing out non-cash depreciation, investors need to remember that the company also had $2.3 billion in real cash capital expenditures in the latest year, 1.4x the amount of depreciation. While BEP has a nice asset portfolio, the company has only been able to achieve an average ROE of 0.5% and ROIC (@ 50% depreciation) of 2.8% respectively over the past five years as can be seen in the graph below. This level of profitability is well below my rule of thumb of 15% ROE and 9% ROIC.
Historical Profitability And Growth (compiled by author from company financials)
With annualized long-term average generation of approximately 71,400 GWh in the latest quarter, compared to 62,300 GWh LTA last year in Q2 2022 , this 1.4x CapEx spending has contributed to 9,100 GWh (+14.6%) of growth. The 40% extra in CapEx spending over depreciation compared to the +14.6% increase in capacity looks to me like a lot of that CapEx is really sustainable maintenance and mandatory (often regulatory) improvements to the assets. On that note, let's take a look at the debt burden of the business.
Rising Debt and Low Interest Coverage
Since 2018, debt at BEP has continued to increase to $24.4 billion (2.31x financial leverage) in the latest quarter as can be seen in the chart below. The company's interest coverage ratio (from IS using 100% depreciation) was a worrying 0.95x in the TTM period. As discussed previously, this deprecation is not cash flow necessarily, but with the heavy capital expenditure needs of the company, debt has continuously risen to finance the spending as can be seen.
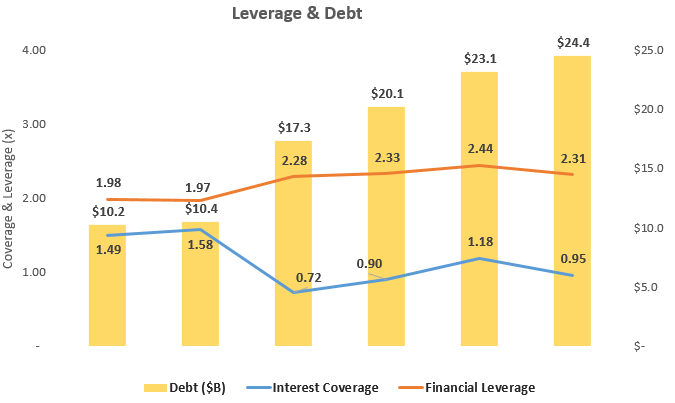
Debt, Leverage, and Interest Coverage (compiled by author from company financials)
Looking at the $1.46 billion TTM interest expense to the average amount of debt outstanding over the last year would imply an average cost of interest around 6.1%. This is a decently high cost of debt and above the historical ROIC using the 50% of depreciation discussed earlier which brings into question the long-term sustainability of economics and dividends to unitholders.
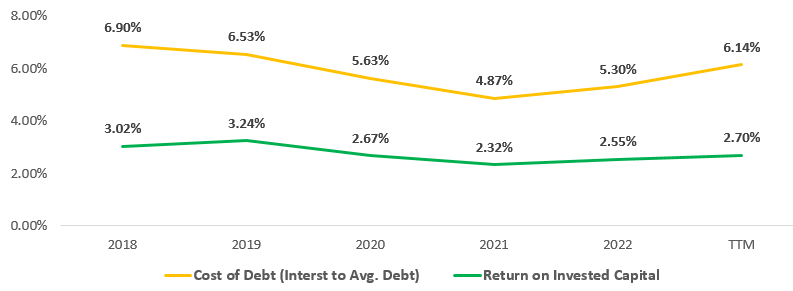
ROIC vs Cost of Debt (compiled by author from company financials)
Takeaway for Investors
Brookfield Renewable Partners has some great global assets but like many highly leveraged fixed asset businesses, they are struggling in a higher interest rate environment. Profits are slim when including depreciation and investors should be wary of taking management's non-GAAP FFO metric which excludes depreciation without a grain of salt. In our middle point analysis using 50% of depreciation, the business still has a low ROIC of 2.8%. BEP's shares are not too appealing for me in the higher interest rate environment.
For further details see:
Brookfield Renewable Partners: Beware Of 'FFO', Depreciation Is Real