BSTZ - BST: Private Equity High Interest Rates Haunt This 9.80% Yielding Science And Technology CEF
2023-09-27 15:57:46 ET
Summary
- The BlackRock Science and Technology Trust currently makes $0.25 per share monthly distributions, offering its closed-end fund shareholders an incredible 9.80% yield.
- However, recent distributions are estimated to be 100% return of capital, and the CEF's faltering share price indicates its underlying assets are not performing well enough to cover the distribution.
- My analysis reveals a weak private equity market and preferred security selections that were negatively impacted by high interest rates, largely overshadowing the exceptional performance of its common stock holdings.
- Due to its closed structure, shareholders also should consider market sentiment changes. BST's holdings still appear solid, but weak sales and earnings surprises could lead to the fund trading at a substantial discount to NAV.
- I rate BST as a "sell". The public and private market environments are substantially different than in 2020 when BST gained 69%, and investors should re-evaluate the risk they're willing to take just to earn a high yield.
Investment Thesis
The subject of today's article is the BlackRock Science and Technology Trust ( BST ), a perpetual closed-end fund trading at a 2.12% discount to its net asset value and featuring a 9.80% trailing distribution yield. As with many CEFs, a managed high distribution yield is the key draw, which fund managers achieve with the help of premiums received from selling covered call options on individual securities. However, BST has struggled recently, declining by 3.02% in August and 7.40% MTD through September 24. BST is still up 17.09% YTD for those reinvesting distributions, but that's still less than half its loss in 2022. For a tech-focused fund, that might be unacceptable.
You likely know me as an ETF analyst. I prefer them for lower fees, but CEFs are essential for income investors. Still, they're not as transparent, so you might not always know why they're underperforming or what could turn things around. In this case, I can help. In this article, I'll separate BST's common and preferred stock holdings and highlight the challenges the private equity market has faced in recent years, a key reason for the fund's underperformance. Finally, I'll look at BST's distribution, estimated to be 100% return of capital this year, and evaluate if it's sustainable moving forward. I look forward to taking you through this CEF with a different perspective and hope we can continue the discussion afterward in the comments section.
BST Overview
Strategy and Fees
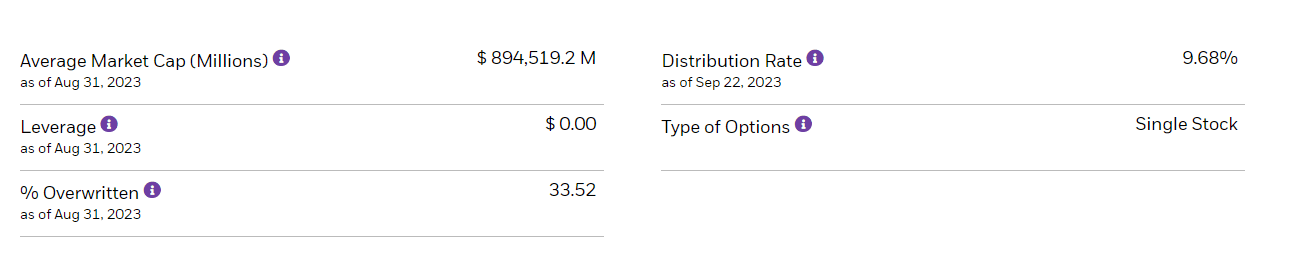
Launched in October 2014, BST aims to meet its income and total return objectives by investing in U.S. and non-U.S. science and technology companies across the entire market capitalization range. According to BlackRock , selections are made based on their "rapid and sustainable growth potential from the development, advancement and use of science and/or technology, and/or potential to generate current income from advantageous dividend yields." The Trust also sells covered call options on a portfolio of the common stocks in the portfolio. Per below, approximately one-third of the portfolio is overwritten, and the CEF has a 9.68% distribution rate and $895 million in assets under management.
This one-third overwritten figure is consistent, as the Internet Archive documents a range of approximately 25% in February 2022 to the 33.52% figure today. Since covered call writing is a risk-reducing strategy designed to generate income, it's reasonable to expect BST to provide at least some downside protection. Still, it depends on what types of stocks it holds.
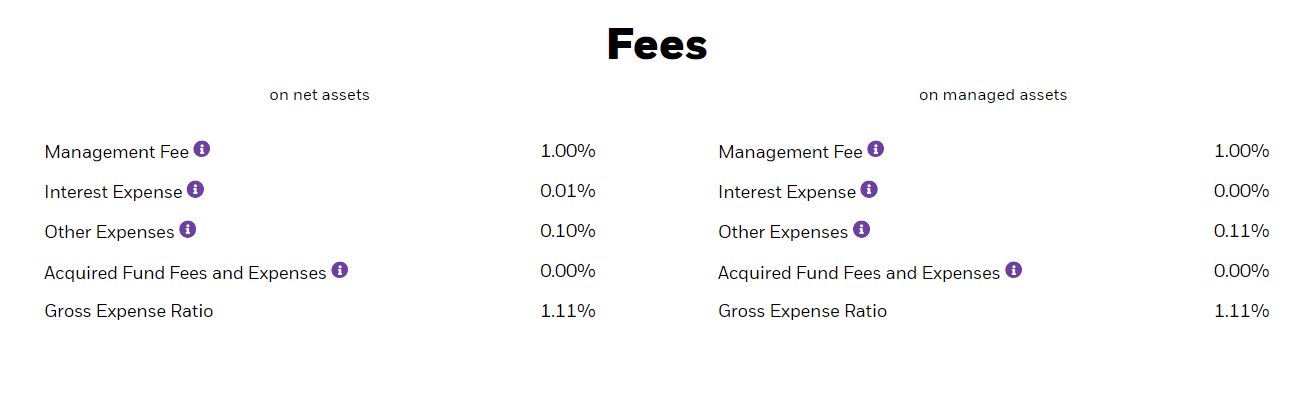
Finally, the graphic below includes BST's fee structure. On net assets, there is a 1.00% management fee, 0.01% in interest expenses, and 0.10% in other costs such as administrative fees.
Basic Structure
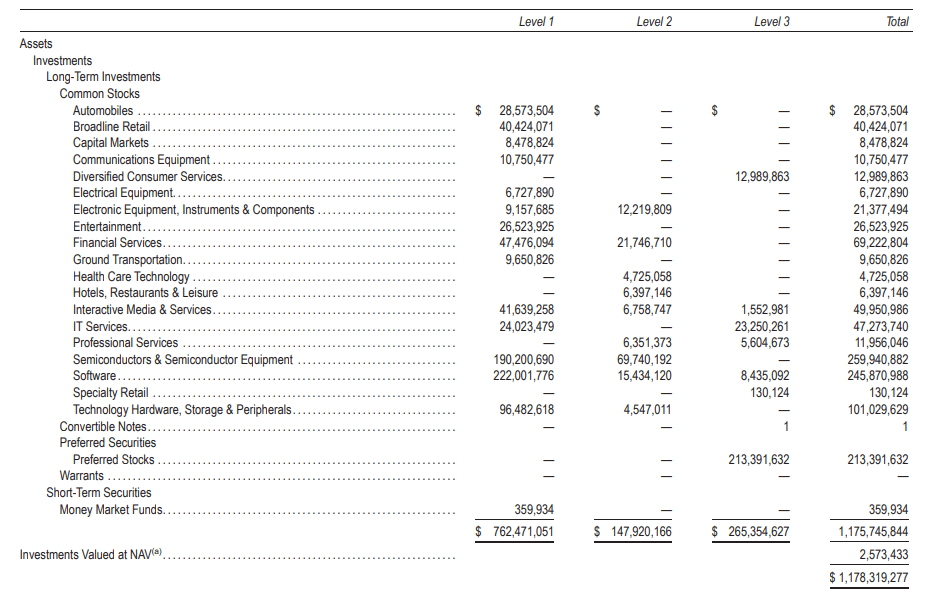
Fund managers must classify assets and liabilities into three broad levels that reflect accuracy to be IFRS compliant. Briefly:
- Level 1 inputs are valued using quoted market prices in active markets
- Level 2 inputs are valued using similar market prices in active markets
- Level 3 inputs have no active market and are valued based on assumptions
According to the latest semi-annual report for June 30, 2023, the breakdown for Level 1, 2, and 3 assets was 64.7%, 12.6%, and 22.5%, respectively. Level 1 assets include publicly-traded stocks and options in active markets; Level 2 assets include stocks like Samsung Electronics, where the company doesn't trade on a U.S. stock exchange nor offer American Depository Receipts, but it does issue Global Depository Receipts on the London Stock Exchange. Finally, Level 3 assets primarily consist of preferred stocks like ByteDance, the Chinese technology company that developed TikTok. The breakdown below has mostly stayed the same since year-end (60.6%, 12.6%, 26.8%). The higher common stock allocation (64.7% vs. 60.6%) reflects how well technology stocks have performed this year, while the lower preferred stock allocation is likely the result of higher interest rates.
Performance Analysis
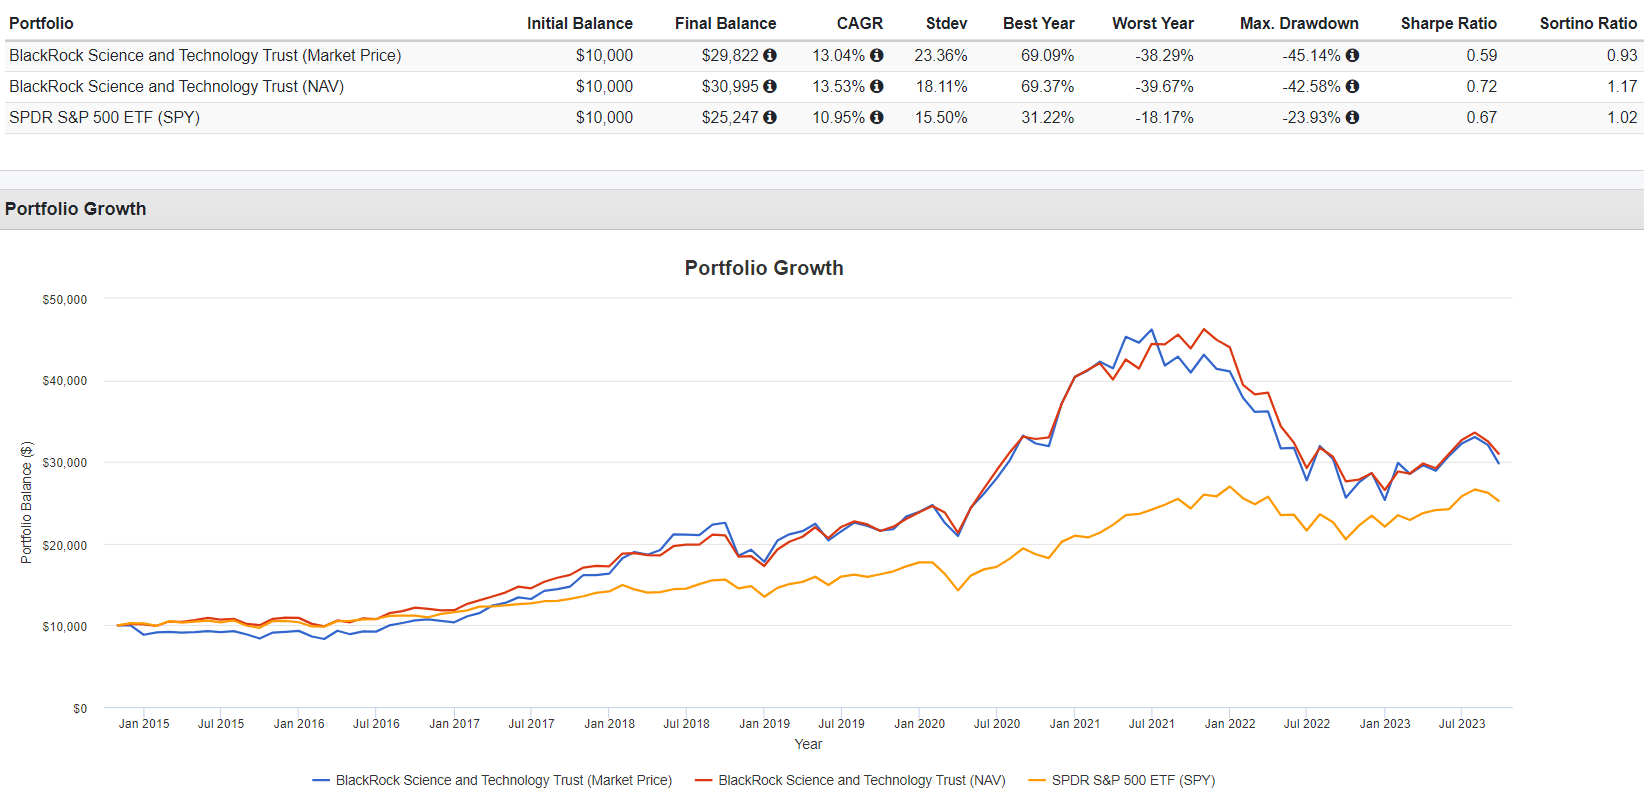
The following table highlights BST's performance since its October 2014 launch compared with the SPDR S&P 500 ETF ( SPY ). Of course, SPY isn't the most appropriate benchmark, but I want to show how it's been a solid fund to own over the last decade despite its high expense ratio.
As shown, BST delivered an annualized 13.04% return, primarily due to a substantial 69.09% gain in 2020 as technology stocks roared. SPY had a 10.95% annualized return over this period with a much tighter range of annual returns. It gained 31.22% in 2022 but outperformed BST by 20% in 2022. At the risk of stating the obvious, CEF investors should be prepared for higher volatility. However, BST's underlying portfolio was also more volatile, as indicated by the NAV portfolio's 18.11% annualized standard deviation vs. 15.50% for SPY. For those familiar with Portfolio Visualizer, you can sandwich most CEF tickers' between two "X"s to grab the NAV results (e.g., XBSTX). Here is a link to the graph above.
According to CEF Connect, BST trades at a 1.67% discount to NAV, with a 52-week range between -6.13% and +6.81%. I used Portfolio Visualizer's results to derive historical figures and calculated an average 5.73% discount between November 2014 and September 2023, so by this measure, it might be wise to wait for a deeper discount. As shown below, the discount reached about 15% in February 2016 but turned to a 12% premium around May 2021.
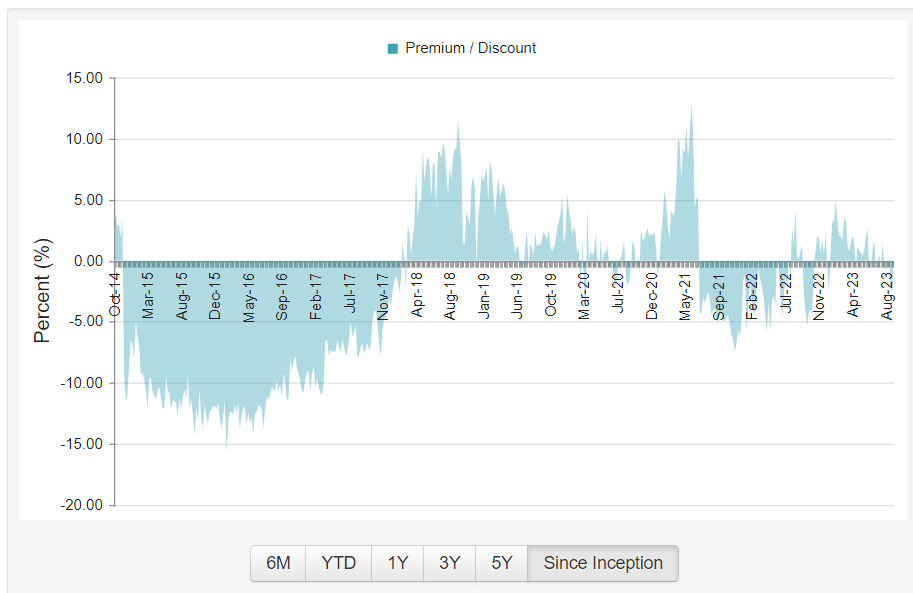
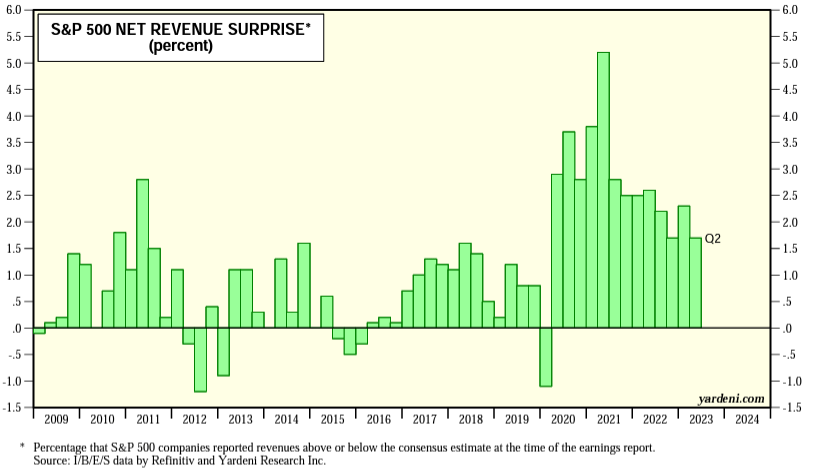
These fluctuations are normal for BST because it's a closed-end fund. CEFs issue a fixed number of shares to raise capital instead of an ETF's open-ended structure that allows for shares to be created or removed from the marketplace as needed at or near NAV. Various factors are responsible for these premiums or discounts, including changes in market sentiment. Part of the reason for BST's substantial discount from 2015-2017 was likely poor sales surprises, which were negative or in the low-single-digits in those years. Conversely, sales surprises were well above historical norms in 2020-2021, when BST traded at a premium. The trend is downward again today, which helps to explain BST's poor recent results, but as I'll show later, most large-cap tech stocks are still in reasonably good shape.
We should consider these market sentiment indicators when evaluating BST and other CEFs. Unfortunately, most analysis centers on past performance and an unwarranted belief that BST's managers will eventually "turn it around." The fact is there are macro-level factors at play beyond the fund manager's control, so let's fill that void next by looking at several of BST's fundamental and technical metrics.
BST Analysis
Common Stocks: 83.1% (78.76% Public, 4.35% Private)
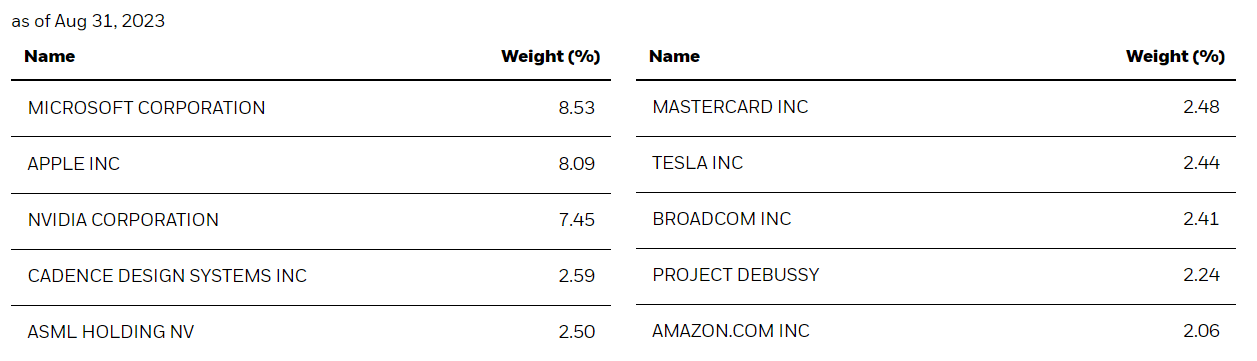
CEFs are not required to disclose daily holdings, a transparency issue that makes it difficult to analyze accurately. Still, let's give it our best shot by starting with the top ten holdings as of August 31, 2023, which totaled 40.79% of the portfolio. Most are recognizable common stocks, but Project Debussy is the project name for BST's position in Databricks, a privately held American-based enterprise software company. The 2.24% allocation below is 15% in common stock and 85% in preferred securities. You can find more information on other projects in the latest fund commentary for the BlackRock Science and Technology Term Trust ( BSTZ ).
Microsoft ( MSFT ), Apple ( AAPL ), and NVIDIA ( NVDA ) are BST's top three holdings, totaling 24.07% of the portfolio. These stocks are up at least 63.86% YTD on a weighted average basis, assuming share allocations remained constant. Since BST has only gained 17.65%, we know there's more going on, so an analysis of the fund's top holdings is insufficient. Therefore, let's look at the assets listed on Page 108 of the latest semi-annual report to fill in the remaining 59.21% of the fund. I've adjusted the weights accordingly to compile a reasonable estimate of the fund's current holdings. Let's start with the 83.11% allocated to common stocks.
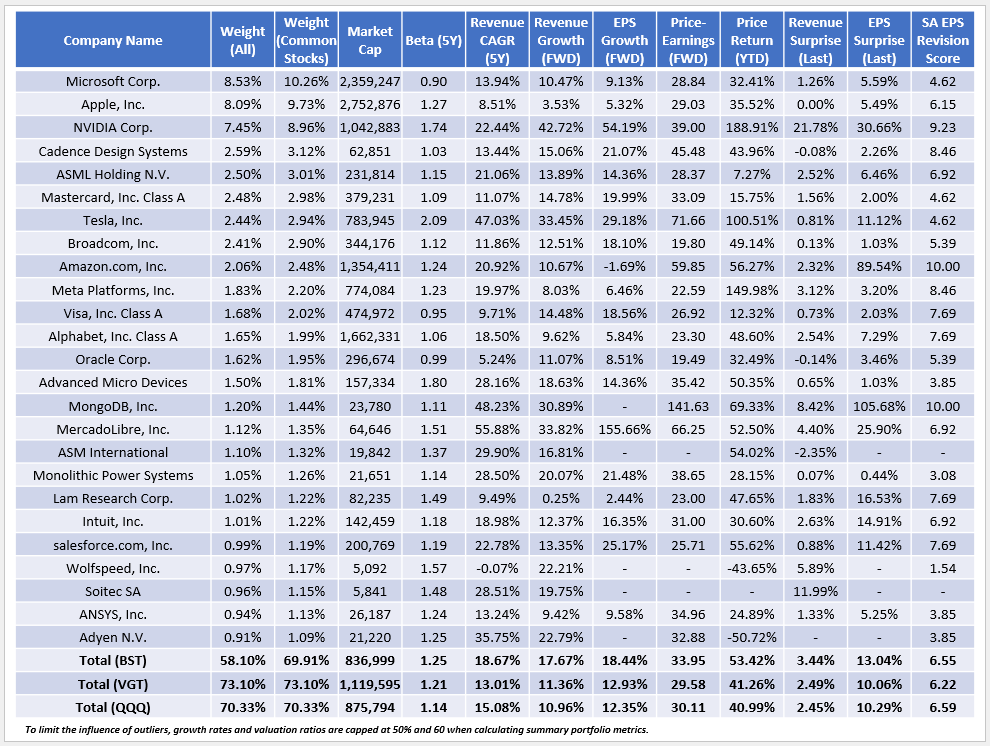
The table above highlights selected fundamental metrics for BST's top 25 common stock holdings, totaling 58.10% of the entire portfolio or 69.91% of the common stock portfolio. This level of diversification is similar to what the Vanguard Information Technology ETF ( VGT ) and the Invesco QQQ ETF ( QQQ ) offer at 73.10% and 70.33%. There is also a similar weight overlap with BST (56.14% and 56.68%), so they're reasonable low-cost alternatives. I want to make a few additional observations:
1. BST is the more volatile fund, as indicated by its 1.25 five-year beta for the common stock portion of the portfolio. It also has a higher growth profile, featuring 17-19% estimated sales and earnings per share growth rates compared to 10-13% for VGT and QQQ. The downside is that BST's common stock portfolio trades at 33.95x forward earnings, or 3.5-4 points more than VGT and QQQ. However, this higher growth potential is unsurprising, given how the goal to invest in companies with "rapid and sustainable growth potential" is clearly stated on the fund page. I'm merely highlighting the degree for the benefit of conservative investors who may not be comfortable with a highly volatile fund. After all, compared to 25 other U.S. Equity ETFs with Technology sector exposure above 70%, the common stock portion of BST's portfolio is the fifth-most expensive.
2. BST's holdings delivered a 53.82% YTD price gain compared to 41.26% and 40.99% for VGT and QQQ. Even after adjusting weights to approximate starting-year allocations, BST's constituents still delivered a 34.87% YTD gain, so it's evident the common stock portfolio is not the reason for the mediocre returns. Any analysis that starts and stops with an analysis of Microsoft, Apple, and Nvidia is insufficient.
3. BST's common stock portfolio has excellent earnings momentum, measured by its 3.44% and 13.04% weighted average sales and earnings surprise figures. In addition, the portfolio has a 6.44/10 EPS Revision Score, indicating Wall Street analysts are bullish on its holdings. QQQ's score is slightly better at 6.59/10, and if income is not a primary objective, it also makes sense to consider this ETF.
While publicly traded stocks performed well, I can't say the same for BST's private holdings. I've listed all 14 below, with a combined acquired cost of $86.8 million but only a combined value of $51.9 million as of June 30, 2023.
- Teya Services: $25.0M Cost / $8.5M Value / $16.5M Loss
- Grammarly: $18.7M Cost / $12.3M Value / $6.4M Loss
- Automattic: $8.0M Cost / 4.6M Value / $3.4M Loss
- Klarna Holdings: $8.0M Cost / $5.8M Value / $2.2M Loss
- AceVector: 2.0M Cost / 0.1M Value / $1.9M Loss
- Patreon: $3.4M Cost / $1.6M Value / $1.8M Loss
- TRAX: $6.0M Cost / $4.3M Value / $1.7M Loss
- Snyk: $5.2M Cost / $4.2m Value / $1.0M Loss
- Ant Group: $6.5M Cost / $5.6M Value / $0.9M Loss
- Think & Learn: $1.5M Cost / $0.7M Value / $0.8M Loss
- DataRobot: $0.6M Cost / $0.2M Value / $0.4M Loss
- Snorkel AI $1.0M Cost / $0.7M Value / $0.3M Loss
- Databricks: $1.0M Cost / $3.3M Value / $2.3M Gain
One theory for poor private equity results comes from Andrew Akers, senior quantitative research analyst at PitchBook. Akers offers the following :
Recent markdowns are primarily a function of playing catch up with the reality that valuations have shifted lower from where they were in 2021. This process tends to take a while to play out as PE managers typically anchor to their perceived intrinsic valuations of portfolio companies.
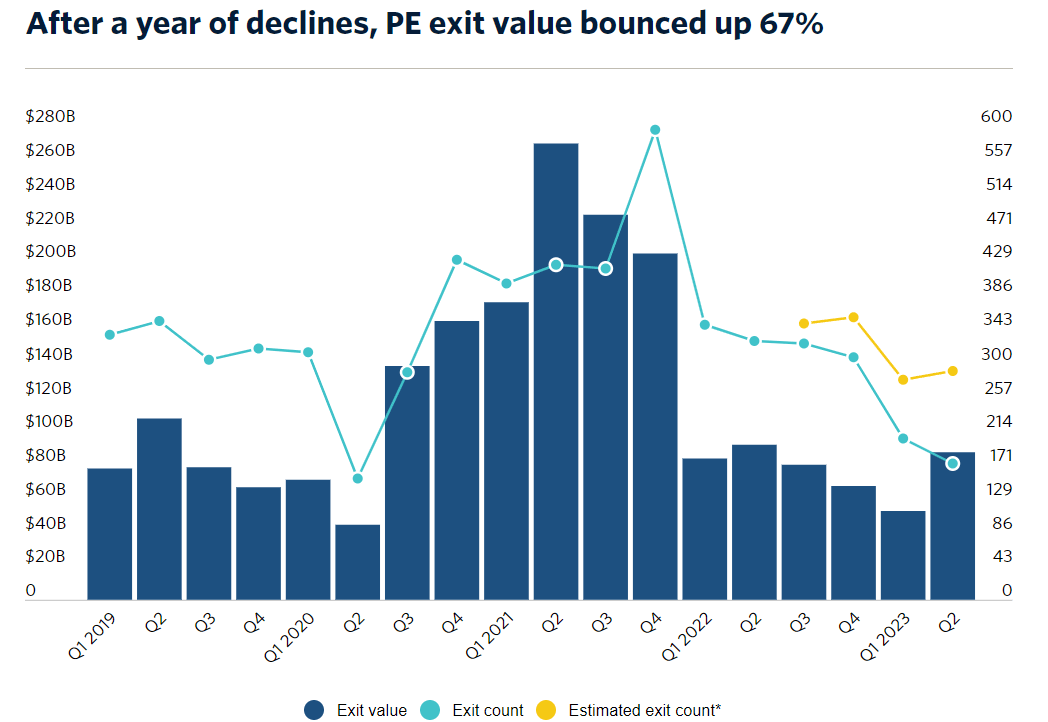
In other words, those substantial gains from 2020 may not have been entirely valid. According to researchers at PitchBook , private equity managers are "plagued with higher financing costs, limited access to credit and a slow IPO market." However, the outlook may be favorable. PitchBook reports exit values jumped 67% to $87.3 billion in Q2 2023, reversing a four-quarter slide.
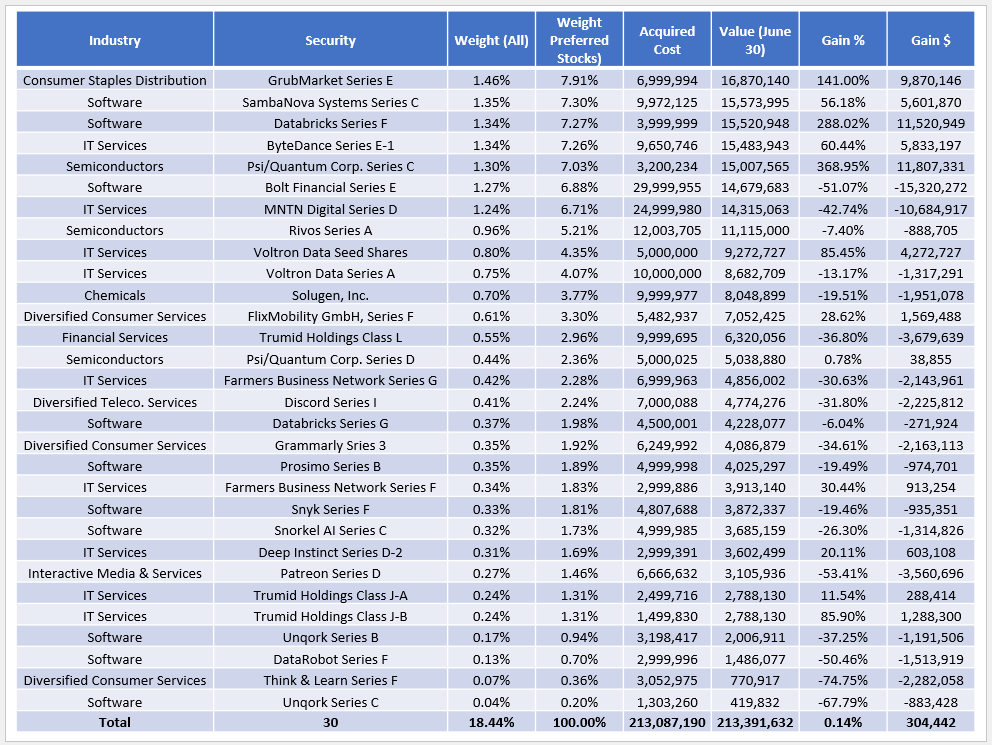
Preferred Securities: 18.4%
BST has a substantial amount invested in preferred securities. Known as fixed-income securities with equity-like characteristics, BST listed 30 holdings in its latest semi-annual report, as follows:
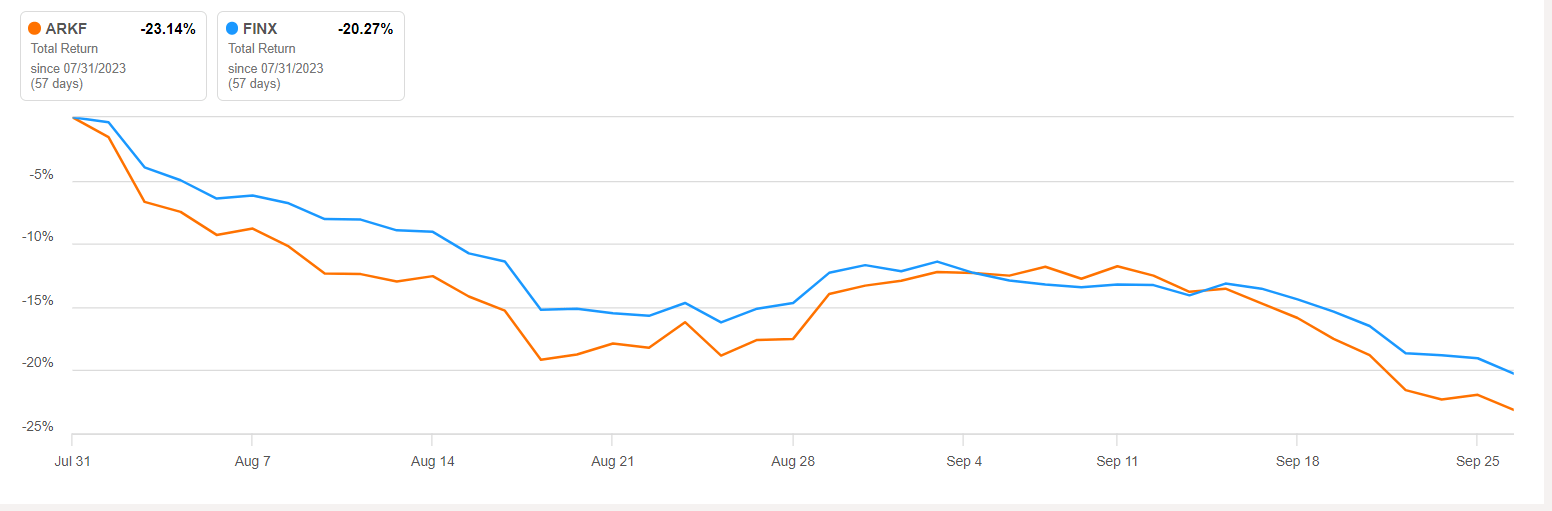
Preferred stocks are valued like bonds; thus, rising interest rates negatively impact values. The S&P U.S. Preferred Stock Index ( SPPREF ) is slightly underwater YTD, and BST's selections have barely netted a profit. In particular, Bolt Financial, an asset down 51% through June 30, was mentioned in the manager commentary section of the latest semi-annual report, noting how the "financial company's valuation fell along with its publicly traded fintech peers and weak demand in the industry." As reference points, the ARK Fintech Innovation ETF ( ARKF ) declined by 65.07% in 2022 but has rebounded by 30.34% in 2023. Meanwhile, the market-cap-weighted Global X Fintech Thematic ETF ( FINX ) lost 30.34% in 2022 and is up a modest 2.63% YTD. In August and September 2023, both ETFs suffered substantial 20%+ declines, so BST's losses could be even more significant today.
Covered Call Options: -1.60%
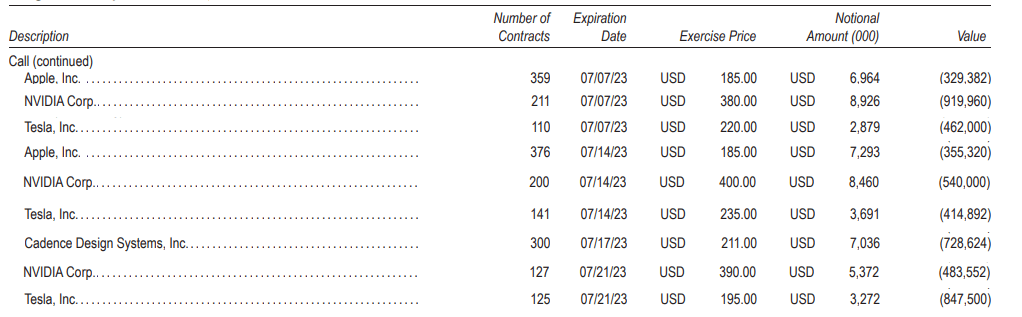
BST mainly writes single stock covered call options to generate additional income and support the distribution and occasionally writes single stock put options. As of June 30, 2023, total options written at value were $19,101,911, with $12,549,700 in premiums received. At the time, most options were in-the-money, giving the buyer the right but not the obligation to purchase stock at a favorable price. I've listed some of the most prominent positions below as of June 30, 2023, totaling $5,081,230, and as you can see, managers predominantly write call options on Apple, Nvidia, and Tesla.
I couldn't determine the premiums received for each option, but given how the total premiums were about $6.5M less than the total option value, it's safe to assume most were net losses. However, these company's share prices have declined since June, so the strategy should provide shareholders with some downside protection.
Distribution Analysis
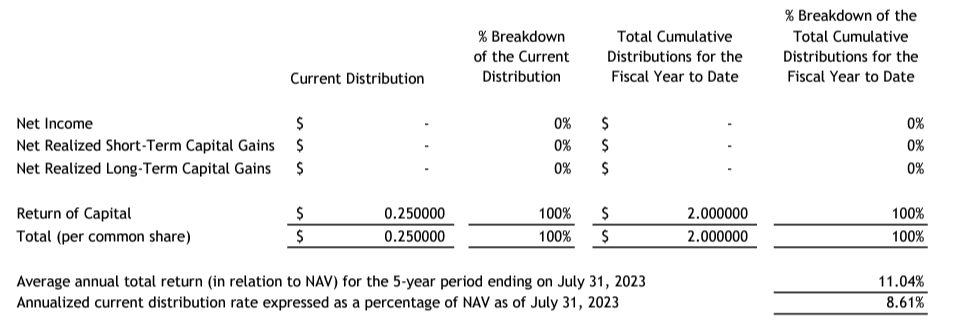
BST's trailing distribution yield is 9.80% based on an annual $3.00 per share payout, or $0.25 per month. However, it's crucial readers know that BST's distribution is managed and can include investment income, realized capital gains, and return of capital. Per the latest tax notice, all distributions this calendar year were classified as return of capital, indicating that the fund distributed more than its income and realized capital gains. These are estimates, with official numbers not provided until year-end.
I refer to the 9.80% figure as a distribution yield and not a dividend yield, as the latter implies an earned payment, and I don't want to give readers the impression that BST holds high-yielding tech stocks. Consider that the forward dividend yield on its common-stock portfolio is just 0.44%, not even enough to cover the management fee. However, BST earns additional income by selling assets for a capital gain, the fixed income payments from its preferred securities, and the premiums received for writing call options.
A return of capital is not necessarily bad, as the distribution is not taxed as income. Still, the $30.80 current price is half what it was in February 2021, so it's clear the distribution has been "forced" and not well-supported by a strong portfolio. Also, consider how the last nine distributions of 2022 included a return of capital totaling $0.848 per share, or 28.2% of that year's $3.00 per share distribution, per BST's Form 8937 . The per share reduction increased from $0.0449 to $0.1004 in May 2022 and remained that way for the rest of the year. On that note, the reported 100% return of capital distributions this year are just estimates and will likely change at year-end. This occurred in 2022 when the monthly tax notices sent from January to October indicated no portion of the $2.50 YTD distribution was classified as a return of capital, but the actual amount was $0.65 per share.
Investment Recommendation
One question you might have is whether BST's 9.80% yield is safe. The better question is whether it should be safe, which is an easy "no" for me. BlackRock will manage the distribution as they see fit, but it's evident BST has been hurt by a weak private equity market and rising interest rates so much that it's overshadowed the excellent returns from its publicly traded common stock holdings. The main risk is if tech stocks decline and high interest rates remain, further shaking confidence in the private equity market and ultimately leaving few segments of BST's portfolio safe. That scenario seems plausible, especially after the Fed signaled more pain is needed , and the S&P 500 has declined in six of the past eight weeks.
No matter what happens next, discussing BST's top ten holdings is insufficient, as they're not the issue. Most are high-quality growth companies with solid earnings momentum, and the most significant risk is a potentially elevated valuation. Instead, it's the other, more difficult-to-value portion of the fund that I'm uncomfortable with, and why I've assigned a "sell" rating to BST. Even if you disagree, I hope the information I presented gives you a new perspective on the fund, and as always, I look forward to continuing the discussion in the comments section below. Thank you for reading.
For further details see:
BST: Private Equity, High Interest Rates Haunt This 9.80% Yielding Science And Technology CEF