FITBO - BTO: Premium Looks Unjustified As Declining NAV Poses Risks To Distribution
2023-10-09 10:37:22 ET
Summary
- The John Hancock Financial Opportunities Fund invests primarily in financial services companies and has a current yield of 10.14%.
- The fund has underperformed the S&P 500 Index and other financial ETFs, with shares down 24.40% year-to-date.
- The fund's performance has been impacted by the struggles in the banking sector, particularly regional banks, due to rising interest rates.
- The fund has failed to cover its distribution over the past eighteen months, and its net asset value has been declining rapidly.
- The fund is trading at a premium to NAV, which appears unjustified considering that the distribution appears challenged.
The John Hancock Financial Opportunities Fund ( BTO ) is a closed-end fund that invests primarily in financial services companies such as banks, asset managers, and insurance companies. This is a sector of the economy that has been adversely affected by the rapid rise in interest rates over the past year or so, mostly because it caused many of these companies to suffer unrealized losses on their portfolios. This is something that may cause a certain amount of concern for risk-averse income-focused investors, and rightly so, since we are concerned about ensuring that our capital is not exposed to undo risk. However, many financial services companies are immensely profitable and the fund itself reflects this with a 10.14% current yield. This is a sufficiently high yield that a certain amount of risk might be justified. As such, we should investigate this fund further.
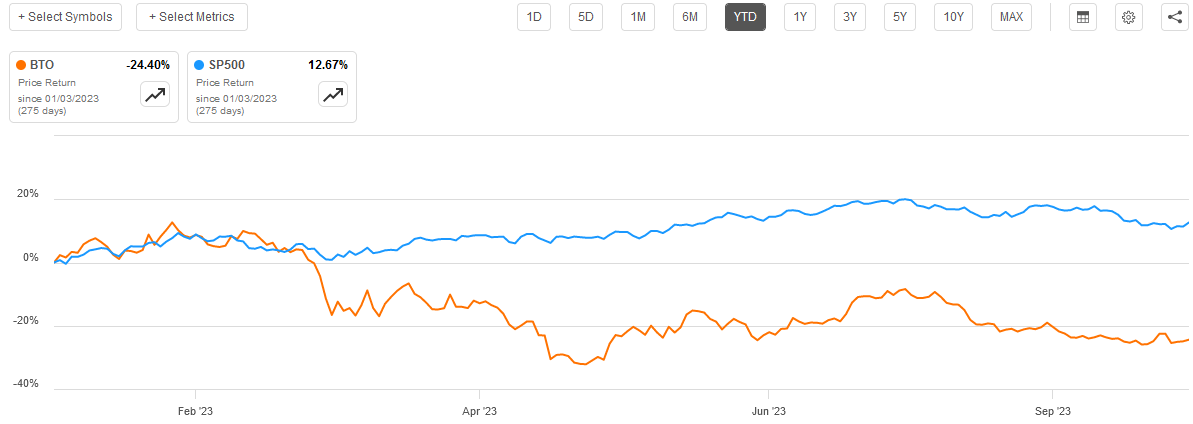
As might be expected given the financial problems that the banking sector experienced earlier this year, the John Hancock Financial Opportunities Fund has delivered a very disappointing performance year-to-date. As we can see here, the fund’s shares are down 24.40% since January 1, 2023, substantially underperforming the S&P 500 Index ( SP500 ):
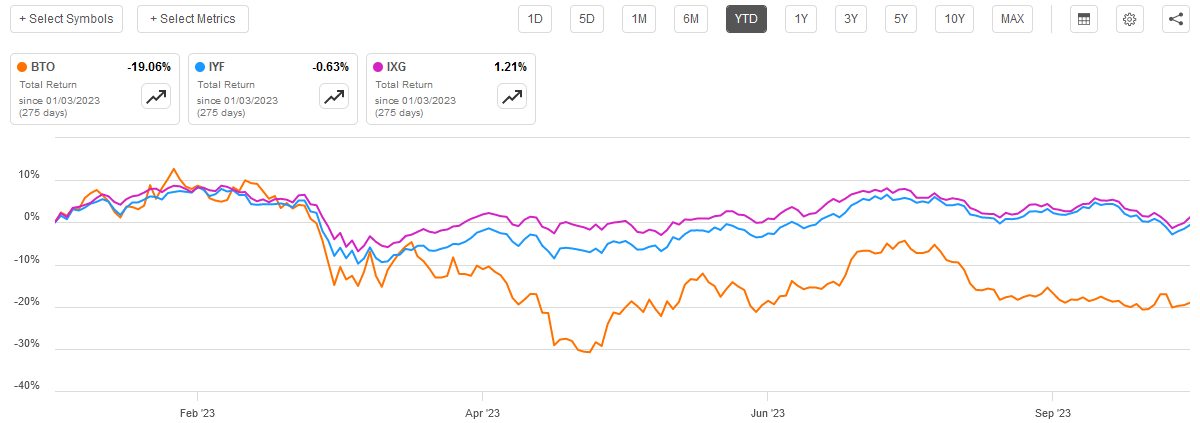
Perhaps the most disappointing thing here is that the John Hancock Financial Opportunities Fund underperformed both the iShares U.S. Financials ETF ( IYF ) and the iShares Global Financials ETF ( IXG ) over the same period. This is true even when we consider the positive impact of the John Hancock Fund’s substantially higher yield:
This certainly does not speak highly of this fund since investors who purchased this fund back around the start of the year have lost a significant amount of money while investors in both the domestic and global financial index funds have pretty much broken even.
However, the fund’s past performance is not always the most important thing to consider when trying to decide on an investment course of action. The more important thing is where the fund will be in the future. Let us investigate this fund and attempt to determine that.
About The Fund
According to the fund’s website , the John Hancock Financial Opportunities Fund has the primary objective of providing its investors with capital appreciation and current income. This makes a great deal of sense when we consider that 93.09% of the fund’s assets are invested in common stock:
CEF Connect
As I have pointed out before, investors typically purchase common stocks in order to receive income in the form of dividends or distributions as well as benefit from the capital gains that accompany the growth and prosperity of the issuing company. Of these two goals, capital appreciation is much more important for most investors. After all, the S&P 500 Index ( SPY ) only has a 1.52% current yield as of the time of writing. The global financials index does somewhat better with a 3.13% current yield, but even this is much less than the yield that we could get just from putting our money into a money market fund. Thus, capital appreciation must be the primary reason that anyone purchases common stock as it is quite clear that nobody is buying solely for yield anymore.
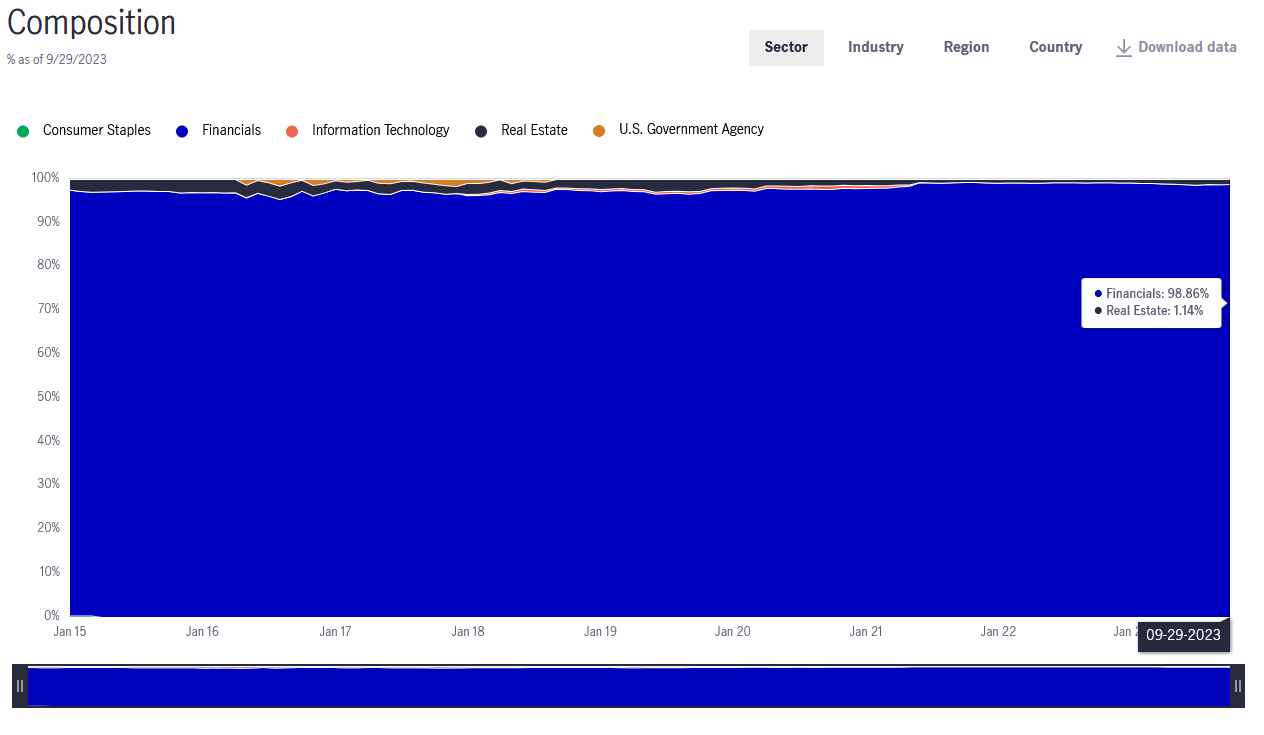
As the name of the fund implies, the John Hancock Financial Opportunities Fund aims to deliver its objectives by investing in common stocks (and to a lesser extent preferred stocks) issued by financial institutions and similar companies from all around the world. A look at its portfolio reveals that it is indeed complying with this objective. As we can see here, 98.86% of the fund’s assets are currently invested in securities issued by financial institutions:
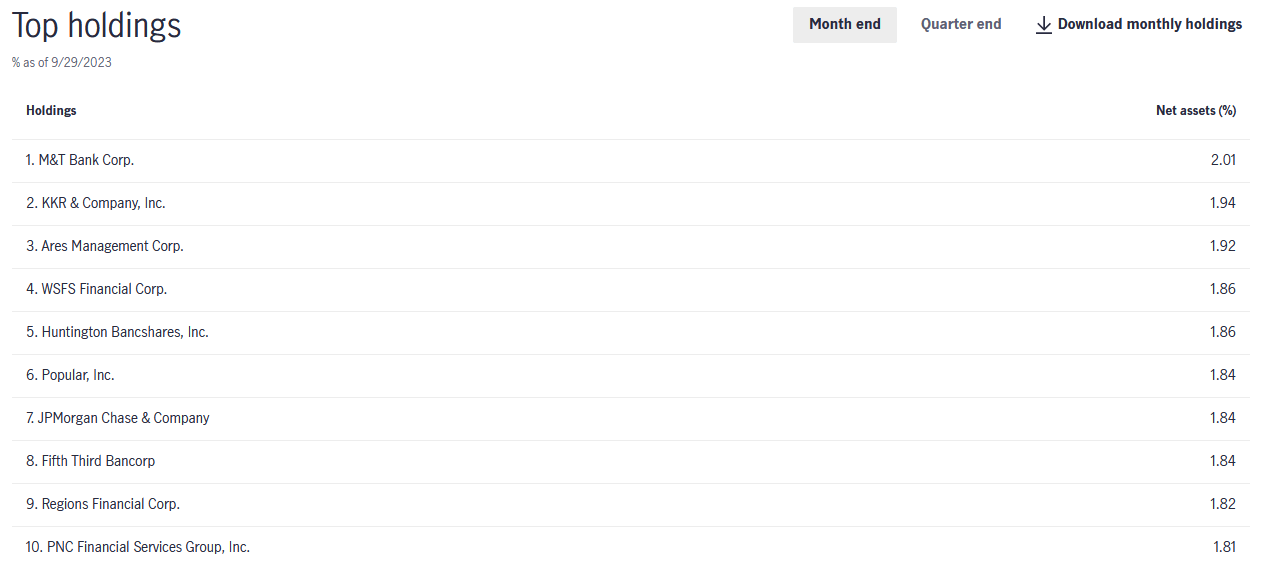
This does not necessarily mean that it is solely invested in bank stocks, however. In fact, a look at the largest positions in the portfolio reveals a number of non-bank entities:
We see both KKR & Company ( KKR ) and Ares Management Corporation ( ARES ) among the fund’s largest positions, neither of which are banks. These two companies are alternative asset managers, which means that they manage funds that invest in things other than ordinary stocks and bonds. In particular, KKR & Company earned something of a reputation back in the 1980s for conducting leveraged buyouts of various companies and it still does that today, although the fund has since expanded into other things. Many of KKR’s funds invest in private companies and other non-public securities. The same is true of Ares Management, although that company is best known for its alternative credit funds. These funds invest in debt securities that are not traditional fixed-rate bonds. In short, neither of these companies are exposed to the same risks as banks, since their business model primarily consists of collecting fees from the funds that they manage.
With that said though, we still see a number of things on the largest positions list that may cause risk-averse investors a certain amount of concern. In particular, there are a number of regional banks on the list including M&T Bank ( MTB ), WSFS Financial ( WSFS ), Huntington Bancshares ( HBAN ), Fifth Third Bancorp ( FITB ), Regions Financial ( RF ), and PNC Financial Services ( PNC ). That means that the majority of this fund’s top ten positions are regional banks. This could explain why the fund has delivered such a poor performance year-to-date.
As everyone reading this can likely recall, the banking crisis that occurred back in the Spring of this year was primarily centered around regional banks. Silicon Valley Bank, First Republic, and the other banks that failed or nearly failed were all regional banks. There was no great concern surrounding a large international bank like JPMorgan Chase ( JPM ) or Citigroup ( C ). That made this crisis somewhat different from the one that occurred back in 2007 and 2008, which affected the big banks much more than the regionals. The market reacted to this in a very big way, which we can see here:
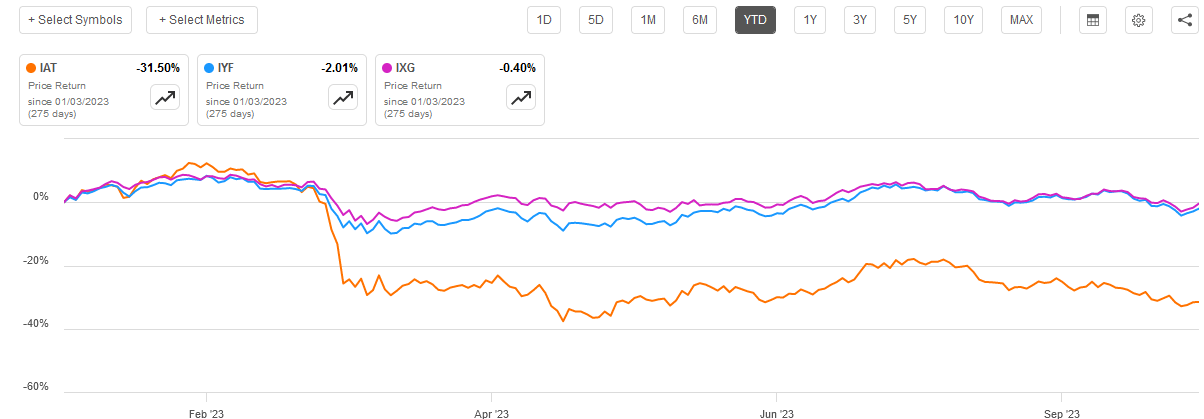
That chart shows the price performance of the iShares U.S. Regional Bank ETF ( IAT ) against both the domestic and global bank indices that were mentioned in the introduction. As we can clearly see, the U.S. Regional Bank ETF dropped by a lot back around the time that the Silicon Valley Bank crisis happened and has yet to recover. As the John Hancock Financial Opportunities Fund is heavily invested in U.S. regional banks, as opposed to the big banks, this explains why this fund dropped substantially right around the same time and has yet to recover.
Fortunately, we can see that the John Hancock Financial Opportunities Fund has a great deal of diversification. To paraphrase a discussion that I have had in numerous previous articles:
“I generally do not like to see any single asset in a closed-end fund account for more than 5% of the fund’s portfolio. This is because that is approximately the level at which the asset begins to expose the fund to idiosyncratic risk. Idiosyncratic, or company-specific, risk is that risk which any asset possesses that is independent of the market as a whole. In short, the concern is that some event could cause the price of a given asset to decline when the market does not. If that asset accounts for too much of the portfolio, then it could end up dragging the entire fund down with it in such an event.”
As we can see by looking at the largest positions in the fund, there is no single asset that accounts for more than 5% of the portfolio. As such, we probably do not need to worry about the risks of a given bank too much here. However, we do still need to worry about the systematic risk affecting the entire banking system.
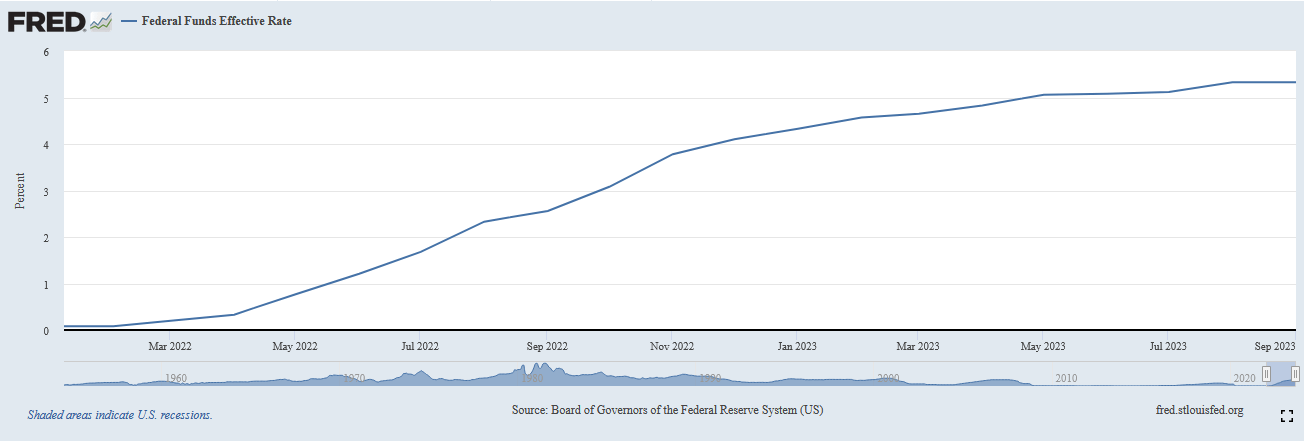
The biggest of these risks right now is the impact that rising interest rates have had on banks’ portfolios. As everyone reading this is certainly well aware, the basic business model of a bank is to use the money provided by its depositors to make loans. This caused a big problem because of how quickly interest rates went up over the past eighteen months. As we can see here, the effective federal funds rate was at 0.08% back at the start of January 2022. It is 5.33% today:
This is a 525-basis point increase in about a year and a half. That pushed down the market price of the assets that the banks purchased with all of the money that people deposited over the past several years. Silicon Valley Bank, for example, owned a substantial amount of ten-year U.S. Treasury securities that fell in price once interest rates started to decline. When depositors started withdrawing their money, the bank had to sell the Treasury securities at a loss to raise funds to satisfy the demand from its depositors, and ultimately the value of the securities had declined so much that they had an insufficient value to meet all the depositors’ withdrawal requests. The banking system does not have the problem that we saw back in 2007 where defaults are simply wiping out value. In this case, the “toxic securities” are U.S. Treasuries. The banking system is sitting on hundreds of billions of dollars in unrealized losses due to the decline in the value of U.S. Treasury securities, although it is difficult to know the exact amount. The FDIC states that it was $620 billion of unrealized losses back at the start of the year, while other sources put it at $1.7 trillion as of March 2023. It is likely that the unrealized losses are higher now considering that interest rates have risen since March. However, it is a fair conclusion that no bank right now could survive a bank run.
That is something that will undoubtedly be concerning to anyone who is considering investing in this fund. The Federal Reserve currently has the problem contained though, as it established a facility that allows banks to pledge their assets as collateral for loans. The banks are able to pledge the assets at face value though, not the current value. This appears to have stabilized the system, as banks can now obtain the money that they need to satisfy the requests from their depositors directly from the Federal Reserve. However, they are still encountering a problem in which depositors are withdrawing money to put it into higher-yielding options, such as money market funds. Regional banks are suffering this problem more acutely than the big international banks, so unfortunately this fund is exposed to that. The biggest problem with this is that declining deposits reduces the amount of money that the bank has available to lend so ultimately it reduces profit growth. This will almost certainly be a drag on the share price of these companies and have a negative impact on this fund’s performance going forward.
In short, it appears that the situation is somewhat contained, and we probably do not need to worry about bank failures and the losses that would accompany them. However, share price appreciation may be hard to come by as regional banks continue to suffer deposit outflows and money supply growth remains negligible. That will undoubtedly weigh on the performance of this fund, and it may remain range-bound for a while.
Leverage
As is the case with most closed-end funds, the John Hancock Financial Opportunities Fund employs leverage as a method of boosting the effective return of its portfolio. I explained how this works in various previous articles on other funds. To paraphrase myself:
In short, the fund borrows money and then uses that borrowed money to purchase securities issued by banks and other financial institutions. As long as the total return that the fund receives from the purchased assets is higher than the interest rate that it has to pay on the borrowed money, the strategy works pretty well to boost the effective total return of the portfolio. This fund is capable of borrowing money at institutional rates, which are considerably lower than retail rates. As such, this will usually be the case.
However, the use of debt in this fashion is a double-edged sword. This is because leverage boosts both gains and losses. As such, we want to ensure that the fund is not employing too much debt, as that would expose us to an unacceptable amount of risk. I generally do not like a fund’s leverage to exceed a third as a percentage of its assets for this reason.
As of today, the John Hancock Financial Opportunities Fund has leveraged assets comprising 20.79% of its portfolio. This is a fairly low leverage ratio compared to many other closed-end funds, but that is a good thing right now considering the risks that still overhang the financial system. Overall, the balance between risk and reward should be acceptable here and we probably do not have to worry too much about the fund’s use of leverage.
Distribution Analysis
As mentioned earlier in this article, the primary objectives of the John Hancock Financial Opportunities Fund are to provide its investors with capital appreciation and current income. The financial sector in general does have higher yields than most other market segments, but it is still not likely that the fund can rely solely on dividends alone to provide a high level of income. However, it can also obtain money by realizing capital gains and paying those out to its investors. Indeed, the modus operandi for most closed-end funds is to maintain a relatively stable net asset value and pay out all of the investment gains to the shareholders. When we consider that the market appreciates by about 9% to 11% on average in a given year, we can see how this would normally allow the fund to boast a fairly high distribution yield.
This is indeed the case as the John Hancock Financial Opportunities Fund pays a quarterly distribution of $0.65 per share ($2.60 per share annually), which gives it a 10.14% yield at the current price. Unfortunately, the fund has not been particularly consistent with respect to its distribution over the years, but its recent history has been good:
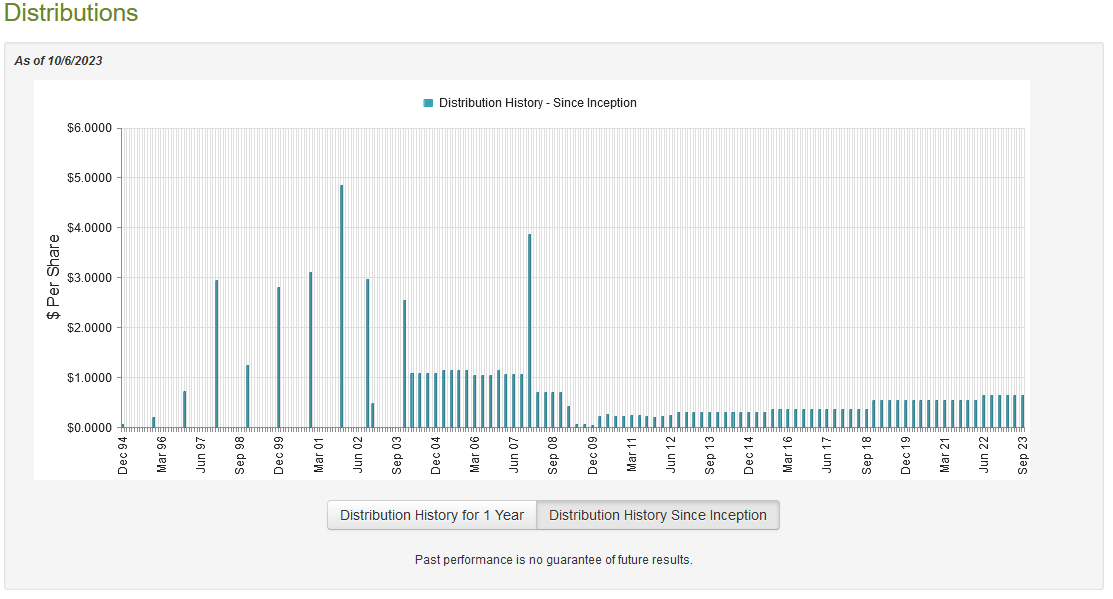
As we can see, the fund’s distribution has varied quite a bit over the years, although it has generally been increasing since the financial crisis fifteen years ago. For the most part, this distribution history might appeal to anyone who is seeking a safe and secure source of income to use to pay their bills or finance their lifestyles. However, the fact that this fund only pays its distribution quarterly, as opposed to monthly, might reduce its appeal somewhat. It certainly slows down the rate of compounding for those investors who are actively trying to build their wealth, which is unfortunate. However, a quarterly distribution can still be acceptable for people trying to live off the income generated by their portfolios, it simply requires a bit more discipline.
As is always the case, we want to ensure that the fund can actually sustain the distribution that it pays out. After all, we do not want to be the victims of a distribution cut, since that would reduce our incomes and probably cause the fund’s share price to decline more than it already has.
Fortunately, we do have a very recent document that we can consult for the purpose of our analysis. The fund’s most recent financial report corresponds to the six-month period that ended on June 30, 2023. This is nice because it would include the period of time in which the regional bank crisis occurred, which was the worst crisis experienced by the financial system since the collapse of Lehman Brothers. This is also the period of time in which the stock prices of many regional banks collapsed, which undoubtedly had a sharply negative impact on the fund’s net asset value. The way in which the fund handled this situation has a significant impact on its ability to maintain its distribution going forward, so this is something that we want to pay close attention to.
During the six-month period, the John Hancock Financial Opportunities Fund received $11,913,157 in dividends and $348,668 in interest from the assets in its portfolio. When we subtract the foreign withholding taxes that the fund had to pay, we get a total investment income of $12,181,801 during the period. The fund paid its expenses out of this amount, which left it with $4,480,160 available for shareholders. As might be expected, this was nowhere near enough to cover the $25,238,052 that the fund paid out in distributions during the period. At first glance, this is almost certainly going to be concerning as the fund’s net investment income was nowhere close to enough to cover the distributions that it paid out.
Fortunately, the fund does have other methods through which it can obtain the money that it needs to cover the distribution. As already mentioned, it might have been able to achieve capital gains that could be paid out to the shareholders. These are not included in net investment income but obviously still represent money coming into the fund. As might be expected due to the regional banking crisis that occurred during the period, the fund failed miserably at this task. It did manage to achieve net realized gains of $14,310,704 but these were more than offset by $156,720,558 in net unrealized losses. Overall, the fund’s net assets declined by $153,501,167 during the six-month period after accounting for all inflows and outflows. This is quite concerning as the fund clearly failed to cover its distribution. In fact, the net investment income plus the net realized gains were insufficient to cover the money that the fund paid out. The same thing happened over the course of 2022, so the fund has now experienced eighteen months of declining net asset value and insufficient investment profits to cover the distributions. This is not sustainable and as such there is a real risk that it may be forced to reduce the payout if things do not improve in the near future. There is, unfortunately, no real catalyst to suggest that improved performance could be on the horizon so we may have to face up to the possibility of a distribution cut.
Valuation
As of October 5, 2023 (the most recent date for which data is available as of the time of writing), the John Hancock Financial Opportunities Fund has a net asset value of $24.17 per share but the shares currently trade for $25.63 each. This gives the fund’s shares a 6.04% premium on the net asset value at the current price. This is a very high price to pay for the fund, especially considering that the distribution appears to be challenged. The current price is better than the 7.05% premium that the shares have had on average over the past month, but the fund still looks overpriced right now.
Conclusion
In conclusion, the John Hancock Financial Opportunities Fund invests in a portfolio of banks and other financial institutions with the goal of providing its shareholders with a high level of current income and capital appreciation. Unfortunately, it has struggled to achieve this goal over the past eighteen months due to the struggles facing the banking sector as rapidly rising interest rates are crushing bank stocks. The fund may not be exclusively invested in banks, but the banking sector has enough presence in the fund for this to matter. The fund is currently trading at a premium, and it appears to be unjustified based on the fund’s financial performance. Overall, it might be best to stay away from this fund for now.
For further details see:
BTO: Premium Looks Unjustified As Declining NAV Poses Risks To Distribution