TJX - Burlington Stores: Aiming To Close The Quality Gap With Its Peers
2023-11-03 02:44:58 ET
Summary
- Burlington is an off-price department store retailer. The company offers a wide variety of products, including clothing, shoes, and more, all at discounted prices.
- There is a change in consumer behavior towards purchasing pre-owned items and companies like Burlington could take advantage of this trend.
- Since FY2020, the company has discussed a strategic plan to maximize its existing potential, given its status as the smallest and least profitable competitor.
- I believe the company is at an inflection point, poised to take a significant step forward and establish itself as a strong competitor.
Investment Thesis
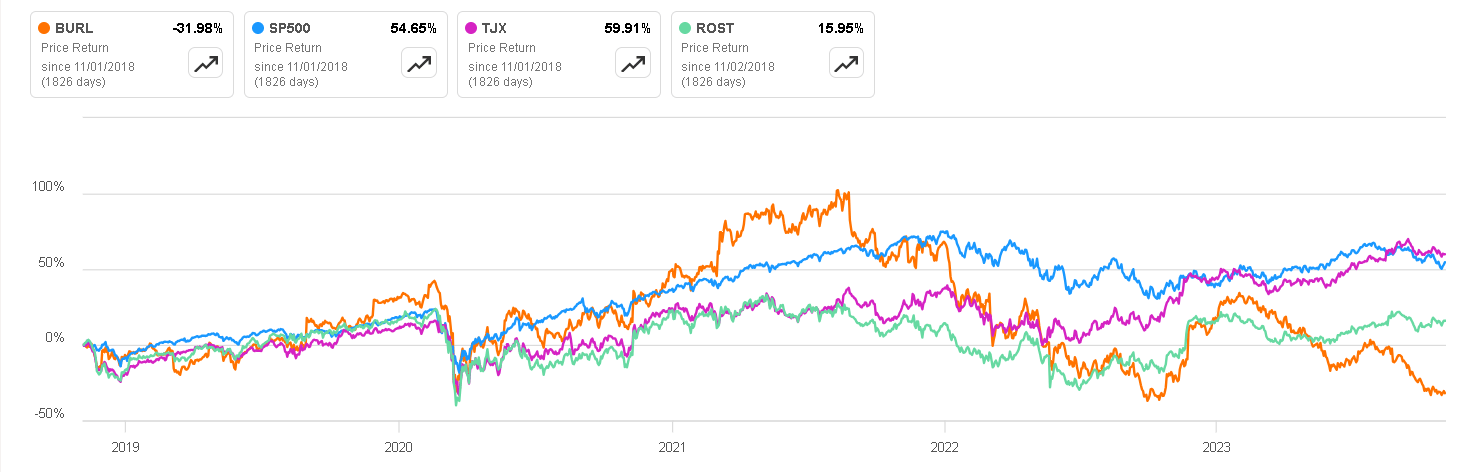
Burlington ( BURL ) operates in a sector known for its resilience during economic downturns, making it an attractive option for portfolio diversification. However, when examining its performance over the last five years, it's not immediately apparent that Burlington is the strongest contender in the sector.
Recognizing this, management has initiated a strategic plan to close the quality gap that has emerged between Burlington and its larger competitors. In this article, we will delve into the favorable aspects of this business model, quantitatively compare Burlington to its peers, and present a valuation analysis to support the case for considering it as a potential investment opportunity.
Business Overview
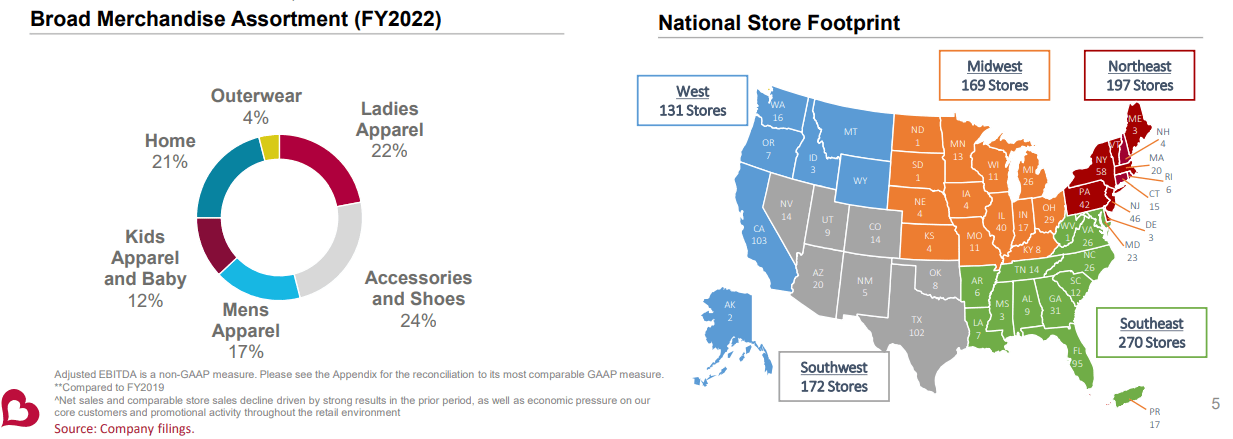
Burlington is an off-price department store retailer. The company offers a wide variety of products, including clothing, shoes, accessories, home goods, and more, all at discounted prices. Burlington is renowned for its dedication to providing value to customers by offering brand-name and designer merchandise at prices lower than those in traditional department stores.
It operates numerous stores across the United States and Puerto Rico, making it a popular destination for bargain shoppers seeking quality products at affordable prices. These prices are made possible by taking advantage of canceled orders or situations where companies overproduce and need to clear excess inventory. For example, if Tommy Hilfiger manufactures jackets for the winter season and still has a substantial inventory at the season's end, they may opt to wholesale the excess inventory to off-price stores to avoid a complete loss of value.
Companies like Burlington typically seek the best discounts to maximize profitability, and their substantial scale allows them to secure favorable deals.
Second-Hand Buying Trend
There is a notable shift towards purchasing pre-owned items, especially among younger generations. A study conducted by ThredUp points out that 62% of Gen Z and Millennial consumers (aged 10-30) indicated a preference for shopping for second-hand goods over considering new ones.
One of the main reasons for this shift is the mounting pressure of inflation and increasing prices. Consequently, in an economic downturn, off-price stores could see significant advantages. Consumers have recently observed higher prices for essentials like groceries, gasoline, dining out, household expenses, and clothing, with almost half (44%) of all consumers stating that they are cutting back on clothing expenses. This percentage is higher than in any other category, except for dining out.
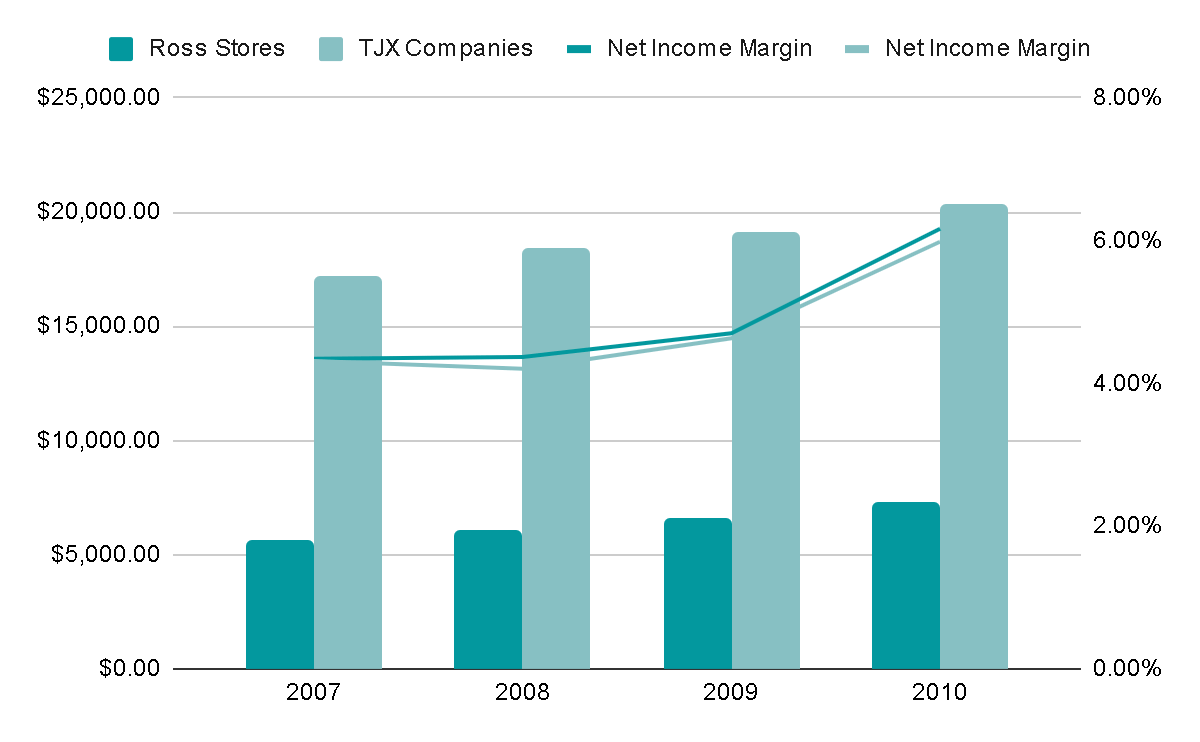
Used items are increasingly viewed as a means for individuals to stretch their paycheck , especially in the face of high inflation or economic crises that diminish consumer confidence. A case in point is off-price stores' financial performance during the 2008-2009 recession, one of the most severe economic downturns in U.S. history.
Throughout 2009, the worst phase of the recession , both TJX Companies and Ross Stores' revenues (two off-price companies) continued to grow , and their profit margins remained strong. So, we could say that Burlington not only operates in a sector that tends to withstand economic crises well, but there's also a trend towards consuming second-hand clothes.
The worldwide secondhand market is projected to expand at a 15% compound annual growth rate , potentially reaching an estimated $275 billion by 2032. Burlington operations are limited to the United States, but the global growth trend in this market is evident.
This growth seems sustainable , reflecting a broader change in consumer behavior towards more environmentally conscious and sustainable consumption habits. This shift is especially relevant in the context of the textile industry and the significant environmental impact associated with fast fashion, which includes the consumption of millions of liters of water, the disposal of tons of waste into the sea, and the generation of substantial carbon emissions.
Statista
Competitors
Burlington has two clear competitors: TJX Companies (NYSE: TJX ), which owns T.J. Maxx, Marshalls, and HomeGoods, and Ross Stores (NASDAQ: ROST ), owner of Ross Dress for Less and dd's Discounts. We can compare the numbers for each to gain some context for Burlington's performance relative to its competitors, at least numerically.
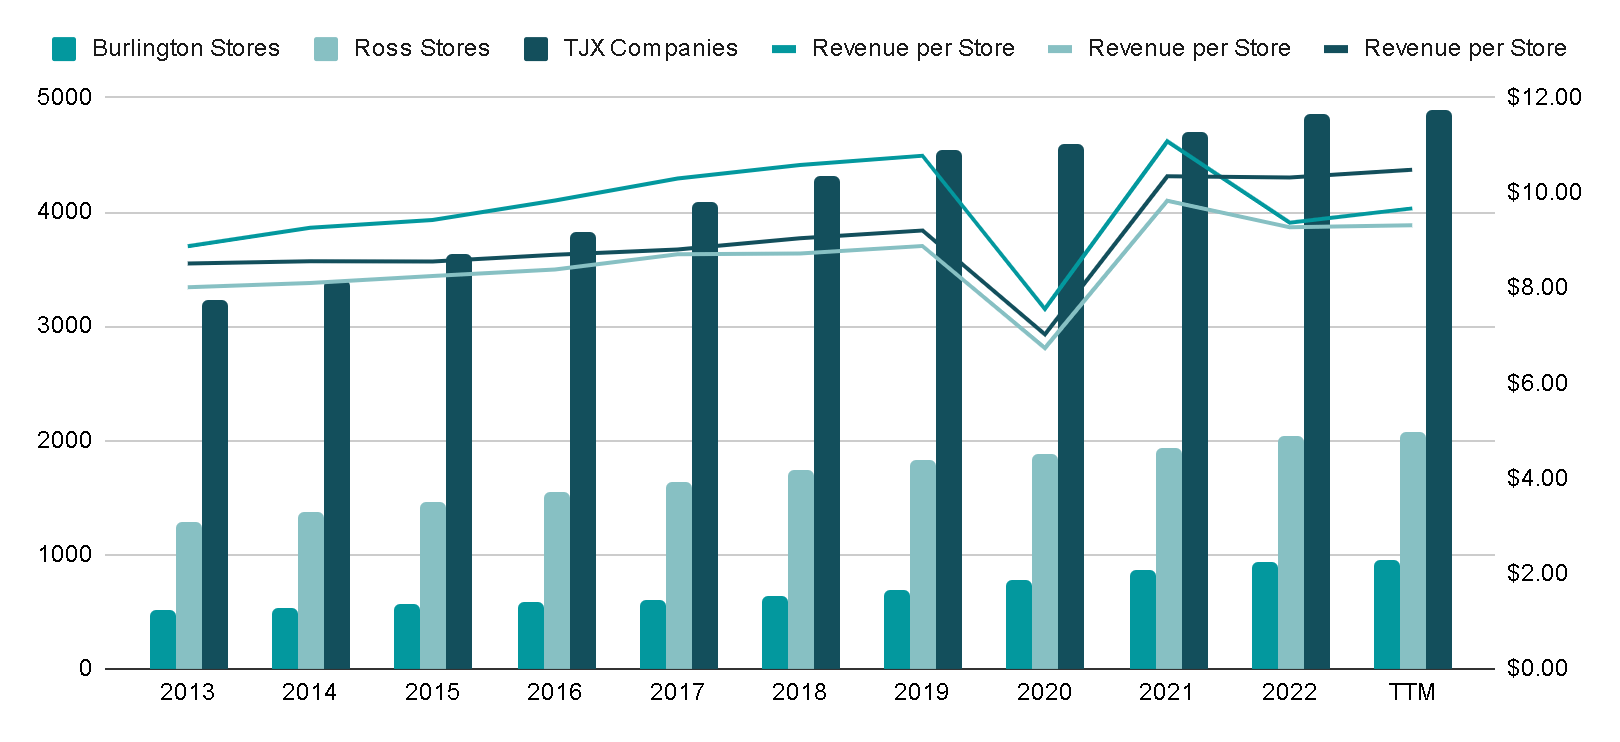
The competitor with the largest scale is TJ Companies , and this is bolstered by its global presence. However, if we only consider stores within the US, it remains the largest with 3,411 stores, encompassing TJ Maxx, Marshalls, and HomeGoods.
Conversely, Burlington has the smallest scale and the biggest room to grow , currently operating only 939 stores. However, this also means that it boasts the fastest store growth rate. Specifically, it has expanded by 7% annually over the last decade, surpassing ROST, which grew at a rate of 5.2% annually, and TJX, which achieved a growth rate of 4.6%
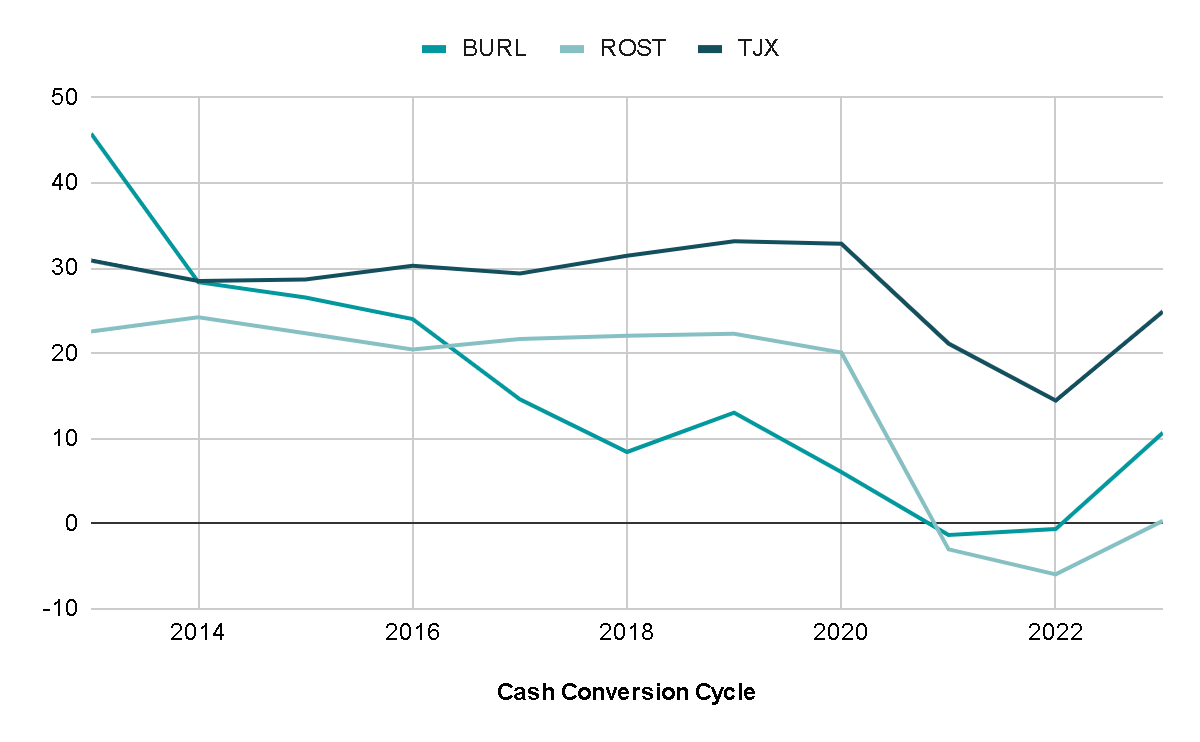
The cash conversion cycle is a metric that reveals the number of days it takes a company to transform the cash spent on inventory back into cash through product sales. It serves as a valuable indicator to gauge a retail business's negotiating power with its suppliers. To enhance payment terms, a company needs a strong reputation and substantial sales volume, compelling suppliers to accept more favorable terms rather than risk losing such a significant client.
In this regard, Ross Stores is the company with the best cash cycle, followed by Burlington, although it is worth mentioning that TJ Companies' metric could be distorted by its foreign operations.
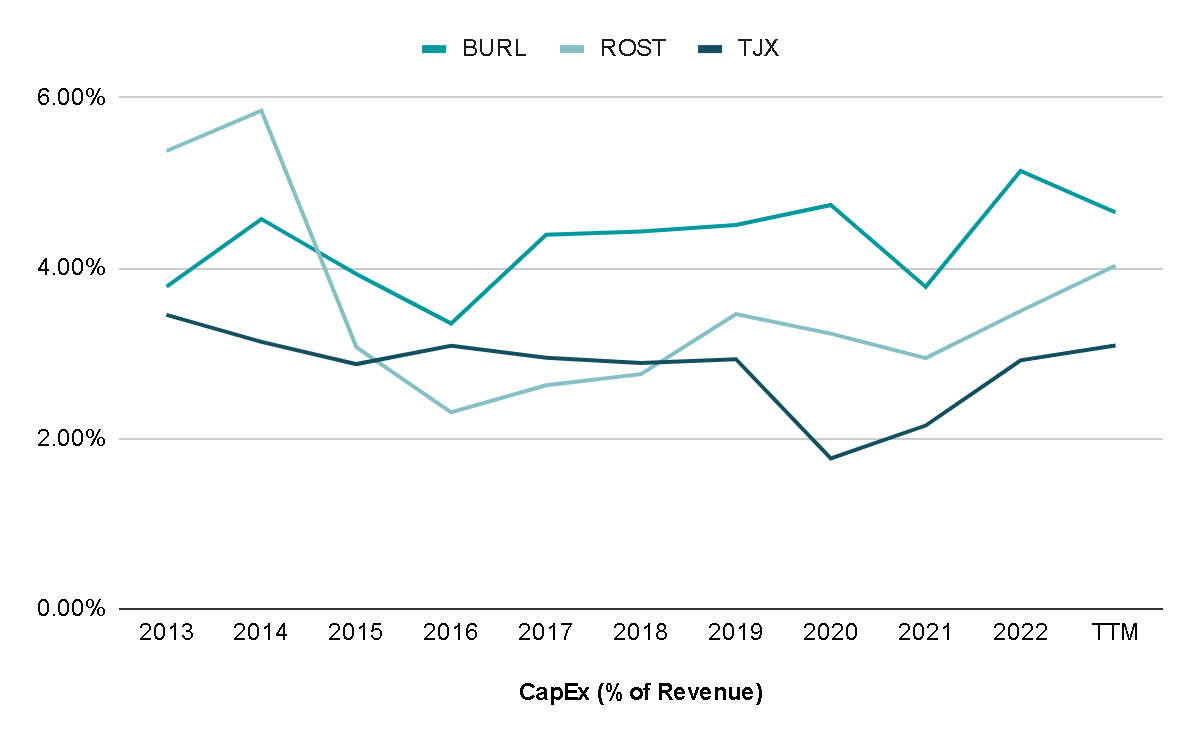
Burlington consistently reports lower Free Cash Flow margins compared to its peers. This can be attributed to the company's emphasis on geographic expansion ; management estimates that they can reach 2,000 stores in the long term, compared to the current 940. As a result, the company prioritizes investment in growth over maximizing profitability.
This focus on growth is evident in the percentage of revenue allocated to CapEx . Over the last 10 years, Burlington has allocated an average of 4.3% of its revenue to CapEx, whereas Ross Stores allocates 3.5%, and TJX allocates only 2.8%.
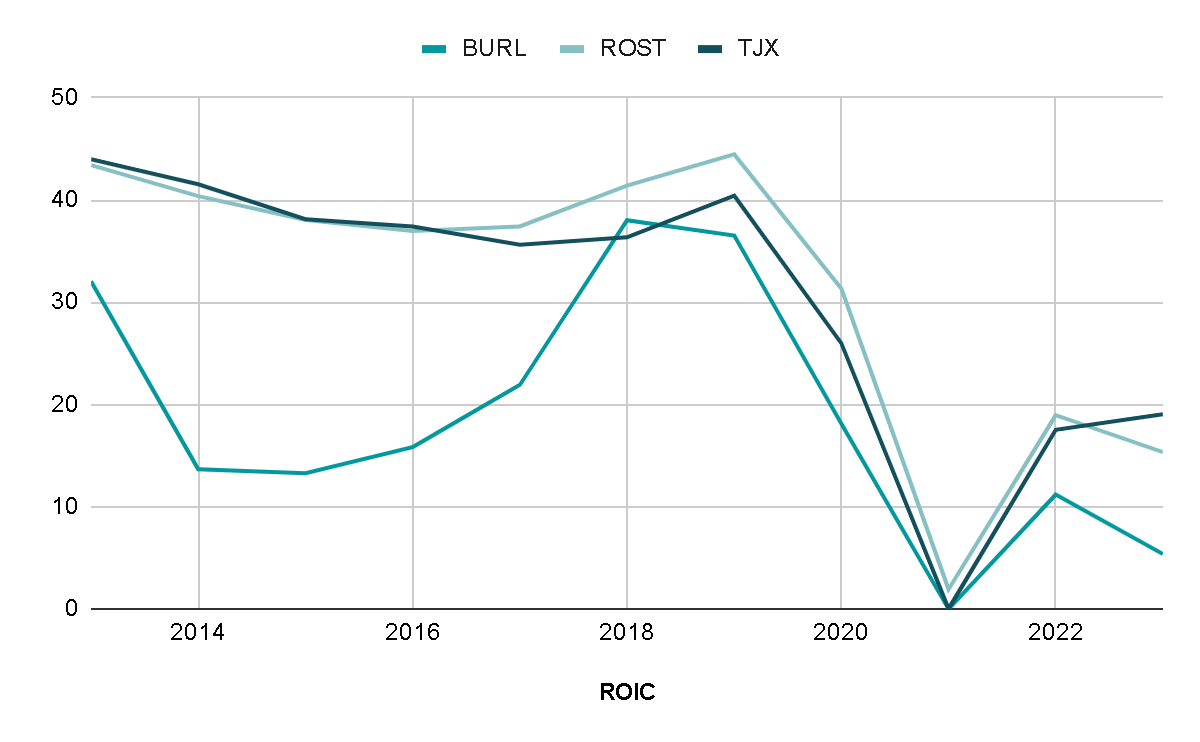
Burlington's return on invested capital ((ROIC)) is the lowest among its peers. While this might initially be viewed as a negative sign and indicative of lower quality compared to its competitors, it's essential to consider the context. It also suggests the untapped potential the company currently possesses, which can be realized as it achieves the necessary scale to focus on profitability. This potential could be reflected in improved margins and ROIC in the future.
ROIC also provides insight into how all companies have faced challenges in regaining their pre-pandemic profitability since the COVID-19 pandemic. With reduced consumer spending in 2020 and ongoing supply chain disruptions in 2022, full recovery remains elusive. To provide perspective, the ROIC averages for the three companies combined were 33% before 2020, but in the last two years has decreased to only 15%.
Burlington 2.0
Since Q2 of FY2020, the company has discussed a strategic plan to maximize its existing potential, given its status as the smallest and least profitable competitor. According to management , the goal of this plan is as follows:
The initiative behind Burlington 2.0 are intended to accomplish a number of things; specifically to drive a much greater focus on merchandised value, to build more check into the business so we can better respond to sales trends, to invest in and strengthen emerging capabilities, to place greater emphasis on opportunistic buying, and also to increase the flexibility of our operations.
To achieve profitable top-line growth, the company has chosen to build smaller stores , as this approach reduces resource usage and occupancy costs, enabling the efficient opening of more stores. From the consumer's perspective, this change could also yield positive effects. Burlington's traditionally larger stores, while seemingly offering more options, can lead to decision dilemmas and potentially result in shoppers leaving without making a purchase. Smaller stores can enhance the shopping experience by avoiding the perception of endless spaces, making the purchasing process more enjoyable for consumers.
I find this initiative highly accurate because I've observed how companies like Sprouts Farmers significantly improved their KPIs after implementing a strategic plan with a clear direction and defined processes to follow. As we've seen, there is a notable gap between Burlington's ROIC and margins and those of its competitors, indicating significant potential for expansion .
Valuation
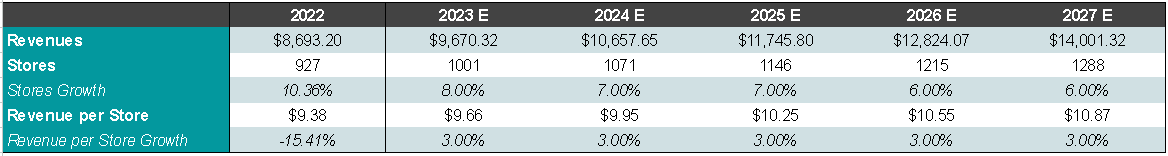
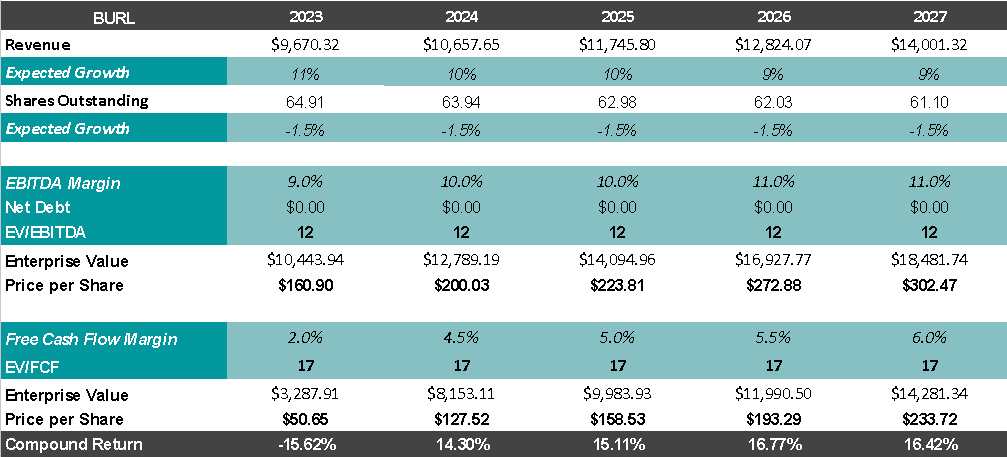
For the valuation, I will consider the most relevant KPIs for a retailer store: Opening of new stores and revenue growth per store.
Over the past decade, Burlington has opened stores at an annual rate of 7%, and revenue per store has increased by 0.6%. It's worth noting that these metrics were affected by the years 2020 and 2022. If we exclude these years, the revenue per store would have shown a more robust annual growth of 3%.
In the most recent conference call , the company announced its intention to open between 70 and 80 stores this year. Over the next few years, they have set the goal of opening 100 stores annually. I will take a more conservative approach and estimate an annual growth of between 70 and 80 stores, which could result in nearly 1,300 stores within five years. As for revenue per store I will maintain the 3% annual average growth of the last 10 years.
I will factor in share buybacks at a rate of 1.5% per year, based on their historical performance over the last 10 years and I will not include net debt in this valuation.
Additionally, I believe the company can return to EBITDA margins of 11% and FCF margin s of 6%, which were levels seen before the COVID-19 pandemic and are comparable to those of ROST and TJX. This achievement could result from the company's strategic plan focused on enhancing profitability and a potential recovery from the challenging business environments of the last three years.
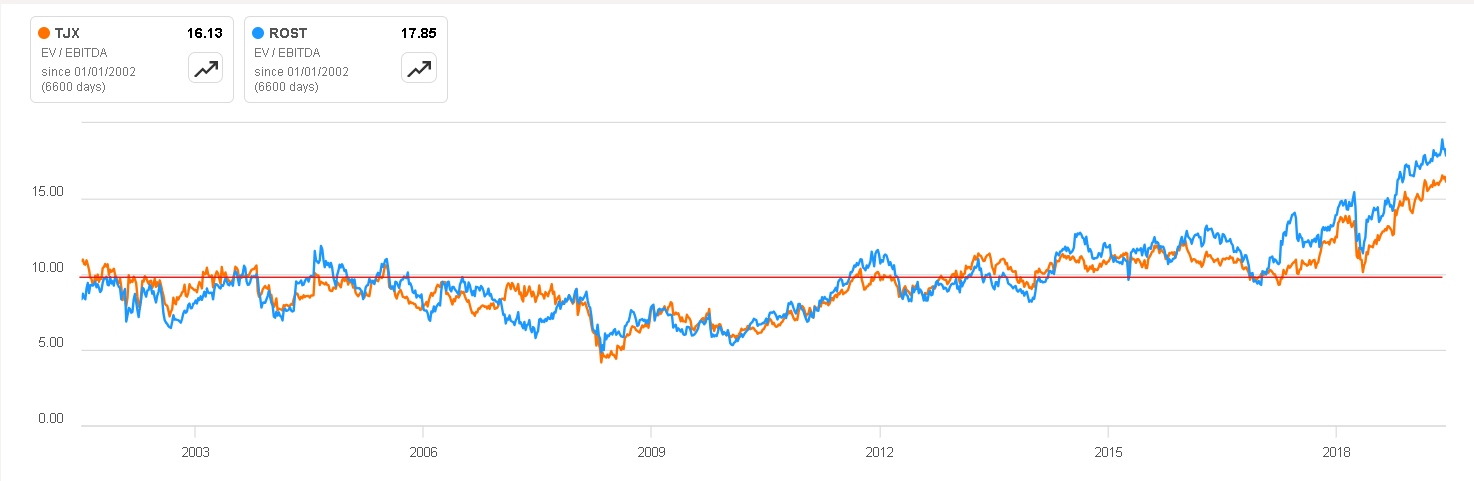
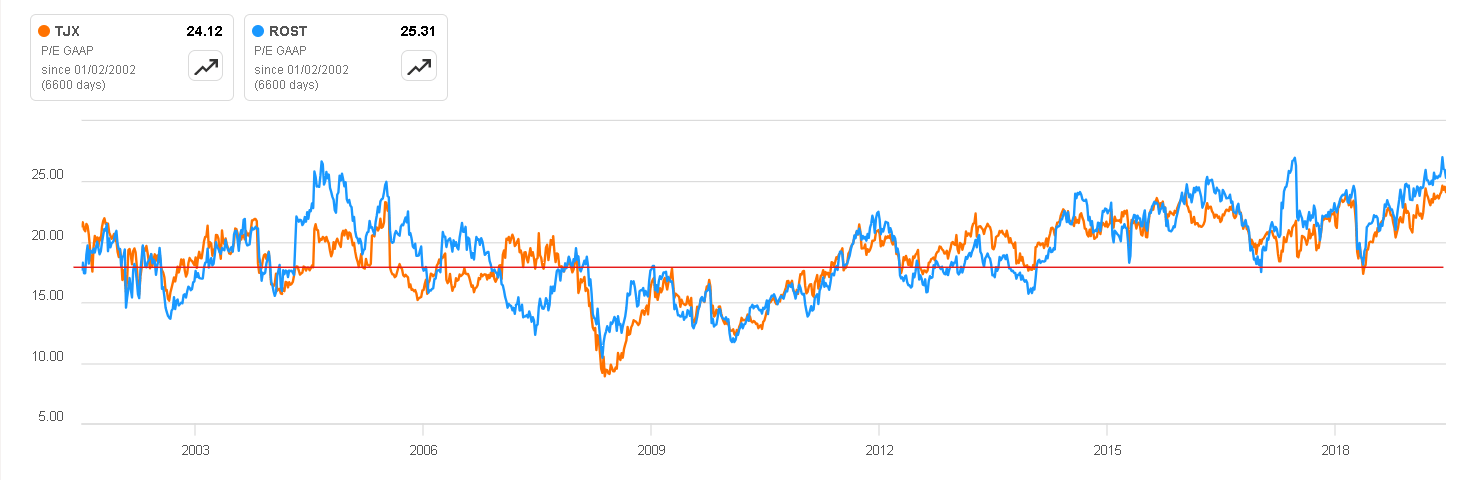
Finally, it's worth noting that between 2000 and 2019 (before the COVID-19 pandemic), companies in the sector typically traded at average multiples ranging between 10 and 12 times EBITDA and 15 to 20 times FCF . I will consider these historical averages for the exit multiples.
All these factors considered, this assessment suggests a potential annual return of 16% for the next five years. This appears attractive, especially when considering the inherent solidity of businesses in this sector and the underlying trend behind it.
Final Thoughts
I believe the company is at an inflection point , poised to take a significant step forward and establish itself as a strong competitor to TJ Companies and Ross Stores. While the difference in scale may raise doubts, the detailed nature of Burlington 2.0's strategic plan is a promising sign of their clarity in objectives. Having well-defined goals can help guide their decision-making.
Taking all these factors into consideration, along with the company's valuation, I have chosen to assign it a ' buy ' rating.
For further details see:
Burlington Stores: Aiming To Close The Quality Gap With Its Peers