STAG - Buy The 5% CD Or These 4 Monthly-Paying REITs?
2023-04-03 07:00:00 ET
Summary
- There’s absolutely nothing wrong with putting your cash in a CD (so long as it’s FDIC insured).
- However, today I'm going to provide you with another alternative that can provide you with a potentially safe 5% yield and some icing on the cake.
- Prominent value investor Professor Joel Greenblatt explained in a 2011 Barron’s interview, “it’s about figuring out what something is worth, and then paying a lot less for it".
It seems that I’m getting comments like this one almost every single day,
“Brad, I’m just going to put my money in a CD that earns me 5% interest, there’s no need to buy a REIT that yields 5%.”
Of course, there’s absolutely nothing wrong with putting your cash in a CD (so long as it’s FDIC insured) but as I remind readers,
“the CD does not appreciate in value like a stock does.”
As my friend and fellow stock analyst Chuck Carnevale pointed out ,
“…all things being equal, dividend paying common stocks provide their shareholders a return bonus, or what some might like to call a kicker, over an equivalent common stock that pays no dividend…
Many investors do not see it this way, as they tend to think of the dividend providing them their return. However, the stock market capitalizes earnings whether a company pays a dividend or not.
Moreover, we contend that the market will value a given company's earnings based on their past and future prospects for growth, again, regardless of whether a dividend is paid or not.”
The point that investors often miss is that an investment in a common stock typically offers shareholders two components of return. The first component is the capital appreciation component or the increase (or decrease) in the stock's value over time.
The second component is the dividend, or lack thereof, that the company pays to shareholders in cash. The two added together equal the shareholders' total return. On the one side, we have the capital growth component and on the other side the income component.”
So, the “CD investor” is missing out on of the most important aspects of the stock investing process, and of course, the secret to unlocking value in the stock market is to understand the “margin of safety” concept.
As Benjamin Graham defined it, the margin of safety constitutes a “favorable difference between price on the one hand and indicated or appraised value on the other.”
This article today is a challenge, for the 5% CD investor, in which I will provide a basket of four monthly paying REITs that yield an average of 5.0% and a forecasted total return over 16% over 12 months.
While there’s no guarantee that these four monthly-paying REITs will return 16% over 12 months, we consider the dividend stream extremely safe as this basket of REITs is powered by around 15,000 rent checks across many sectors (net lease, healthcare, and industrial).
In addition, all four REITs have solid balance sheets that protect them against rising rates and inflation. They’re not FDIC insured, but they do offer strong balance sheets, better than most local and regional banks.
The Final Four Monthly-Paying REITs
Over the weekend, I’m sure many of you watched the Final Four NCAA Men’s basketball tournament in which four teams battled for the playoff game on Monday night. This year I’ve been less interested in the tournament since my favorite team – the North Carolina tar heels – didn’t make it.
Congratulations to UConn and San Diego State fans!
So, without further ado, let’s take a closer look at the four monthly-paying REITs and I will also put together a tracker (at iREIT on Alpha) to see how well these stocks do (as a portfolio) over the next 12 months.
Realty Income ( O )
Realty Income is an S&P 500 net lease REIT that owns over 12,000 free-standing properties in the U.S. and Europe. This is one of the most diversified REITs in our coverage spectrum with over 1,200 clients that operate in 84 different industries. Around 92% of the total rent is resilient to economic downturns and/or isolated from e-commerce pressures.
Realty Income has one of the most defensive balance sheets with A-rated ratings from S&P (A- Stable) and Moody’s (A3 Stable). The credit metrics include 5.3x Net Debt to Adjusted EBITDAre, 5.2x Fixed Charge Coverage Ratio, and 30% Debt to Total Market Cap (95% of debt is unsecured).
Realty Income also has one of the most predictable earnings histories in the REIT sector – the company has generated positive growth in 26 out of 27 years with historical growth of 5.0% (measured by AFFO per share). In addition the company has increased its dividend for 28 consecutive years in a row and is a member of the &P 500 Dividend Aristocrats.
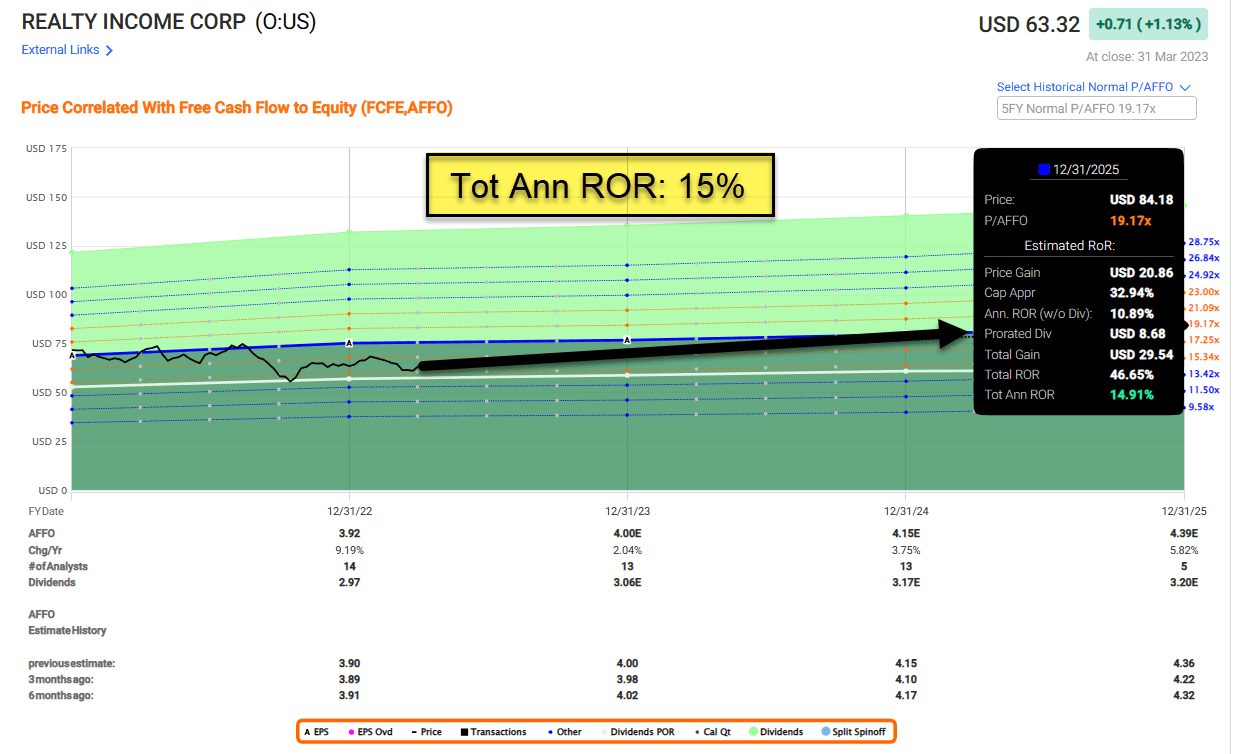
We find Realty Income attractive today based on a current price of $63.32 and P/AFFO multiple of 16.1x. The normal P/AFFO is 17.7x and the current dividend yield is 4.8% with a payout ratio (based on AFFO) of around 81%.
Analysts expect Realty Income to grow AFFO per share by 2% in 2023, which is based on modest acquisition guidance of $5 billion in 2023. Although cost of capital has increased for the company, we believe the company can continue to generate investment spreads of around 150 bps in addition to normal rent bumps (over around 1.5% annually). As illustrated below, we are targeting shares to return ~15% annually, and we maintain a BUY.
LTC Properties ( LTC )
LTC is a senior housing and healthcare REIT a portfolio of 216 properties that consist of assisted living (137), skilled nursing (78), and mortgage loans (42).
Around 67.5% of the portfolio consist of owned properties based on gross investments. LTC is diversified geographically and seeks to invest in states with the highest concentration of properties located where there’s a largest 80+ population cohort.
LTC also maintains a defensive balance sheet with Q4-22 Debt to Enterprise Value of 34.2% and Debt to Annualized Adjusted EBITDAre of 5.0x. At the end of 2022 the company has $280 million of liquidity with no significant long term debt maturities over the next five years.
LTC’s FAD payout ratio at the end of 2022 was 77% (due to non-run rate items) and the company expects the Q1-23 payout ratio to be closer to the low to mid-80% range. Although LTC does not have the same impressive dividend growth record as Realty Income, the healthcare REIT has never cut its dividend.
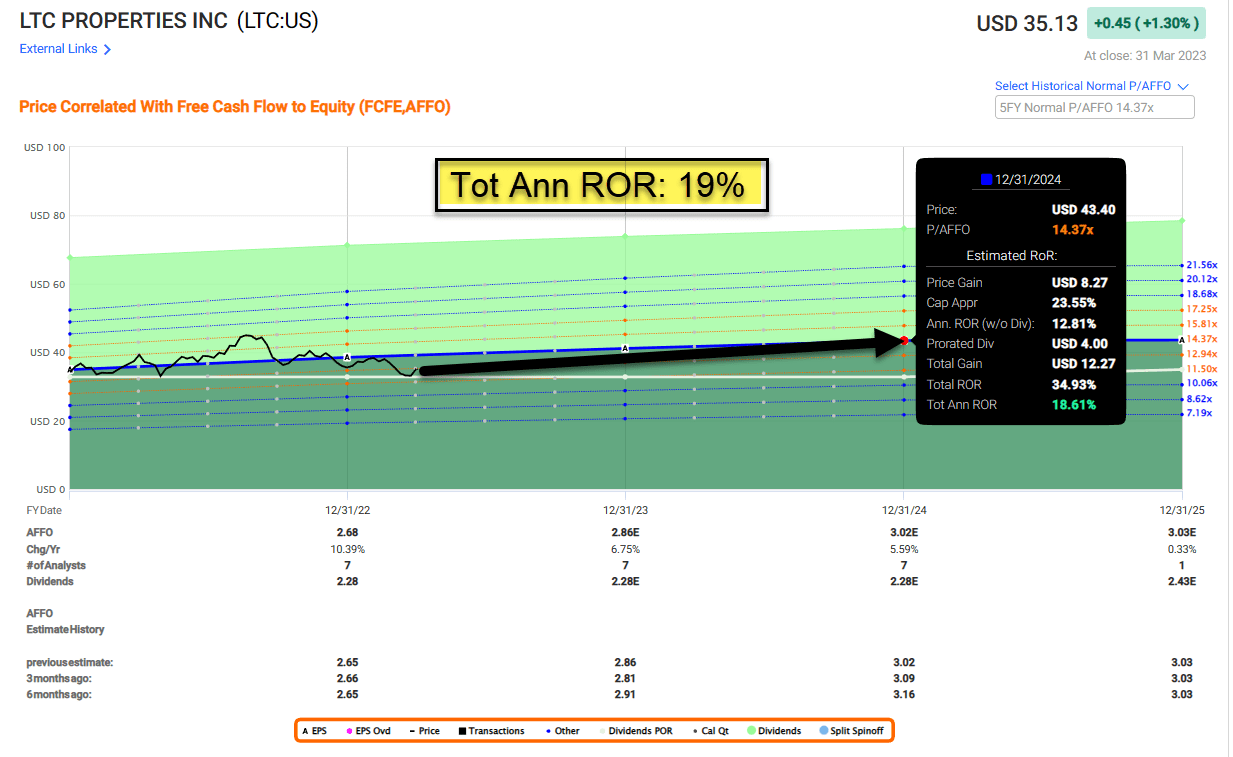
From a valuation perspective, we find LTC solid with a share price of $35.13 and P/AFFO multiple of 12.9x. The historical multiple was 14.9x and the current dividend yield is 6.5%. The company has done a nice job clawing back from the pandemic as earnings have grown by 10% in 2022 and analysts are forecasting 7% growth in 2023 and 6% in 2024.
I’ve been very impressed with the capital markets discipline I’ve seen with LTC and I consider the total return prospects above average. As viewed below, we’re modeling shares to return 19% over the next 12 months.
Agree Realty ( ADC )
ADC is a net lease REIT that owns 1,800 properties located in all 48 continental states and containing approximately 38 million square feet of gross leasable space.
The portfolio is made up of 86% investment grade rated tenants, 16% sub-investment grade rated, and 16% non-rated. The company has also built up a war chest of ground leased properties that consist of 206 leases (12.4% total ABR) with a weighted lease average of 11.2 years.
ADC also has a rock-solid balance sheet (rated BBB by S&P) with Total Debt to Enterprise value if 23% and a fixed charge coverage ratio (includes principle amortization and the preferred dividend) of 5.0x. ADC also has limited variable rate debt and no material debt maturities until 2028.
The payout ratios as of Q4-22 and full year 2022 remained at or below the low end of the targeted range of 75% to 85% of AFFO per share. Analysts forecast ADC to grow earnings (AFFO per share) by 2% in 2023 and 4% in 2024.
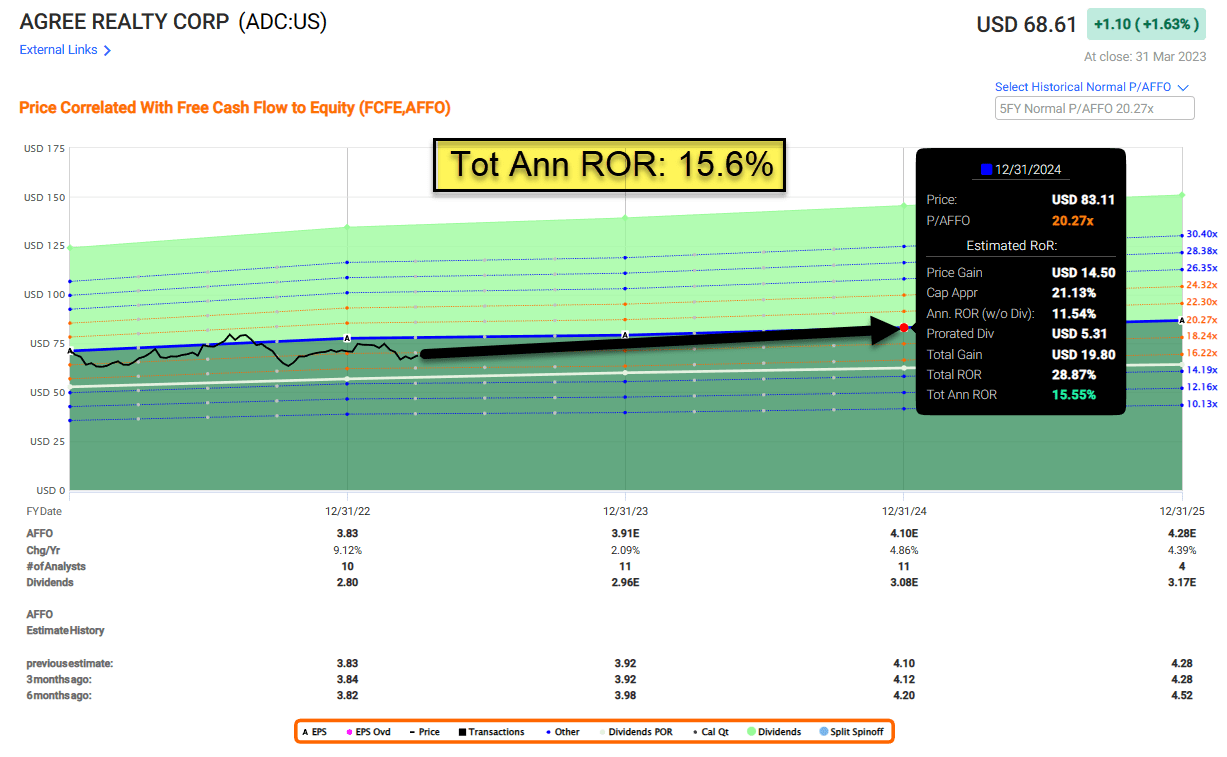
In terms of valuation, we find ADC attractively priced as shares trade at $68.61 per share with a P/AFFO multiple of 17.8x. The normal multiple is 18.9x and the current dividend yield is 4.2%. As seen below, we forecast shares to return 15% over the next 12 months.
STAG Industrial ( STAG )
STAG is an Industrial REIT that owns 562 properties in 41 states. The 111 million square foot portfolio is located in primary and secondary markets (96.4%) with a portfolio weighted average lease term of 4.7 years.
STAG has approximately 61.5% of projected 2023 leasing already addressed with aggregate cash leasing spreads of 31.6% accomplished with no large known move outs included in the guidance. The 2023 guidance range for cash same-store growth is 4.5% to 5%, anchored by weighted average rental escalators of approximately 2.5%.
STAG has also maintained a strong balance sheet with net debt to annualized run rate adjusted EBITDA equal to 5.2x with $847 million liquidity at year-end 2022. Only 18% of debt maturities through 2025 and only 29.7% on unsecured debt.
STAG has done a great job reducing its payout ratio since the IPO and the ratio continues to moderate declining from 82.1% to 77.8% at year-end 2022. In 2022 STAG retained approximately $76 million of free cash flow after dividends paid used for incremental investment opportunities, debt repayment and other general corporate purposes.
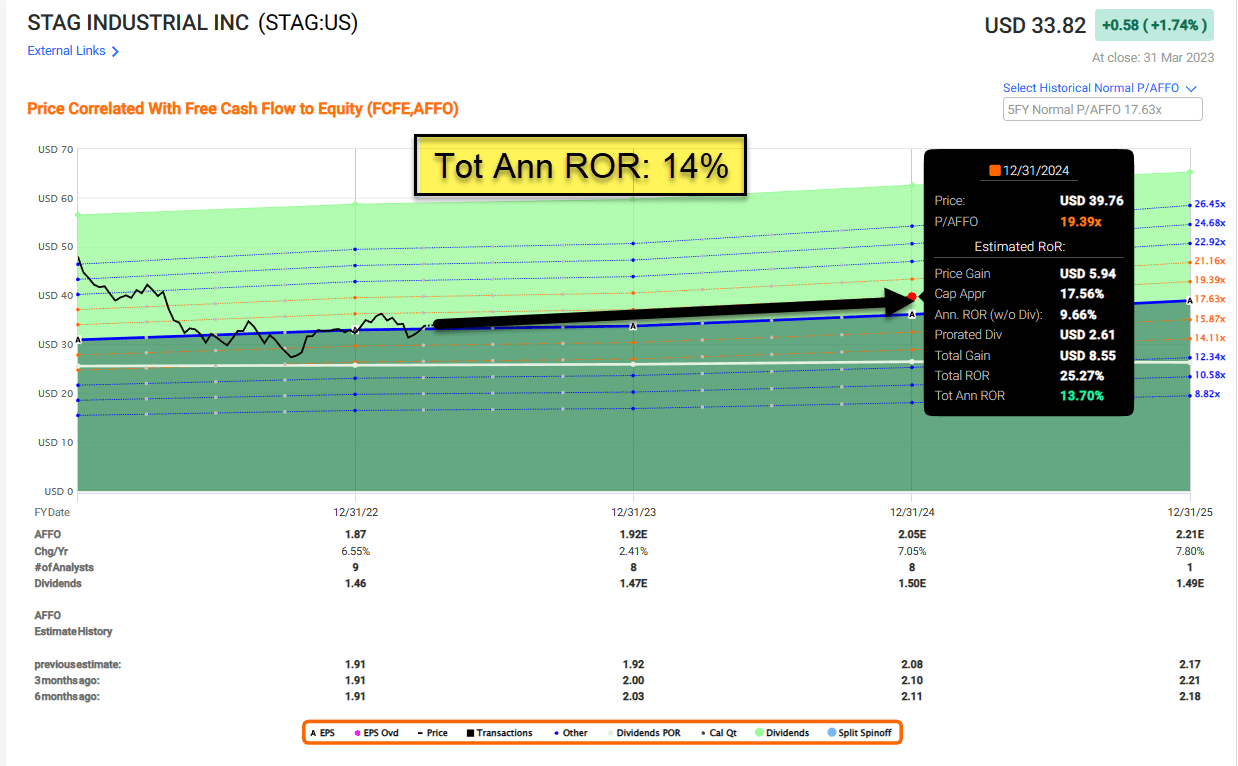
STAG’s valuation is also attractive with shares trading at $33.82 with a P/AFFO multiple of 17.9x. The normal multiple is 17.6x and the dividend yield is 4.4%. While that suggests “sound” value, the growth prospects are encouraging as analysts see 7% growth (AFFO per share) in 2023 and 2024. As viewed below, we see STAG returning 14% overt 12 months.
In Closing…
Is this appealing?
cit-bank
Or this?
iREIT on Alpha
As Chuck Carnevale pointed out,
“…dividend paying stocks are capable of providing both a return of original capital invested and a return on your money…dividend paying stocks are fully capable of being great total return generators.”
Of course, as prominent value investor and Columbia finance Professor Joel Greenblatt explained in a 2011 Barron’s interview,
“it’s about figuring out what something is worth, and then paying a lot less for it.”
Happy SWAN Investing!
Author's note: Brad Thomas is a Wall Street writer, which means he's not always right with his predictions or recommendations. Since that also applies to his grammar, please excuse any typos you may find. Also, this article is free: Written and distributed only to assist in research while providing a forum for second-level thinking.
For further details see:
Buy The 5% CD Or These 4 Monthly-Paying REITs?