TTE - Buy The Dip: 2 'Strong Buy' Renewable Energy Stocks
2023-06-09 08:05:00 ET
Summary
- Renewable energy stocks have sold off recently over concerns about how higher interest rates will affect their profitability.
- But the four renewable power producers we highlight in the article have structured their balance sheets well and have plenty of liquidity and optionality.
- We compare and contrast the four renewables stocks and view them all as being good buying opportunities today, to varying degrees.
Co-produced by Austin Rogers for High Yield Investor.
As the United States approaches another election season, it could be natural for investors to retreat to the corners of their respective political biases either in favor of or against renewable energy sources like solar panels and wind farms.
We encourage investors to set aside their political views when it comes to investments in various sources of electric power.
For those in favor of renewables, it's important to keep in mind that zero-carbon power sources cannot viably grow fast enough to meet the full extent of the growth in electricity demand. Therefore, other sources of power such as natural gas are required as well. Plus, the world simply is not ramping up mining of the critical metals and minerals required to make the "net zero by 2050" pledges achievable.
For those against renewables, it's important to note that the falling costs of wind and solar power production as well as substantial government incentives make continued heavy investment in renewable energy virtually assured. There are profitable ways to invest in the growth of renewable energy. Ignore them at your peril.
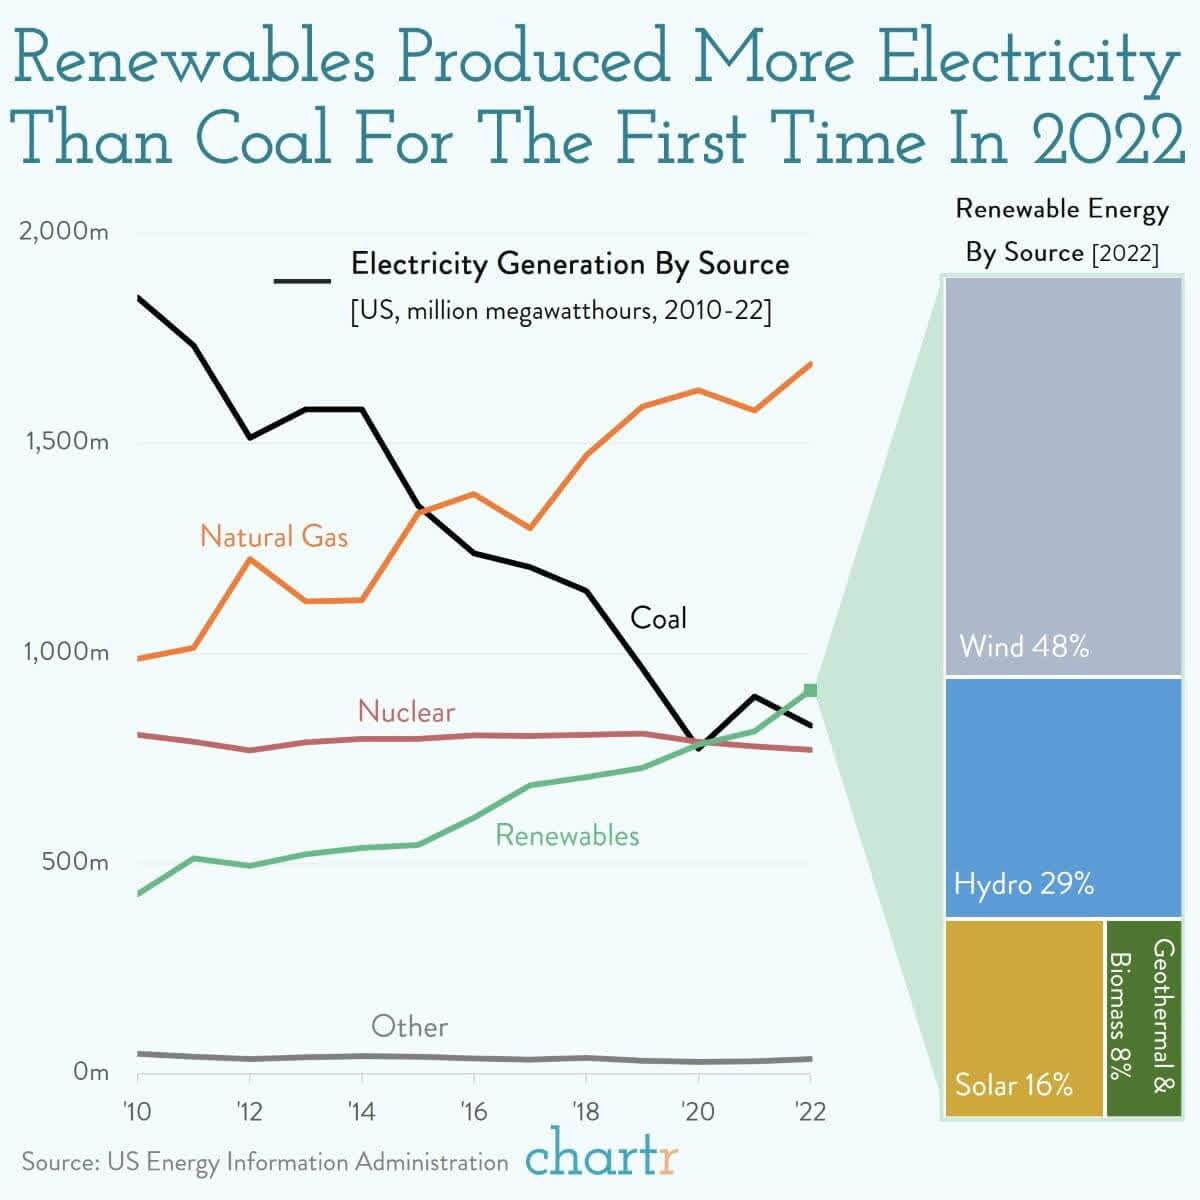
Notice from the following chart, showing U.S. electricity generation by energy source over time, that both renewables and natural gas have greatly increased their output and share of total generation over the last decade.
That's why we at High Yield Investor are source-agnostic when it comes to electric power generation. While we seek to profit from the growth of renewables, we also invest heavily in highly defensive oil & gas pipelines, storage facilities, and export terminals.
Interestingly, since 2015, midstream oil and gas infrastructure companies ( MLPX ) have collectively produced about the same total returns as renewable energy producers ( RNRG ), although the two have taken very divergent paths to get to where they are today.
As you can see, however, renewable power producers on the whole have seen their share prices slide back to COVID-era lows.
We are seizing this opportunity and buying the dip.
In what follows, we'll compare and contrast the four major publicly traded producers of renewable energy.
Comparing the Major Publicly Traded Renewable Power Producers
The four (mostly) pure-play renewable energy producers on US stock exchanges are:
- Brookfield Renewable ( BEP , BEPC ) -- Part of the Brookfield Asset Management ( BAM ) family, domiciled in Canada, generates a K-1 form
- NextEra Energy Partners ( NEP ) -- majority owned and sponsored by the largest renewables developer in the US, NextEra Energy Inc. ( NEE ), no K-1 form
- Clearway Energy Inc. ( CWEN , CWEN.A ) -- minority owned but controlled and sponsored by Clearway Energy Group, a renewable energy developer co-owned by Global Infrastructure Partners and TotalEnergies SE ( TTE ), no K-1 form
- Atlantica Sustainable Infrastructure ( AY ) -- no sponsor, minority owned by Algonquin Power & Utilities ( AQN ), no K-1 form
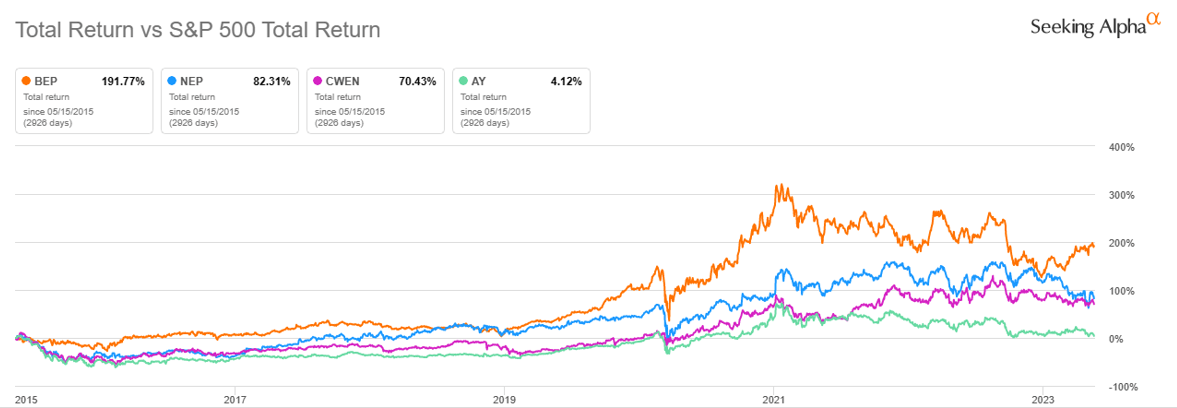
Despite having somewhat of a disadvantage (at least among retail investors) in issuing a K-1 form, BEP has generated the strongest total returns across long time periods.
Since May 2015, BEP has generated 192% in appreciation and dividends, followed by NEP at 82%, CWEN at 70%, and AY at a measly 4%.
But timing is everything. This chart begins at the time that CWEN made its debut as a public stock. The other three have longer histories.
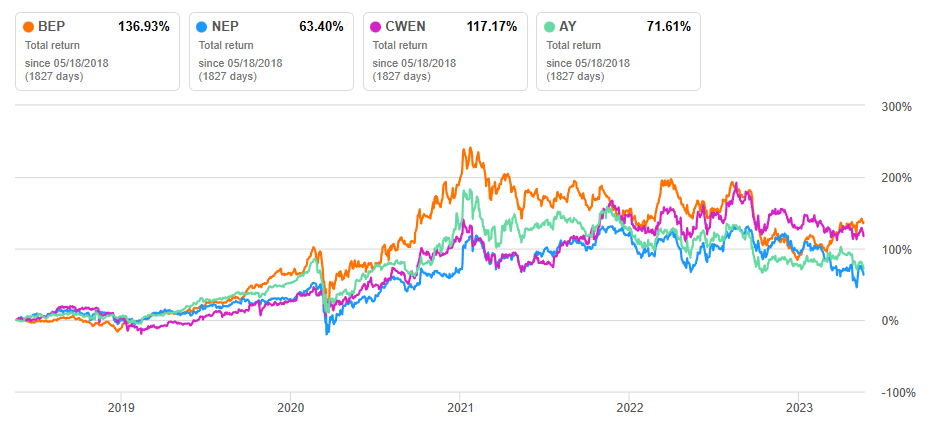
If we instead look at the last five years, we find a much more even distribution of total return performance.
Although these four stocks generally follow the same trajectory, there are multiple significant differences between them.
Let's start with size.
It's important to acknowledge that BEP is by far the biggest player in the space. In fact, by enterprise value, the other three companies combined still aren't as big as BEP's $55 billion.
BEP's size, global scale, and multi-decade experience, and expertise in zero-carbon power production make it the go-to decarbonization partner for large corporations around the world.
Brookfield Renewable
BEP has the scale and access to capital, for example, to acquire Australia's largest integrated power generator and energy retailer in order to invest heavily in its decarbonization. Plus, BEP has by far the largest development pipeline of its peers at over 100 gigawatts, around four times its currently operational portfolio.
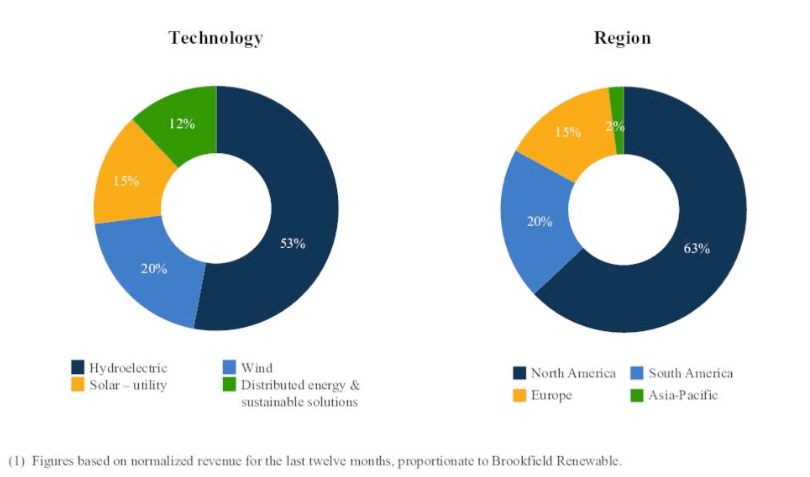
Moreover, BEP enjoys a very solid foundation (over 50% of revenue) from hydropower dams, which add a stable and reliable source of cash flow with which to invest in its fast-growing wind and solar segments.
The overwhelming majority of BEP's revenue comes from long-term contracts with a weighted average remaining life of 14 years, and 70% of those contracts by revenue feature inflation-based escalations.
When it comes to the balance sheet, BEP boasts the best in the business:
- BBB+ credit rating.
- 97% of total debt with fixed interest rates.
- 36% total debt to total capitalization.
- 12-year weighted average term to maturity.
This strong and well-structured BEP balance sheet is a major benefit during a time of rising interest rates. For example, despite investment grade bond yields averaging over 5% in the last 8 months or so, BEP's average interest rate on project-level debt (which makes up 90% of total debt) has only increased from 4.9% at the end of 2022 to 5.3% at the end of March 2023.
This is a trait that all four renewable power producers share: debt rolls over slowly, while revenue continues to increase quarter after quarter. Thus, as interest expenses rise, so too will revenue and EBITDA.
NextEra Energy Partners
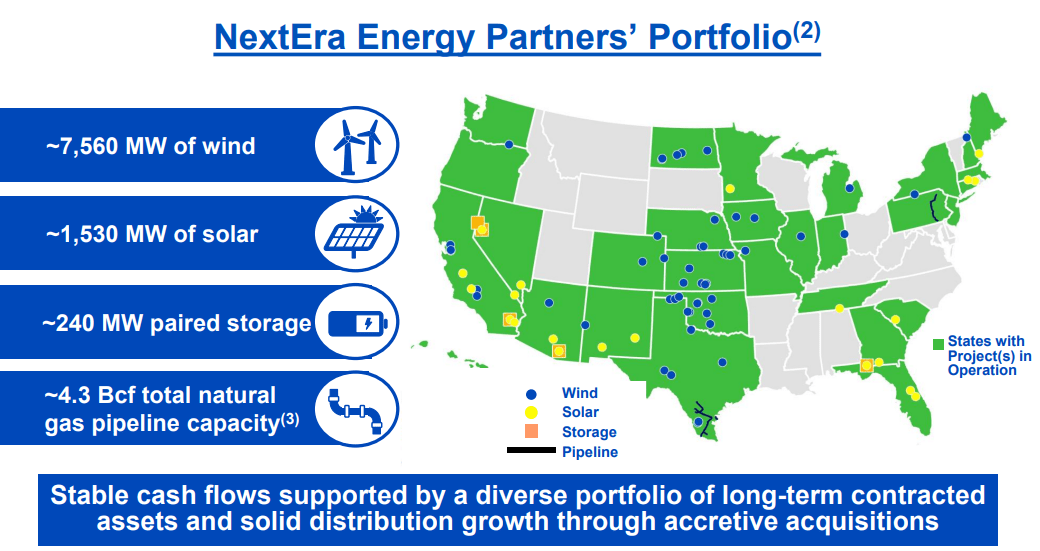
NEP's 9.3 GW portfolio of wind, solar, and battery storage assets in 30 states across the country is only slightly smaller than BEP's non-hydro portfolio.
Like BEP, NEP's portfolio enjoys long contract lives, with a weighted average remaining contractual term of 15 years and an average customer credit rating of BBB+.
And despite being externally managed by NEE, the managers of NEP have displayed extraordinary alignment with NEP unitholders over the years. First, they capped incentive distribution rights, then they suspended them entirely through 2026.
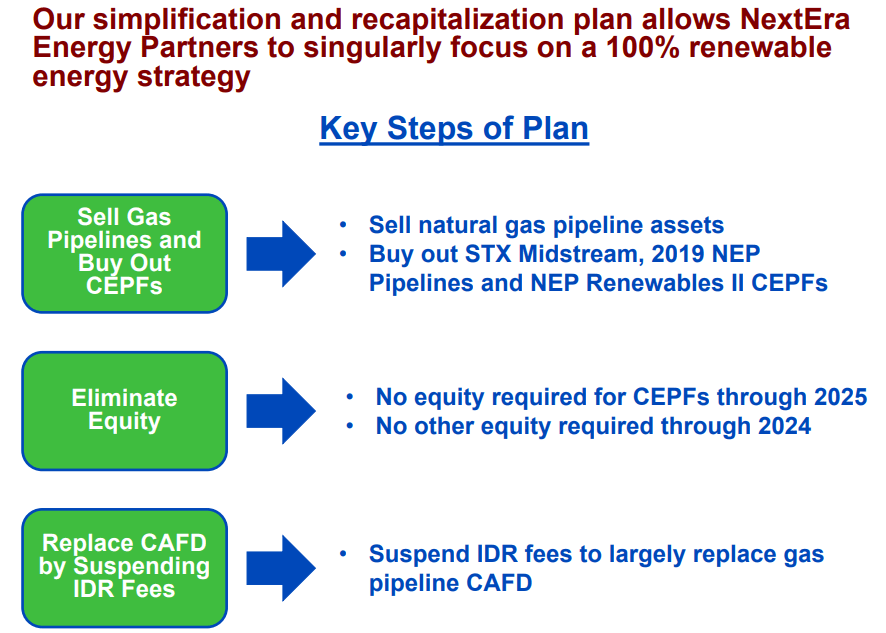
Finally, rather than lower their ambitious 12-15% annual distribution per unit target when the unit price dropped, management announced a plan to sell NEP's natural gas pipelines in order to become a pure-play renewables producer and avoid the need to issue further equity.
The proceeds of the gas pipeline disposition will eliminate all convertible equity financing buyouts for the next 2.5 years, while the suspension of IDRs will mostly offset the lost cash flows.
Though NEP's credit ratings of BB/BB+ are lower than BEP's, the planned sale of the pipeline assets should eliminate the need to tap corporate-level capital through at least the end of 2024. By then, the current capital markets disruption will likely have settled.
Clearway Energy
Like NEP, CWEN's 8.1 GW renewable energy portfolio is concentrated exclusively in the United States. Around 75% of CWEN's portfolio cash flow derives from renewables assets, while the remaining 25% comes from gas-fired power plants in California and Connecticut.
Like BEP, most of CWEN's debt is in the form of self-amortizing, non-recourse, project-level loans wherein CWEN pays down 7.5-10% of the remaining principal each year.
After selling its thermal power facilities in 2022 at a favorable price, CWEN has a tremendous cash pile to put to work. Most of it has already been committed to new projects, but there still remains enough cash available to prevent the need for CWEN to raise equity capital anytime in the next year or so.
CWEN's sponsor, Clearway Energy Group, continues to increase the size of its development pipeline, which now sits at 29.3 GW. About 2.5 GW of that is in advanced or construction-stage projects, some of which will be dropped down to CWEN.
CWEN now has a 12-quarter record of consecutive dividend hikes at around 2% per quarter. Management believes they can achieve their targeted 6-8% annual dividend growth plan through at least 2026.
Atlantica Sustainable Infrastructure
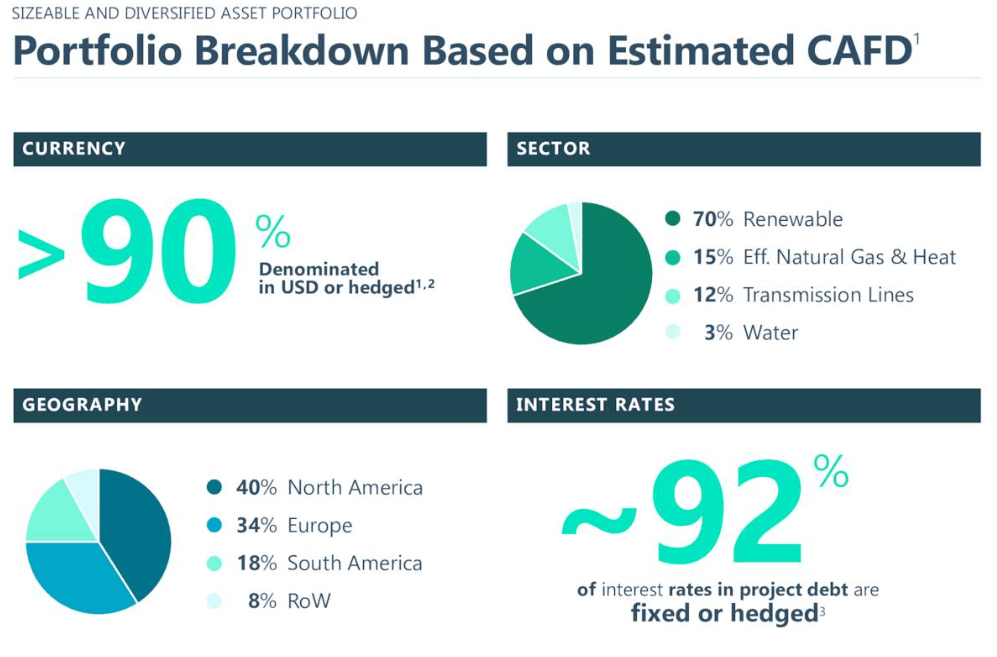
AY has a globally diversified portfolio of power generation and transmission assets, 70% of which are renewables and 90% of which are denominated or hedged in USD. That last 10% of non-hedged, non-USD revenues, however, can cause some fluctuations in results that don't always reflect the underlying fundamental strength of the assets.
Only 40% of AY's assets are located in North America (the lowest of its peers), while 34% are in Europe, 18% in South America, and 8% in the rest of the world.
Like its peers, AY's portfolio enjoys an average remaining contract life of 14 years, and 100% of its non-recourse project-level debt fully amortizes (principal fully paid off) before the end of each respective project's contract term expiration. About 43% of AY's project-level debt will be paid down through this mechanism in just the next five years.
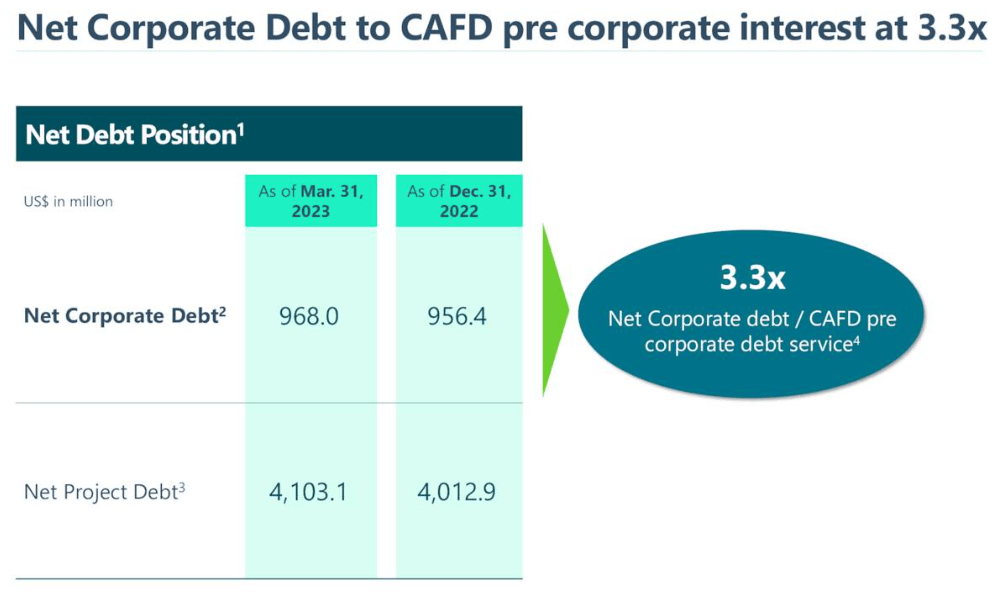
And ~80% of AY's total debt is in these overwhelmingly fixed-rate, project-level loans. The other ~20% is in corporate-level debt. At the corporate level, AY's net debt to cash flow sits at 3.3x, roughly in line with its historical average.
We think AY has underperformed mainly because of currency fluctuations and the lack of a marquee sponsor to provide a robust development pipeline for drop-down acquisitions. But the poor share price performance masks AY's underlying strength.
Bottom Line
At High Yield Investor, we just recently bought more of our top pick in the sector, but we will reserve further discussion about that for our members.
In any case, we view the selloff in renewable energy producers like the four companies above as a great dip-buying opportunity. The market worries about their heavy use of debt and lack of investment-grade credit ratings (aside from BEP), but these companies have structured their debt extraordinarily well, in our judgment.
Little debt needs to be refinanced in any given year, which means that interest expenses will rise only slowly, allowing organic revenue growth to offset this headwind.
Though we are bullish on midstream oil and gas stocks as well, we view renewable energy names as being great buys for dividend investors today.
For further details see:
Buy The Dip: 2 'Strong Buy' Renewable Energy Stocks