IJS - CALF: Small-Cap Cash Cows Grapple With Slow Sales And Earnings Growth
2023-05-21 11:58:52 ET
Summary
- CALF is a free-cash-flow-focused fund providing exposure to 100 small-cap stocks. The ETF has $2.14 billion in assets under management and a 0.59% expense ratio.
- CALF has the best profitability score out of any small-cap fund I've encountered. Its free-cash-flow-yield screen drives down valuations and overall, it's a better choice than plain-vanilla ETFs.
- However, each quarterly reconstitution results in vastly different portfolios that won't necessarily score well on other key metrics. High turnover is a double-edged sword.
- In particular, CALF's sales growth, earnings growth, and earnings momentum scores suffered substantially with the latest shuffle.
- Given these disappointing results, I have downgraded CALF from a buy to a hold.
Investment Thesis
Today's article explains why I've decided to downgrade the Pacer US Small Cap Cash Cows 100 ETF ( CALF ) from a buy to a hold. While the prior two reconstitutions moved the portfolio in the right direction, the most recent one saw a substantial downgrade in sales and earnings growth. CALF is still a better long-term hold than most peers, but its fundamentals are no longer appealing. Therefore, I recommend investors avoid CALF today but watch for a better buying opportunity next quarter.
CALF Overview
Strategy Discussion
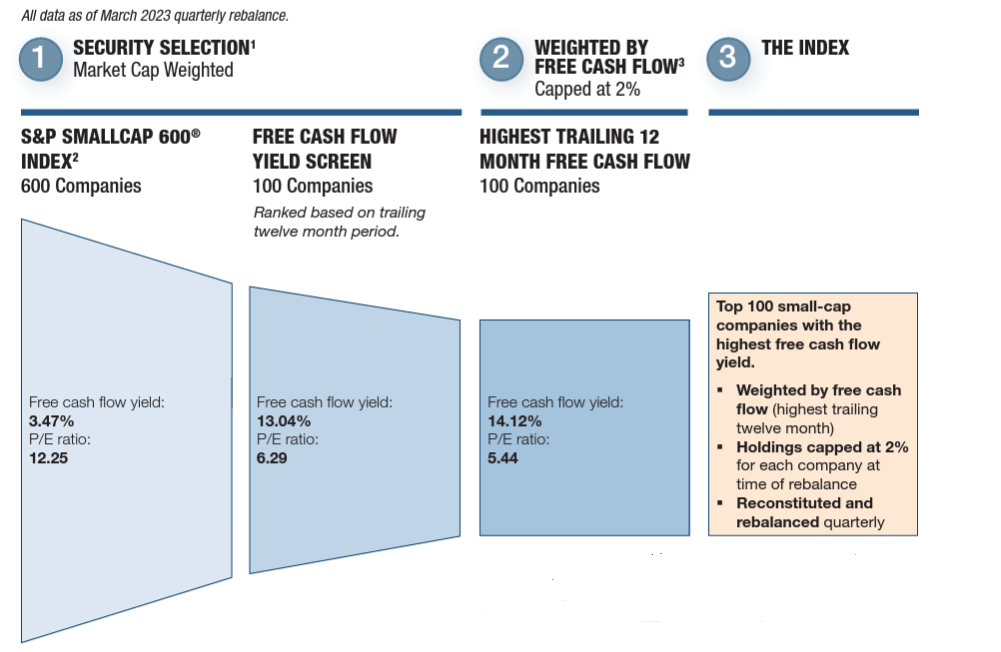
CALF tracks the Pacer US Small Cap Cash Cows Index, selecting 100 small-cap stocks with high trailing twelve-month cash flow yields. One feature I like is that the Index weights constituents by free cash flow dollars, not free cash flow yield. This approach advantages larger, more profitable companies, while the 2% weighting cap on securities ensures solid diversification at the company level. However, there is no apparent sector weighting cap. The graphic below illustrates the selection and weighting process.
Companies from the Financials sector are not eligible. Furthermore, securities must have a positive consensus free cash flow estimate over two years.
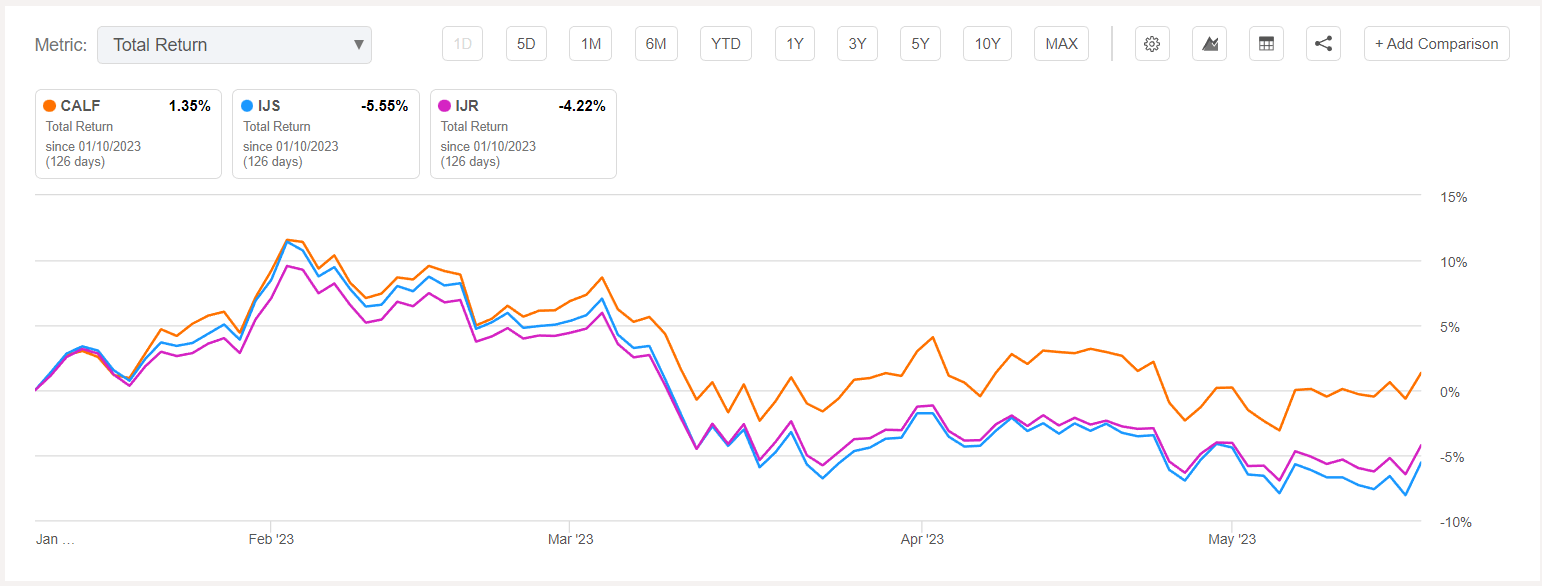
The process guarantees a high free cash flow yield and a low P/E relative to the S&P SmallCap 600 Index. However, my favorite part of the approach is the focus on profitability. Small-cap investors need that crucial screen to avoid unnecessary speculation. While the cheap valuation looks great on paper, it only sometimes indicates good value. Often, stocks trading at low valuations are priced that way for a reason. My multi-factor approach to analyzing ETFs helps identify why, and in situations like last quarter, there were several reasons to believe CALF would outperform. It did, beating the iShares S&P Small-Cap 600 Value ETF ( IJS ) and the iShares Core S&P Small-Cap ETF ( IJR ) by 6.90% and 5.57% since my rating upgrade .
CALF Reconstitution Results
CALF reconstitutes quarterly, and sometimes, the changes are substantial. It's a double-edged sword, so I closely monitor things to ensure other factors remain strong. This quarter, 23 companies were substituted, coincidentally accounting for 23% of the portfolio. The Index added several Homebuilding stocks, including TRI Pointe Group ( TPH ) and Meritage Homes ( MTH ). In addition, many Oil & Gas stocks received high weightings, like Comstock Resources ( CRK ) and Callon Petroleum ( CPE ). The average five-year beta for these 23 additions is 1.70, so they are riskier plays.
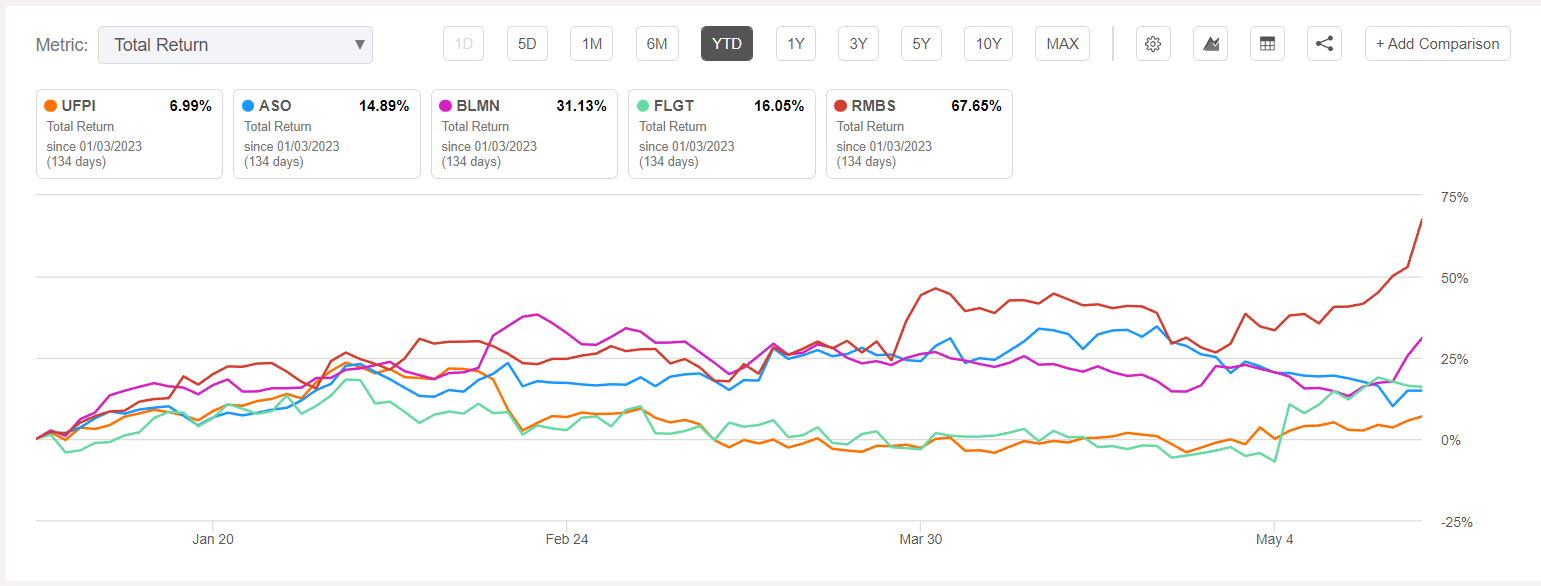
The 23 deletions were less risky, with only a 1.12 average five-year beta. The process is to rotate into cheaply-valued stocks with high free cash flow yields, so top-performing ones tend to get screened out. To illustrate, here are the YTD returns for five companies, which previously totaled 8% of CALF.
These changes are simply an output of a model behaving as designed. Still, I doubt most value investors desire a riskier portfolio. Furthermore, it's difficult to predict whether the Index will select high or low-growth stocks, a metric to consider in tandem with valuation.
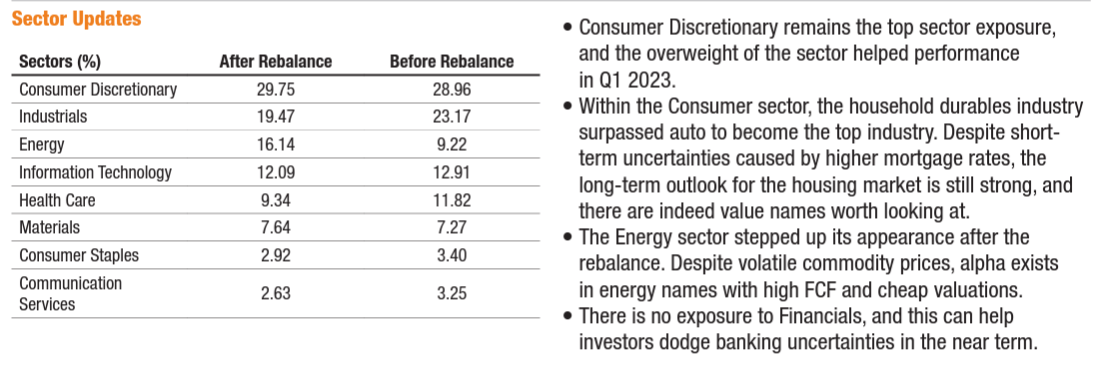
Finally, Pacer ETFs conveniently provides its own quarterly reconstitution summary . The following outline is as of March 17, 2023. However, the commentary is most interesting, as everything is framed positively and almost implies the changes were intentional. However, these are merely after-the-fact observations and, importantly, unrelated to the free cash flow screen.
My responses to these observations are:
1. Consumer Discretionary outperformed in Q1 2023, but why will that continue? Exposure to Homebuilding stocks increased by 8%, so the "short-term uncertainties caused by higher mortgage rates" may be a significant problem. I imagine we'd see the opposite statement had exposure decreased, so this isn't a very valuable analysis.
2. Management acknowledges how "volatile commodity prices" impact Energy stocks. While alpha may exist, the "glass half-empty" viewpoint is that CALF is much riskier than before.
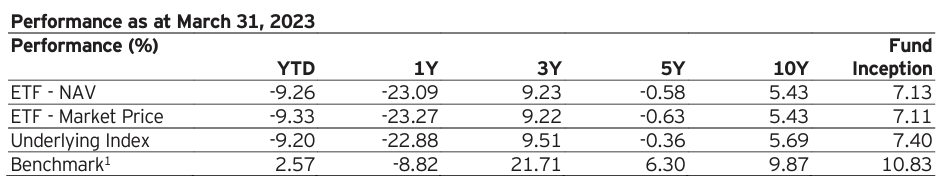
3. The mention of Financials is the most valuable statement. By excluding stocks in this sector, CALF dodges a traditionally poor-performing segment. To illustrate, the Invesco S&P SmallCap Financials ETF ( PSCF ) underperformed its benchmark, the S&P SmallCap 600 Index, by 3.70% per year since its launch.
CALF Performance Overview
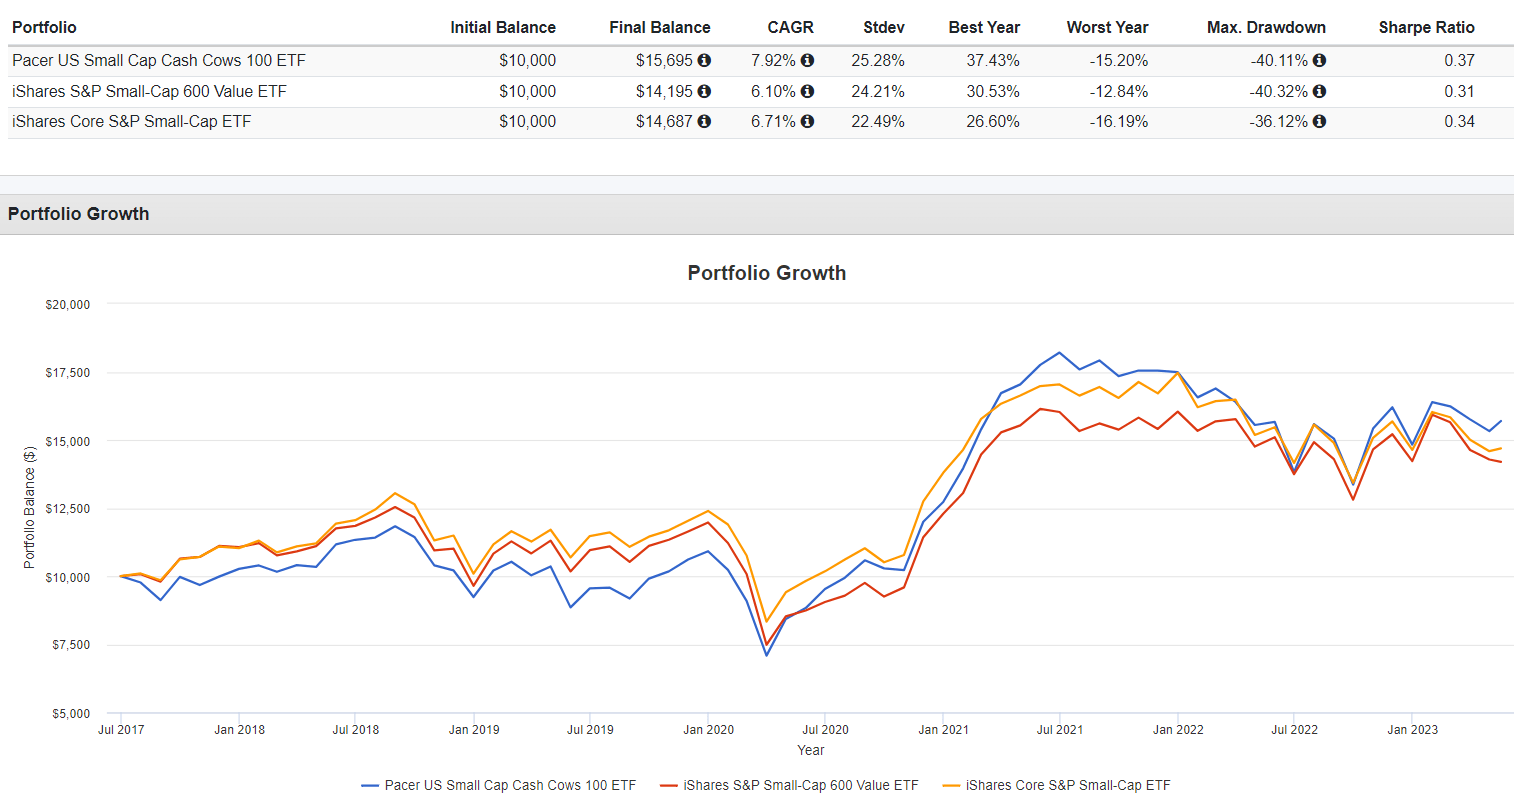
CALF is up an annualized 7.92% since May 2017 compared to 6.10% and 6.71% for IJS and IJR. These are excellent results, considering CALF's 0.49% expense ratio is much higher. It demonstrates value in the strategy, especially since its risk-adjusted returns (Sharpe Ratio) are better. Despite my criticism today, I want to emphasize how crucial CALF's profitability screen is and why I'm confident it drives the outperformance you see below.
However, I'm not confident CALF will outperform in the short term. As I mentioned earlier, there's no telling which factors CALF will score well on after each reconstitution. The only certainties are relatively high profitability and a low valuation. CALF is worth owning if you want specific exposure to only these two factors. However, a multi-factor approach is more rewarding. Take the Schwab U.S. Dividend Equity ETF ( SCHD ), for example. Its reconstitutions are often substantial. However, the main factors (concentration, volatility, growth, valuation, dividends, profitability) are consistent. There's less to worry about, whereas CALF's inconsistency makes it more of a gamble. Therefore, let's look at its current composition next to identify the pros and cons.
CALF Analysis
Sector Exposures and Top Ten Holdings
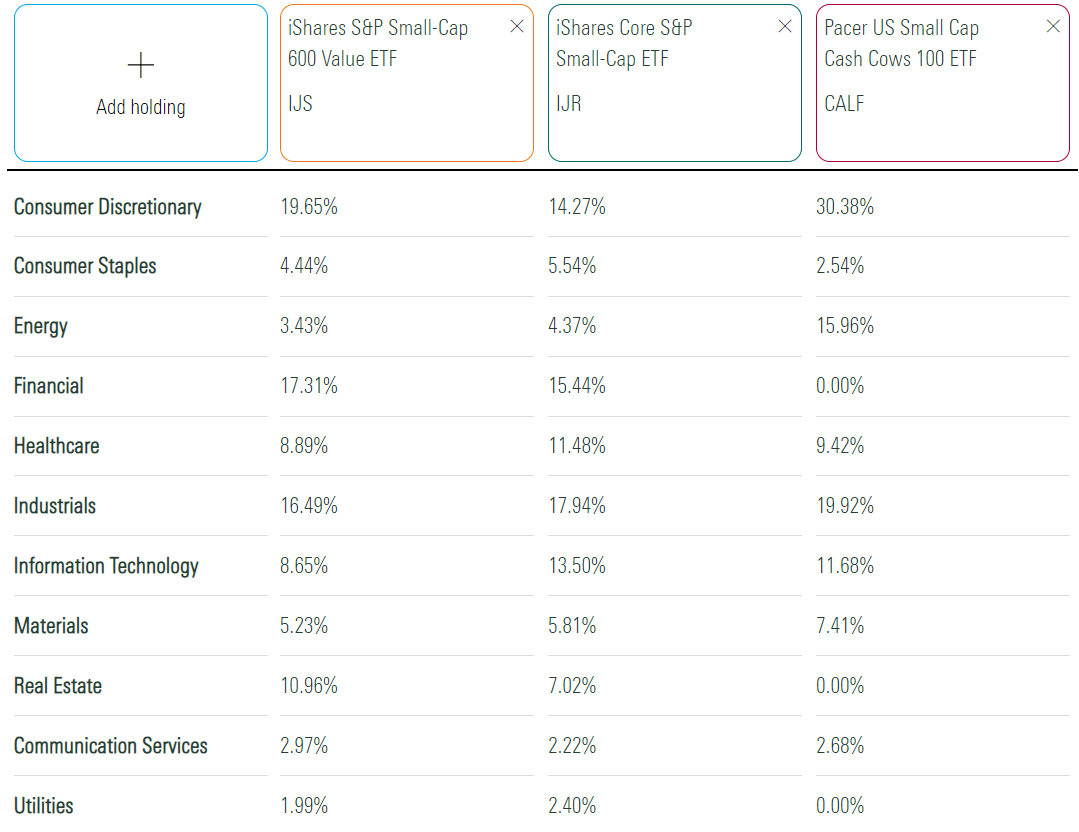
The following table highlights sector exposures for CALF, IJS, and IJR. Currently, the ETF overweights Consumer Discretionary (30%), Energy (16%), and Industrials (20%). Energy increased by 6% with the latest reconstitution, as the sector generally underperformed once oil prices retreated.
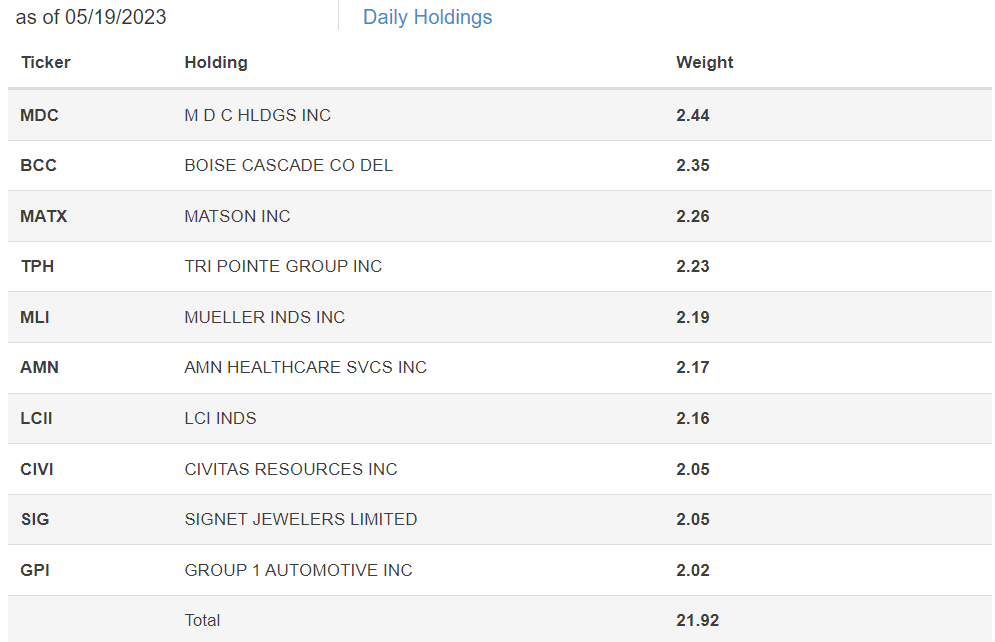
CALF's top ten holdings are below, led by MDC Holdings ( MDC ), Boise Cascade ( BCC ), and Matson ( MATX ). Civitas Resources ( CIVI ) is the lone Energy stock with a weighting above 2%, signifying excellent performance, since it beat analyst GAAP earnings expectations by 28% this quarter.
Industry Fundamentals
Before we look at industry-level fundamentals, here is a snapshot of how things looked in January.
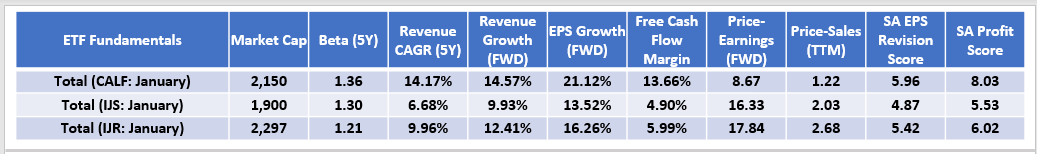
These statistics suggest CALF was set to perform well in various environments. In addition to solid valuation and profitability, CALF had much higher sales and earnings growth rates and a better Seeking Alpha EPS Revision Score, a good gauge of market sentiment. The higher beta was the primary concern, but the odds were in CALF's favor.
Now, I'd like you to evaluate the same metrics for CALF's top 25 industries, with summary metrics for CALF, IJS, and IJR in the final rows.
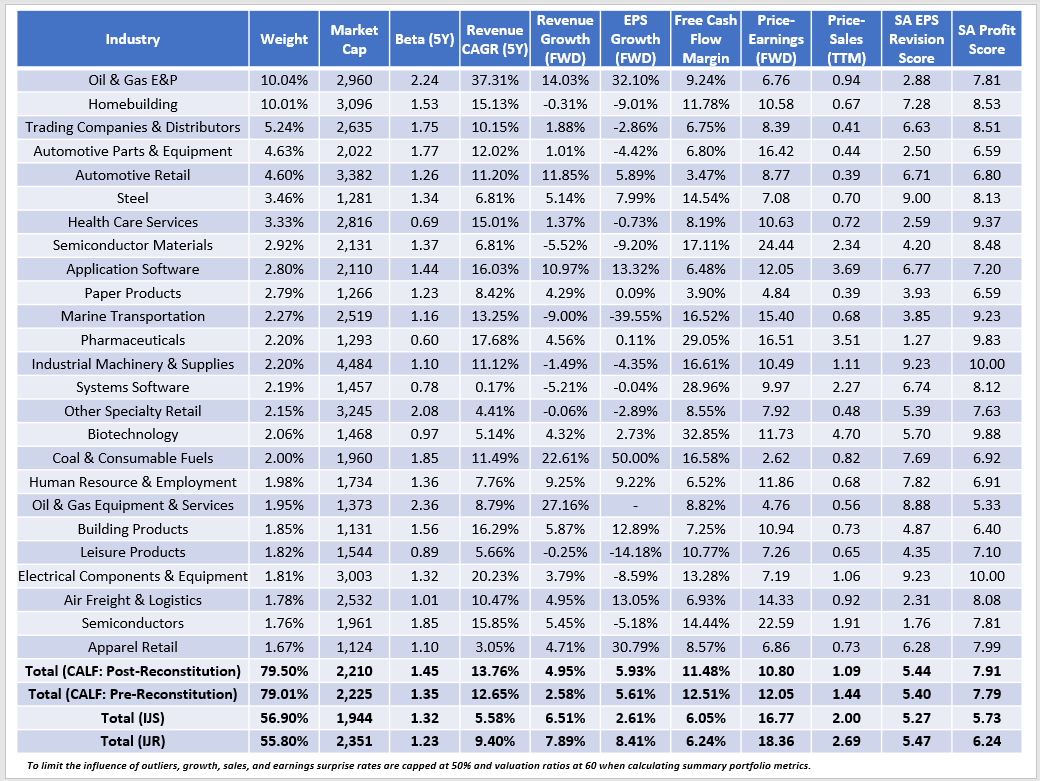
I mentioned the higher volatility before, but notice the massive change in CALF's estimated sales and earnings growth rates relative to IJS and IJR. On earnings, estimates dropped from 21.12% to 5.93%, and the figure is now below IJR's. We see similar results on the sales side. The takeaway is that good growth is not a byproduct of CALF's selection process. It's surprising how inconsistent it is.
The table above illustrates some of the problem growth areas. Nearly all the leading industries have low or negative estimated earnings growth rates, including Homebuilding, Trading Companies & Distributors, and Automotive Parts & Equipment. Consider these four examples from CALF's top ten list:
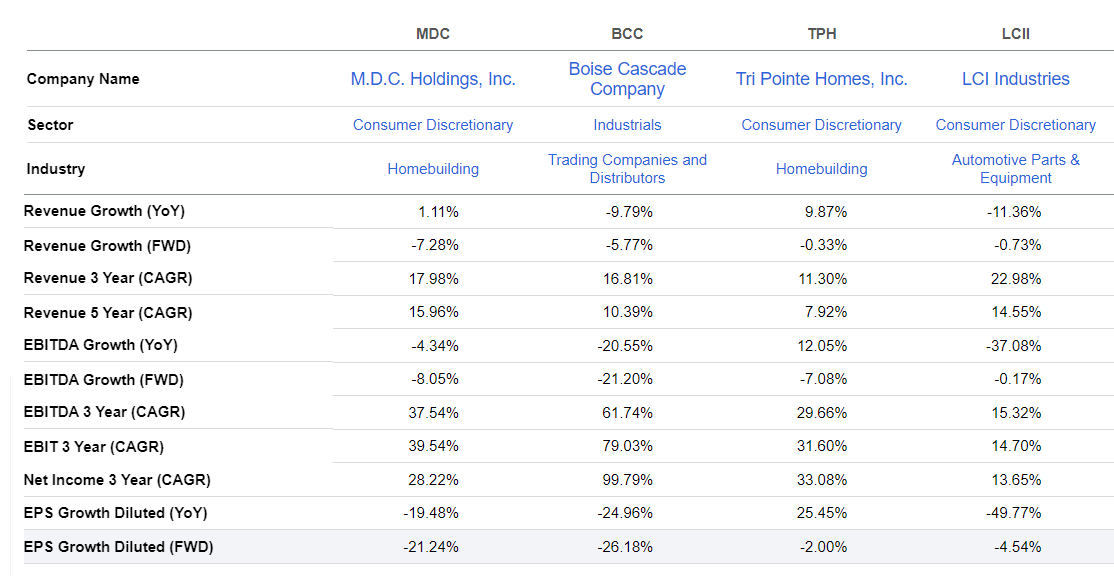
All have negative estimated sales and earnings growth for the next year. That's not to say we should avoid them. MDC Holdings was spent eight months in the Hoya Capital Focused Income Portfolio between August 2022 and April 2022, capturing nearly 9% upside, while the SPDR S&P Homebuilders ETF ( XHB ) was flat. However, the initial reason to buy was not based on free cash flow yield. Instead, Hoya relied on multiple factors, including MDC's:
- Land-heavy strategy in the West Coast and Sunbelt, where prices are high.
- Long-term mortgage rate trends, since its 68% Debt Ratio is elevated.
- Steep discount to tangible book value.
Both MDC Holdings and Tri Pointe Homes are priced close to fair value, according to Hoya Capital Income Builder Rankings. As discussed earlier, I think this multi-factor approach should produce more reliable results.
Investment Recommendation
CALF has an advantage over any small-cap fund I've encountered: high profitability. I attribute this to its free cash flow focus, which requires a positive consensus forecast for the next two years. The free cash flow yield screen drives down its valuation, and these two factors are constantly hit with each quarterly reconstitution. The tradeoffs are higher volatility and inconsistent sales and earnings growth. Earnings surprises and earnings momentum scores can vary, too, but that is true for most rules-based funds. Over the long run, it's better than plain-vanilla choices like IJS and IJR.
While I don't often provide bullish ratings on small-cap ETFs, I made an exception in January because CALF's fundamentals were excellent all-around. Its estimated growth rates and earnings revision scores were substantially more than IJS and IJR, and CALF maintained attractive profitability and valuation as usual. Unfortunately, that margin of safety disappeared this quarter, and CALF is now at risk of analyst downgrades based on low growth expectations for its key industries. Therefore, I've decided to downgrade CALF from a buy to a hold, and I look forward to discussing this and other small-cap ETFs with you in the comments section below. Thank you for reading.
For further details see:
CALF: Small-Cap Cash Cows Grapple With Slow Sales And Earnings Growth