CAMT - Camtek Has Room To Go Lower
Summary
- CAMT is almost certain to end FY2022 with earnings at record highs, but a looming downturn has nonetheless weighed on the stock.
- The charts suggest the stock has room to go lower, even though it has already lost half its value in 2022.
- CAMT may seem like a bargain after the price drop, including with multiples lower than competitors, but the stock may be more expensive than it looks.
- The industry outlook is too hazy at this time to make accurate predictions, which argues in favor of playing it safe.
Camtek ( CAMT ), a supplier of metrology and inspection equipment and software for the semiconductor industry, has had a good year in 2022 from a business standpoint. However, the same cannot be said of the stock. Revenue has hit a record high, but the stock is nonetheless on track to end the year with a loss of 50%. In addition, there is reason to believe CAMT has not seen the last of its struggles, but is only about to enter a difficult period, which could drive the stock lower. Why will be covered next.
I have written about CAMT before, so you can view this article as an update of my prior coverage:
Camtek Is Optimistic And Cautious At The Same Time
Camtek Is In Rebounding Position
The charts suggest there is room for the stock to go lower
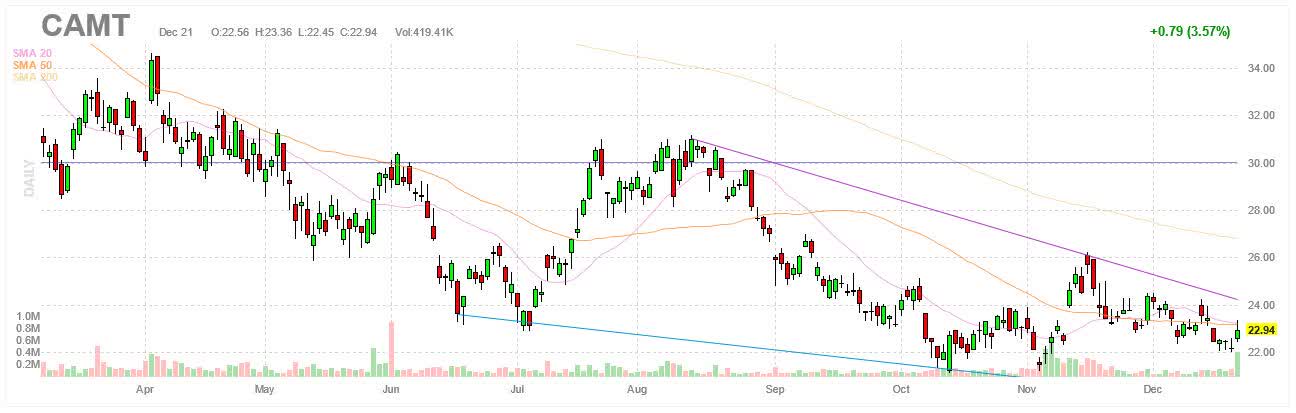
The year 2022 might have been a record-setting year for CAMT, but you wouldn't be able to tell from how the stock has performed. The stock has lost 50% or half its value YTD. In comparison, the iShares PHLX Semiconductor ETF ( SOXX ) has lost 33% YTD. CAMT has thus underperformed compared to most semiconductor stocks. The chart below shows how the stock has tacked on losses throughout the year.
The stock has trended down with lower lows and lower highs. The stock has done better in the last few months as the rate of decline has slowed down and the stock has bounced off the lows. Nevertheless, the downtrend is still in effect and the chart patterns are still leaning to be bearish side. Furthermore, the stock seems to have broken support at a key level.
The stock bounced after hitting what was then the low of the year at $23.11 or $22.89 if intraday lows are included on July 6. It's worth mentioning that using the uptrend starting from the March 2020 low of $6.27 and the November 2021 high of $49.60, the 61.8% Fibonacci retracement level is at $22.82, which is just $0.07 below the July 2022 low at $22.89. In other words, the stock was able to find support at the 61.8% Fibonacci retracement level in July, which paved the way for the subsequent bounce.
However, the bounce did not last and the stock proceeded to drop to new lows, all of which came in below what appeared to be support at $22.82. For instance, the stock hit the low of the year on November 3 at $21.46. If intraday lows are included, then the low is $21.13, set on October 13. CAMT managed to rally after that, making it all the way back to as high as $26.25, but it has since reversed course once again.
The stock has been going sideways in recent days and it has yet to match the lows of the year in the $21.00-21.50 region. But if the stock gets back to this region and it does not find support in this region, the stock could be heading for the 76.4% Fibonacci retracement level, which is at $16.50. While $16.50 may seem far away, the stock was there as recently as October 2020. This also shows how much the stock has soared higher in the last two years to be still sitting on substantial gains after the price of the stock has been cut in half. It also suggests there is room for the stock to cede more ground.
The outlook for CAMT is hazy
The current trend in the charts suggests to expect lower stock prices. In addition, the case for lower stock prices is strengthened by a semiconductor market that is getting weaker. For instance, according to the latest projections from WSTS, the semiconductor market is expected to contract by 4.1% in 2023 after expanding by 4.4% YoY to $580B in 2022. In contrast, the market expanded by 26.2% YoY in 2021.
This slowdown is expected to have a negative impact on the market for semiconductor manufacturing equipment with chipmakers cutting back on capex spending. According to a recent forecast from SEMI, the equipment market is projected to grow by 5.9% YoY to a record $108.5B in 2022, breaking the old high of $102.5B set one year earlier in 2021.
Still, it's a major slowdown from 2021 when the market grew by a whopping 44% YoY. More significantly, the market is forecast to contract by 15.9% YoY to $91.2B in 2023. It's also worth mentioning that as recently as mid-July, the forecasts were calling for the market to grow by 14.7% YoY to $117.5B in 2022 and by 2.8% YoY to $120.8B in 2023. Forecasts have been revised lower. In the case of 2023, the size of the market has been lowered by almost $30B, a big difference. Further revisions are possible.
CAMT's own outlook acknowledges a slowdown is coming, even though the most recent quarterly report recorded new highs. Q3 revenue increased by 16% YoY to $82M, a record high. GAAP EPS increased by 4.9% YoY to $0.43 and non-GAAP EPS increased by 6.7% YoY to $0.48. The table below shows the numbers for Q3 FY2022.
Note that EPS gains were less than those for net income due to share dilution. The GAAP weighted-average of shares outstanding rose to 48.31M in Q3 FY2022, up from 44.66M in Q3 FY2021. CAMT finished with cash, cash equivalents and short-term investments of $392.2M on its balance sheet.
| (GAAP) |
| Q3 FY2022 |
| Q2 FY2022 |
| Q3 FY2021 |
| QoQ |
| YoY |
| Revenue |
| $81.990M |
| $79.578M |
| $70.686M |
| 3.03% |
| 15.99% |
| Gross margin |
| 48.6% |
| 50.5% |
| 50.6% |
| (190bps) |
| (200bps) |
| Operating profit |
| $20.636M |
| $20.875M |
| $20.145M |
| (1.14%) |
| 2.44% |
| Net income |
| $20.715M |
| $19.183M |
| $18.505M |
| 7.99% |
| 11.94% |
| EPS |
| $0.43 |
| $0.40 |
| $0.41 |
| 7.50% |
| 4.88% |
| (Non-GAAP) |
| Revenue |
| $81.990M |
| $79.578M |
| $70.686M |
| 3.03% |
| 15.99% |
| Gross margin |
| 49.0% |
| 50.9% |
| 50.9% |
| (190bps) |
| (190bps) |
| Operating profit |
| $23.196M |
| $23.802M |
| $21.657M |
| (2.55%) |
| 7.11% |
| Net income |
| $23.275M |
| $22.110M |
| $20.017M |
| 5.27% |
| 16.28% |
| EPS |
| $0.48 |
| $0.46 |
| $0.45 |
| 4.35% |
| 6.67% |
Source: CAMT
Guidance calls for FY2022 revenue of around $320M, which implies growth of 18.7% YoY with FY2021 revenue of $269.7M. In comparison, FY2021 revenue grew by an impressive 73% YoY. It also implies Q4 FY2022 revenue of $81.3M since revenue in Q1-Q3 was $238.7M. In comparison, revenue in Q4 FY2021 was $74.2M, which implies a YoY increase of 9.6% in Q4 FY2022, less than the average for the year. Things are slowing down.
Guidance did not extend into 2023, but management suggested to be prepared for a further deterioration in quarterly results. From the Q3 earnings call:
"The global economy is projected to decline in 2023, and expected to affect both wafer fab equipment in general and even more so in the Memory segment. 2023 is expected to be a challenging year for the industry with customers being more cautious. We believe that although Camtek's business model is not immune, it is however more resilient."
A transcript of the Q3 FY2022 earnings call can be found here .
Current valuations may not tell the whole story
Consensus estimates expect CAMT to post GAAP EPS of $0.44 in Q4 and $1.65 for all of FY2022. CAMT trades at 13.4 times forward GAAP earnings with a trailing P/E of 14.8. That is less than ONTO and KLAC, two prominent players in metrology, even if there are differences between them. The table below shows some of the multiples CAMT trades at.
| CAMT |
| ONTO |
| KLAC |
| Market cap |
| $983.12M |
| $3.42B |
| $54.69B |
| Enterprise value |
| $786.32M |
| $2.89B |
| $58.16B |
| Revenue ("ttm") |
| $312.9M |
| $977.6M |
| $9,852.5M |
| EBITDA |
| $83.3M |
| $295.4M |
| $4,324.0M |
| Trailing GAAP P/E |
| 14.80 |
| 16.88 |
| 17.51 |
| Forward GAAP P/E |
| 13.44 |
| 16.09 |
| 16.68 |
| PEG ratio |
| 0.77 |
| 0.22 |
| 0.70 |
| P/S |
| 3.15 |
| 3.50 |
| 5.79 |
| P/B |
| 2.73 |
| 2.18 |
| 26.02 |
| EV/sales |
| 2.51 |
| 2.95 |
| 5.90 |
| Trailing EV/EBITDA |
| 9.44 |
| 9.77 |
| 13.45 |
| Forward EV/EBITDA |
| 8.20 |
| 9.35 |
| 12.94 |
Source: Seeking Alpha
However, the forward multiples suggest earnings expectations may be too high. The forward multiples are only slightly less than the trailing ones, which imply earnings are not expected to decline all that much in 2023 compared to 2022 when earnings reached record highs. This may prove to be hard to achieve if the semiconductor market continues to slow down like has in recent months and companies are forced to reduce investments in new equipment.
CAMT earned $1.34 in FY2021 and it's expected to earn $1.65 in FY2022, but it's worth pointing out that these numbers are very much the exception. CAMT only earned a combined $2.13 in FY2011-2020, which means CAMT has earned much more in FY2021-2022 with $2.99 than it did in the ten preceding years combined.
The average GAAP EPS is about $0.21, the last two years excluded. If earnings reverts to this historical average due to an industry downturn or whatever, then CAMT may actually be a lot more expensive than it looks with a forward multiple of 13.4. Earnings of $0.21, for instance, imply a forward multiple in the triple digits. So while current multiples may not look so bad, they may not be an accurate representation of the state of affairs, depending on the severity of the upcoming downturn.
Investor takeaways
I remain neutral on CAMT as stated in a previous article . Some may argue in favor of long CAMT with earnings at record highs and multiples lower than the competition. The stock price has been cut in half and some may see CAMT as a bargain, especially with the stock no longer falling the way it used to earlier in the year.
However, the industry is heading for a downturn with the market expected to contract in 2023. Whether CAMT is really a bargain with multiples where they are depends on how severe the downturn turns out to be. There are some who predict a short one with semiconductor demand expected to improve as soon as the second half of 2023, but these forecasts may turn out to be too optimistic.
If the downturn lasts longer than currently expected and earnings revert back to something more in line with the historical average, CAMT may still be too expensive at current valuations. The charts also suggest lower stock prices are in the pipeline with the stock still sitting on a big chunk of the gains made in the last two years when earnings were outstanding, but not representative of what CAMT has done in most years.
Bottom line, much depends on how the coming downturn develops. CAMT is priced for a relatively shallow one, which may turn out to be correct, but could also be way off. It would not be prudent to take bets as to which of the two outcomes is the right one. Standing on the sidelines is the way to go for now.
For further details see:
Camtek Has Room To Go Lower