CAMT - Camtek Seems To Have Tipped Over
2023-03-13 13:47:51 ET
Summary
- CAMT has done well recently with the stock outperforming most, but the stock looks to be heading lower after losing support.
- CAMT is coming off a record-setting year, but the quarterly numbers are now expected to decline due to weaker market demand.
- Expectations are that the downturn will be short and relatively shallow, but there’s the risk these projections may have to be revised.
- Some may want to take the risk, but others are more likely to play it safe by not assuming forward projections are always accurate.
It took a while, but it seems Camtek (CAMT), a supplier of metrology, inspection equipment and related software for the semiconductor industry, has decided a change in direction is needed. The stock has fallen below support, in effect breaking the stalemate that had kept the stock sideways in recent weeks. Why will be covered next.
The stock loses support
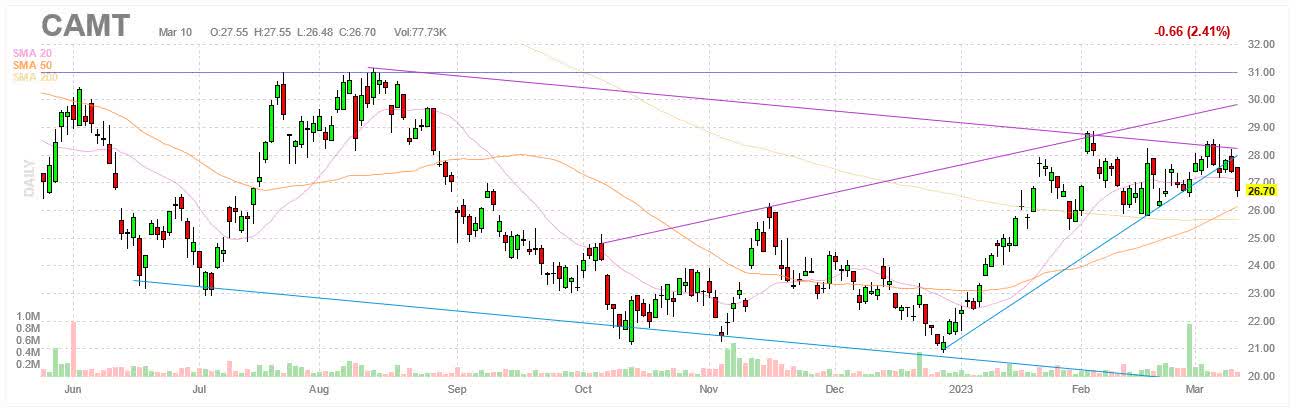
It’s been a pretty good year thus far for CAMT. The stock has gained 21.6% YTD. In comparison, the iShares PHLX Semiconductor ETF ( SOXX ) has gained 16.4% YTD and the SPDR S&P 500 ETF ( SPY ) has gained just 0.9% YTD. Nevertheless, it’s worth pointing out that the gains came in the first month of the year with the stock closing as high at $29.79 on February 2. The stock has since struggled to go any higher as shown in the chart below. It’s been basically sideways since early February.
Furthermore, the stock appears to have lost support, which had kept the stock afloat and which could pave the way for a bigger drawdown. Note the ascending trendline starting from the beginning of 2023. The stock respected the boundaries set by this trendline, in effect forcing the stock higher. That is until a couple of days ago when the stock finally managed to break through the trendline after several weeks of unsuccessful attempts to break support.
With support now lost, the stock may be going for a retest of the recent lows. The stock could be heading for the $21-22 region, the same region where the stock was able to rebound on three separate occasions in the fourth quarter of 2022, including as recently as December 28. The stock closed at $21.24 on that day, but if intraday lows are included, the bottom was $20.83 for a 52-weeks low.
The stock is currently at $26.70, which means the stock would have to lose at least another 17-18% to get back to the $21-22 region. Keep in mind that CAMT ended 2022 at $21.96, which means the stock would be back to square one having lost pretty much all gains for the year. The stock was able to find support three times before in the $21-22 region to power a turnaround, so odds are the stock will be able to do so once more.
On the other hand, it’s worth mentioning that the stock could still be in the larger downtrend that goes back all the way to last year. The downtrend is marked by lower lows and lower highs, which suggests it is possible the stock could go for a new low, below the most recent one on December 28, before the stock can be expected to reverse course.
What could drive the stock lower
CAMT serves the semiconductor market and this market is currently faced with declining demand after several years of booming demand. In turn, a number of chip suppliers have cut back on production output in the face of slumping demand for chips. There is less appetite or need for new production capacity as a consequence, which in turn is expected to lead to a contraction in the market for semiconductor manufacturing equipment.
Recent forecasts predict this as much. For instance, a recent forecast from SEMI sees the wafer fab equipment or WFE market falling by 16.8% YoY to $78.8B in 2023, a year after it grew by 8.3% YoY to $94.8B in 2022, which is a record high. At the same time, SEMI expects the market to return to growth as soon as 2024 with a projected increase of 17.2% YoY to $92.4B, which is close to the 2022 record high. Keep in mind that others are more pessimistic than SEMI. Some projections, for instance, call for the WFE market to shrink by 20-30%.
The latest guidance from CAMT suggests the downturn is underway. The forecast calls for Q1 FY2023 revenue of $71-74M, a decline of 11.8% QoQ and 6.1% YoY at the midpoint. CAMT expects lower margins, which implies lower earnings. From the Q4 earnings call:
“Moving to the guidance, in Q1, we expect revenue in the range of $71 million to $74 million. Our gross margin is affected by the business volume and the increase in the bill of material resulting from the supply chain issues, inflation and labor cost. We, therefore expect gross margin to be around 48% in Q1.”
A transcript of the Q4 F2022 earnings call can be found here .
On the flip side, management expects to see a stronger second half than the first half.
“After three years in which the entire production supply chain was disrupted, 2023 is expected to be a challenging year with customers being more cautious and hesitant in increasing production capacity before receiving orders from their end user.
However, we are also receiving positive signal from several customers regarding expected improvement in the second half of 2023. We believe that our leading position in the specific segments, broad and diversified customer base and long-term strategic relationships with customers will enable us to again outperform the wafer fabrication equipment, which is predicted to decline by 20% to 30% in 2023.”
In addition, CAMT believes it will outperform the WFE market in 2023.
Accordingly, consensus estimates predict CAMT will post GAAP EPS of $0.36 and non-GAAP EPS of $0.41 on revenue of $72.4M in Q1. This represents the first sequential decline in quarterly revenue after 11 consecutive sequential increases in quarterly revenue. In comparison, the table below shows the quarterly numbers in previous quarters. The numbers steadily improved with Q4 FY2022 the record high, but they are now expected to deteriorate.
| (Unit: $1000, except EPS) |
| (GAAP) |
| Q4 FY2022 |
| Q3 FY2022 |
| Q4 FY2021 |
| QoQ |
| YoY |
| Revenue |
| 82,175 |
| 81,990 |
| 74,171 |
| 0.23% |
| 10.79% |
| Gross margin |
| 48.6% |
| 48.6% |
| 50.7% |
| - |
| (210bps) |
| Operating profit |
| 20,461 |
| 20,636 |
| 19,314 |
| (0.85%) |
| 5.94% |
| Net income |
| 21,673 |
| 20,715 |
| 12,760 |
| 4.62% |
| 69.85% |
| EPS |
| 0.45 |
| $0.43 |
| 0.28 |
| 4.65% |
| 60.71% |
| (Non-GAAP) |
| Revenue |
| 82,175 |
| 81,990 |
| 74,171 |
| 0.23% |
| 10.79% |
| Gross margin |
| 49.0% |
| 49.0% |
| 50.9% |
| - |
| (190bps) |
| Operating profit |
| 22,832 |
| 23,196 |
| 20,936 |
| (1.57%) |
| 9.06% |
| Net income |
| 24,044 |
| 23,275 |
| 19,687 |
| 3.30% |
| 22.13% |
| EPS |
| 0.50 |
| 0.48 |
| 0.43 |
| 4.17% |
| 16.28% |
Source: CAMT
Estimates predict CAMT will finish FY2023 with non-GAAP EPS of $1.57-1.71 on revenue of $275.5-296.0M, which represent YoY declines of 9.0-16.5% and 7.8-14.2% respectively. On the other hand, CAMT is expected to rebound the following year. Estimates predict non-GAAP EPS of $1.60-2.00 on revenue of 300.0-337.8M in FY2024.
In comparison, the table below shows the numbers for FY2021 and FY2022. In a nutshell, the numbers are expected to take a dip in FY2023, but the downturn is not expected to last very long with CAMT predicted to come close to matching the record highs reached in FY2022 as soon as FY2024.
| (Unit: $1000, except EPS) |
| (GAAP) |
| FY2022 |
| FY2021 |
| YoY |
| Revenue |
| 320,909 |
| 269,659 |
| 19.01% |
| Gross margin |
| 49.8% |
| 50.9% |
| (210bps) |
| Operating profit |
| 81,498 |
| 70,898 |
| 14.95% |
| Net income |
| 79,949 |
| 60,277 |
| 32.64% |
| EPS |
| 1.66 |
| 1.34 |
| 23.88% |
| (Non-GAAP) |
| Revenue |
| 320,909 |
| 269,659 |
| 19.01% |
| Gross margin |
| 50.2% |
| 51.2% |
| (100bps) |
| Operating profit |
| 92,021 |
| 76,713 |
| 19.95% |
| Net income |
| 90,472 |
| 71,397 |
| 26.72% |
| EPS |
| 1.88 |
| 1.59 |
| 18.24% |
Source: CAMT
CAMT is neither expensive nor cheap
The table below shows some of the multiples CAMT trades at. In general, multiples are currently significantly lower than they have been on average in recent years. Furthermore, CAMT also compares well to most in the sector with many multiples below the median. For instance, CAMT has a market cap of $1.19B, which includes $479M in cash, cash equivalents and short-term deposits on the balance sheet, and it trades at 18.1 times forward GAAP earnings with a trailing P/E of 16.1, both below the median or the 5-year average. CAMT looks like a long from this standpoint.
| CAMT |
| Sector median |
| 5-year average |
| Market cap |
| $1.19B |
| - |
| - |
| Enterprise value |
| $981.91M |
| - |
| - |
| Revenue ("ttm") |
| $320.9M |
| - |
| - |
| EBITDA |
| $84.3M |
| - |
| - |
| Trailing GAAP P/E |
| 16.08 |
| 22.28 |
| 30.33 |
| Forward GAAP P/E |
| 18.14 |
| 24.39 |
| 21.36 |
| PEG GAAP |
| 0.68 |
| 0.63 |
| - |
| P/S |
| 3.67 |
| 2.56 |
| 4.32 |
| P/B |
| 3.09 |
| 2.80 |
| 4.06 |
| EV/sales |
| 3.06 |
| 2.64 |
| 3.81 |
| Trailing EV/EBITDA |
| 11.65 |
| 13.34 |
| 20.32 |
| Forward EV/EBITDA |
| 13.47 |
| 12.81 |
| - |
Source: SeekingAlpha
However, it’s worth mentioning that the multiples assume the downturn in the market will be a short and shallow one. While that is the current consensus, it’s possible the downturn could be more severe and last a lot longer than anticipated. Historical precedent favors the latter. If this happens, earnings expectations will have to be revised, which will affect multiples.
It’s also worth mentioning that multiples have benefited from the earnings boom in the past two years. Before that, earnings at CAMT were much less, which helps explain why multiples are currently so much lower than the 5-year average as multiples used to be much higher in prior years. For example, CAMT posted GAAP EPS of $1.66 in FY2022 and $1.34 in FY2021 as shown earlier
In contrast, total EPS amounted to just $2.13 in the 10 preceding years in FY2011-2020, which is a lot less than the $3.00 earned in FY2021-2022. In other words, earnings have been very much atypical in the last two years. Expectations are that EPS won’t decline all that much, but if EPS were to decline more than expected due to a worse-than-expected downturn, in line with the historical average, CAMT may in reality be a lot more expensive than the current multiples suggest it is.
Investor takeaways
It should be noted that CAMT serves a specific niche in the market for semiconductor equipment. It’s thus possible that CAMT will do better than others. Advanced packaging seems to be doing better than others and this could make a difference for CAMT. Just because the overall market is in bad shape does not mean CAMT has to do as bad. CAMT has a shot at outperforming.
Having said that, I am neutral on CAMT due to the uncertainty associated with the outlook. The current consensus is that the current downturn will not last long with a possible rebound as soon as H2 2023. As a result, consensus estimates see a relatively modest decline in the high single digits to mid-teens in the top and the bottom line for FY2023. Note that is in comparison to FY2022 when both soared higher to record highs.
Furthermore, the numbers are expected to get close to the records set in FY2022 as soon as FY2024. In other words, the current downturn is expected to be a short and a relatively modest one. However, it’s possible this outlook may be too optimistic. The reality is that the numbers peaked in Q4 FY2022 and the question is how far downhill CAMT has to go. The expectations are not very far, but there are no guarantees this is correct. Revisions are possible and that could drive the stock lower.
The charts also suggest the stock is most likely heading lower before it has a shot at reversing course and going higher. The stock lost the support that had kept the stock going higher for much of 2023. Odds are the stock is heading back to the next line of support, which is probably in the $21-22 region. This suggests the stock needs to fall by another 17-18%, which argues in favor of staying clear of CAMT for now.
Bottom line, the argument in favor of long CAMT is not without some merit, but the case against it seems to be stronger. Some may be willing to accept the risk and bet that the current downturn will be over fairly quickly. Others, on the other hand, are likely to conclude that it is better to not take any unnecessary risks associated with predictions that can be very much hit or miss. Caution is warranted.
For further details see:
Camtek Seems To Have Tipped Over