RSHPF - Canadian Apartment Properties: Keep Your Stick On The Ice
2023-12-19 01:55:58 ET
Summary
- Canadian Apartment Properties REIT (CAPREIT) is Canada's largest residential REIT, owning over 57,600 residential suites and manufactured housing community sites across Canada.
- It also holds a ~65% stake in European Residential REIT and a ~19% stake in Irish Residential REIT.
- The consolidation of ERE obscures the performance of the core Canadian portfolio in headline metrics, so we perform a deep dive to assess both companies on a standalone basis.
- We like the company, and see benefits to a deep understanding of its core Canadian assets and ERE, but need a pullback to give a Buy rating.
Summary
Canadian Apartment Properties REIT ( CAR.UN:CA ) is Canada's largest residential REIT. It is also the majority owner and external manager for European Residential REIT ( ERE.UN:CA ). We like CAPREIT's management and portfolio, and we believe that our understanding of its core Canadian portfolio and ERE could yield opportunities for interesting pair trades in the future. For now, we believe CAPREIT is trading at a slight discount to NAV, though we need to see a lower unit price before giving a Buy rating.
History
CAPREIT was founded in 1997 and has grown to become Canada's largest residential REIT. It owns ~57,600 residential suites and manufactured housing community ("MHC") sites across Canada and controls a further ~6,900 residential suites in the Netherlands through its ~65% stake in ERE. Further details about CAPREIT's role in forming ERE can be found in our recent report . For this report, it is essential to note that CAPREIT consolidates ERE in its financials, though it adjusts for the 35% NCI in its NAV, FFO, and ACFO calculations. We have made an effort to treat CAPREIT's core Canadian portfolio separately from ERE, as we have already done our diligence and valuation work on these assets independently from CAPREIT.
In addition to ERE, CAPREIT owns ~19% of Irish Residential Properties ( RSHPF ). The relationship between CAPREIT and IRES began with an agreement entered on November 24, 2014. This agreement, known as the Pipeline Agreement, allowed both companies to acquire properties from one another. CAPREIT was granted access to €150MM to acquire high-quality Irish properties, and IRES, upon sourcing funding, had the opportunity to acquire properties from CAPREIT. The agreement was subject to terms including the approval of IRES shareholders and was linked to an existing Investment Management Agreement between IRES and CAPREIT IRES Fund Management Limited. Additionally, CAPREIT was selected as a preferred bidder to acquire properties in Dublin, Ireland, around the same time?.
In March 2021, CAPREIT announced that its wholly-owned subsidiary, IRES Fund Management Limited, had provided a twelve-month notice of termination of its management agreement with IRES. This management agreement, which involved providing IRES asset and property management services, was set to become effective from March 31, 2022. The agreement had originally been for five years, expiring on November 1, 2020, and then rolled over for another five-year term unless terminated earlier by either party. Despite the termination notice, CAPREIT continues to hold an ~18.8% stake in IRES.
Recently, CAPREIT has been actively engaged in a capital recycling and NCIB program (collectively called "Strategic Initiatives"). YTD, it has acquired 5 properties for ~$208MM and disposed of ~$355MM worth of non-core assets. Since Q4 '21, it has reduced the total unit count by 3.4% (n.b., ~6MM net units cancelled). Unit repurchases under the NCIB during this period have been executed at around ~$46 per unit.
Portfolio Snapshot
CAPREIT's Canadian residential portfolio comprises 45,440 suites, primarily located in Ontario (n.b., ~49% of Canadian suites and ~53% of Q3 '23 segment NOI). Quebec and BC are the REIT's second and third largest markets (n.b., ~19% and ~16% of segment NOI, respectively). Nova Scotia, Alberta, PEI, and Saskatchewan comprise the rest of the Canadian residential portfolio.
CAPREIT also owns 12,125 MHC sites across Canada (n.b., ~7% of Canadian NOI) and consolidates ERE's 6,896 residential suites and ~451k sqft of commercial GLA.
Portfolio Snapshot (Empyrean; CAPREIT)
Since Q4 '21, the total consolidated suite/site count has declined ~3% as Canadian residential suites and MHC sites have declined ~4% and ~3%, respectively, while ERE's suite count has grown ~5%.
Canadian residential AMR has grown at a 6.3% CAGR over this period, and MHC AMR grew at 3.1% (n.b., 4.9% CAGR on total Canadian AMR). ERE's Netherlands residential portfolio AMR declined at a 13.4% CAGR in CAD terms, though it grew at 7.5% in EUR terms.
Occupancy across the portfolio has remained stable and extremely high over this period. YTD average occupancies for the Canadian residential, MHC, and ERE portfolios are ~99%, ~96%, and ~99%, respectively.
Recent Performance
Earnings and Cash Flow Evolution
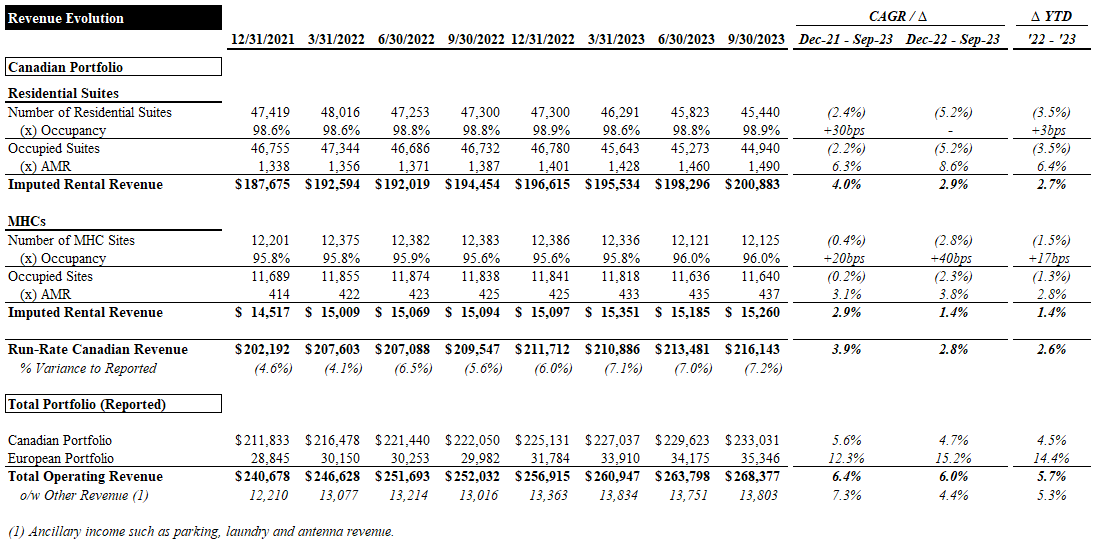
In this section, we unpack the drivers of CAPREIT's earnings and cash flow evolution from year-end '21 to Q3 '23. In the table below, we imputed CAPREIT's rental revenue for its Canadian residential and MHC portfolios based on its suite/site count, average monthly rent ("AMR"), and occupancy.
As shown in the table below, CAPREIT's consolidated revenue has grown at a ~6% CAGR over this period (n.b., ~6% growth from '22 to '23 YTD). With occupancy essentially flat across the Canadian portfolio, strong AMR growth has more than offset net suite/site dispositions, resulting in a ~6% CAGR (n.b., ~5% growth from '22 to '23 YTD), approximately half the rate of the European portfolio. It is also worth noting that ancillary revenue (n.b., parking, laundry, and antenna revenue) grew at a ~7% CAGR, ~90bps higher than total consolidated revenue.
Our key takeaway from this analysis is that CAPREIT's reported revenue figures have been skewed favorably by the consolidation of ERE. Although the Canadian portfolio has performed slightly worse than indicated by the reported figures, it has still been quite strong.
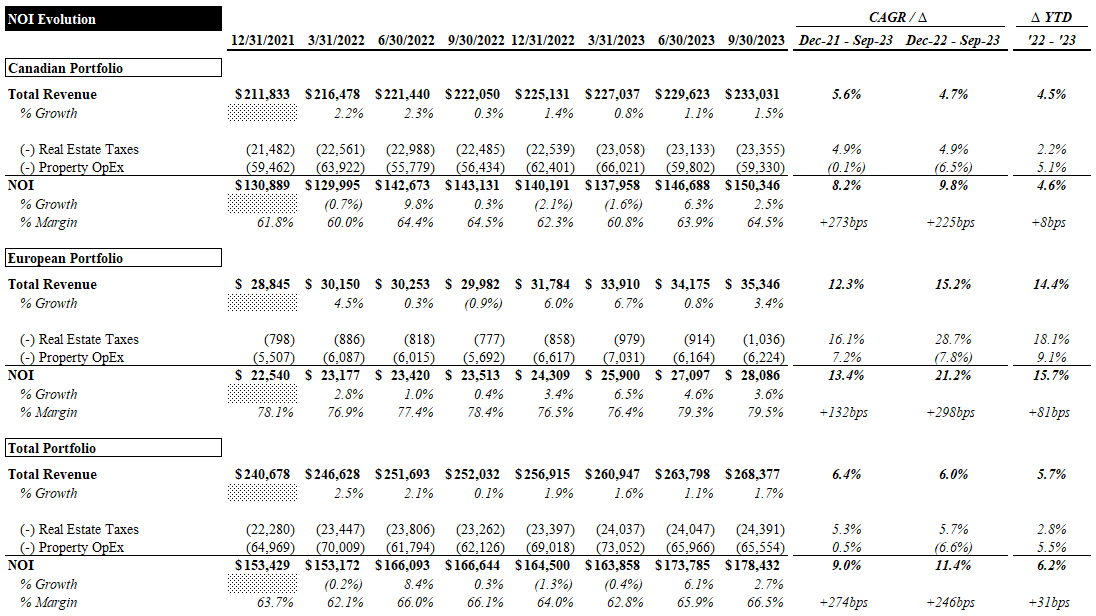
Next, we consider CAPREIT's NOI evolution. CAPREIT's ~9% consolidated NOI CAGR over the period was ~350bps higher than total revenue as margins expanded by ~270bps. As with revenue, ERE significantly outperformed the Canadian portfolio with ~16% NOI growth YTD (vs ~5% for the Canadian portfolio). NOI margins were flat for the Canadian portfolio, as property opex kept pace with revenue (n.b., likely due to the tight linkage between regulated rent increases and CPI inflation) while expanding ~80bps YTD for ERE.
Our key takeaways from this analysis are that the consolidation of ERE has, again, slightly skewed the headline NOI figures positively and that rent control in key Canadian markets makes it difficult to realize outsized NOI growth.
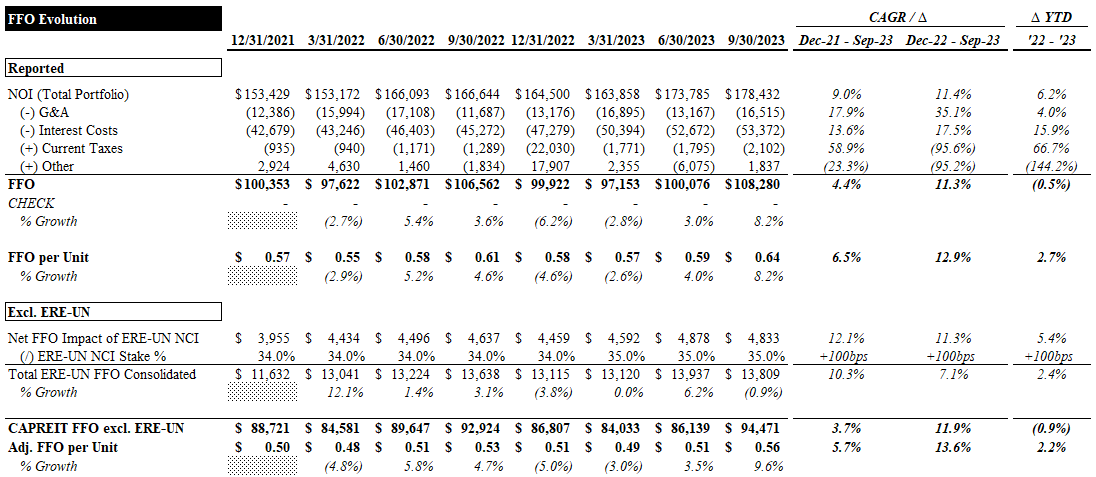
Next, we turn to FFO and AFFO as our preferred cash flow metrics. YTD, reported FFO has declined ~1% YoY as rising interest costs and current taxes outweighed NOI growth and positive operating leverage on G&A. The declining unit count due to activity on the NCIB contributed to a ~3% increase in FFO per unit.
The reported FFO figures remove the NCI's share of ERE's FFO contribution. Fully excluding ERE, FFO has declined ~40bps more than the reported figures (n.b., 2.2% increase on a per unit basis, ~50bps lower than reported).
Our key takeaway from this analysis is the same as the previous two: ERE has positively skewed the reported FFO growth over this period.
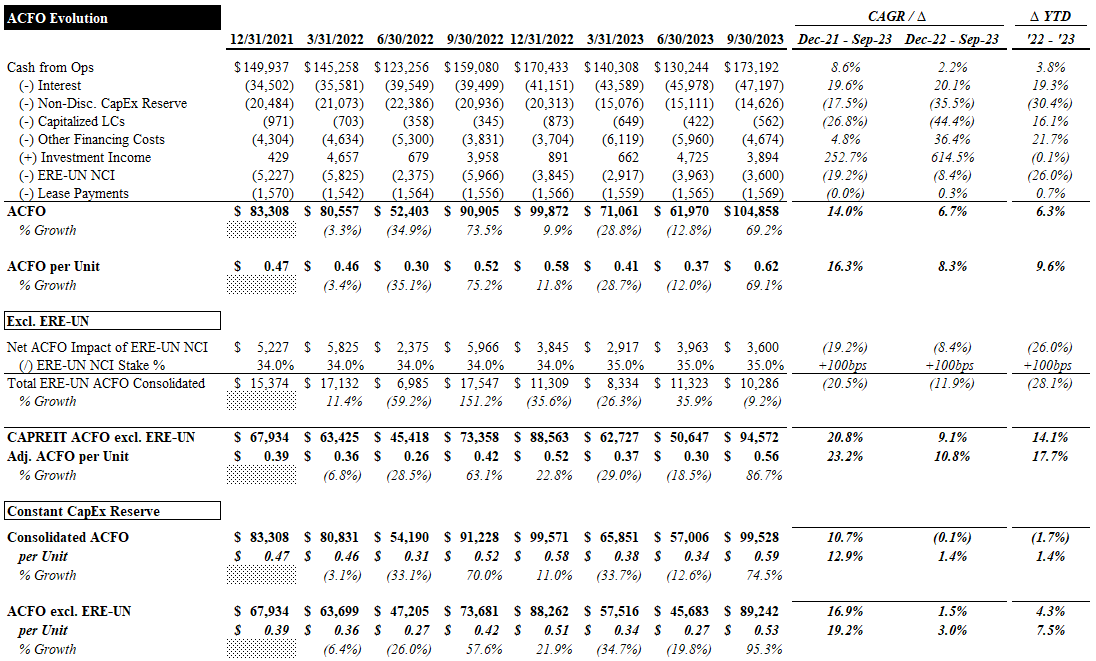
Rather than AFFO, CAPREIT reports Adjusted Cash Flow from Operations ("ACFO"). While AFFO is a cash flow proxy metric that adjusts FFO for certain line items (e.g., maintenance/non-discretionary capex, leasing costs, etc.), ACFO starts from cash flow from operations and makes similar, though sometimes broader, adjustments (e.g., working capital). While they strive to convey the same thing, differences in definition make this metric difficult to compare with other REITs' AFFO.
ACFO is up ~6% YTD, as significantly lower non-discretionary capex reserves have more than offset rising interest costs. On a per unit basis, ACFO is up ~10% YTD. Excluding ERE, ACFO is up ~14%, and ~18% on a per unit basis. This is the rare case where ERE has been a drag on the reported figures.
We saw a similar trend of declining capex reserves aiding ACFO/AFFO in ERE, and you can read our thoughts about this in our ERE report. We recast the ACFO figures (consolidated and excluding ERE), assuming CAPREIT applied the same non-discretionary capex per suite assumption throughout the period. Capex-adjusted ACFO declined ~2% and increased ~1% on a per unit basis. Excluding ERE, capex-adjusted ACFO would have grown ~4% and ~8% on a per unit basis.
As was our conclusion with this analysis for ERE, we do not think the declining capex reserves cover anything concerning (n.b., capex-adjusted ACFO payout ratio is still ~73%).
NAV Evolution
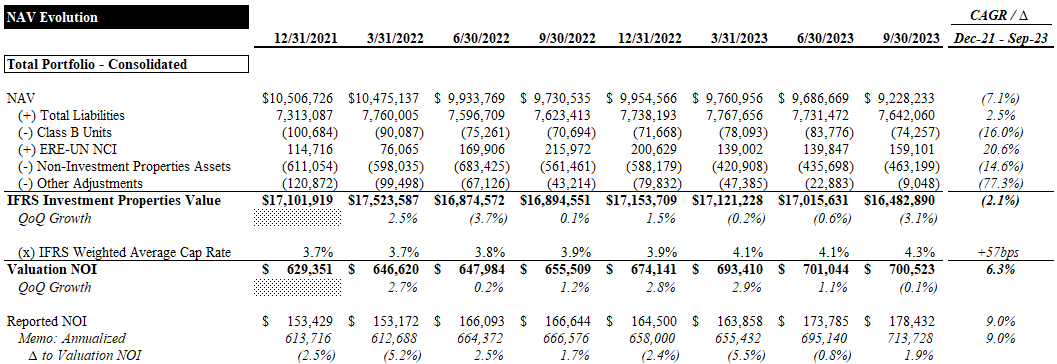
In this section, we unpack the drivers of CAPREIT's NAV evolution from year-end '21 to Q3 '23. As shown in the table below, CAPREIT's consolidated NAV has declined at a ~7.1% CAGR over this period (n.b., ~12% cumulative decline). Here, it is important to note that the Class B units are carried on the balance sheet as a liability (at market value) but are combined with unitholders' equity to derive the reported NAV figures (n.b., CAPREIT also makes adjustments for goodwill, derivatives, unit-based compensation, deferred tax items, and ERE's NCI).
The primary drivers of the consolidated NAV were a ~4% cumulative decline in the value of investment properties and a ~5% increase in liabilities (n.b., excluding class B units). In simple terms, CAPREIT's assets have been marked down modestly while leverage has increased, and the value of Class B units has fallen. While the declining value of investment properties has been partly a function of its net disposition activity, the main drivers were ~60bps of portfolio cap rate expansion and a ~6% valuation NOI CAGR.
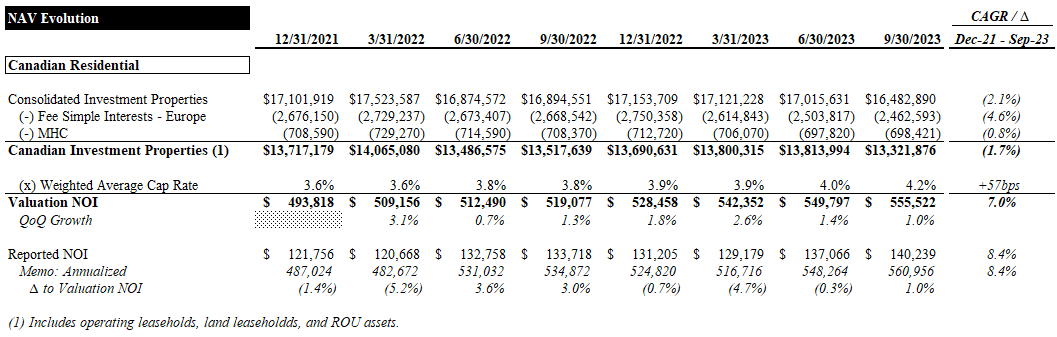
As noted earlier, the reported NAV and investment properties consolidate ERE, so we wanted to look at the evolution of the Canadian residential and MHC portfolio separately. The value of the Canadian residential properties fared much better than the European portfolio, declining ~3% over the period, compared to ~8% for the European portfolio. The average cap rate for the portfolio expanded by ~60bps, implying a ~7% CAGR on its stabilized NOI. This stability is more impressive considering that the total suite count for this segment has decreased ~4% (n.b., ERE's suite count grew by ~5%), implying its value/suite increased ~1%.
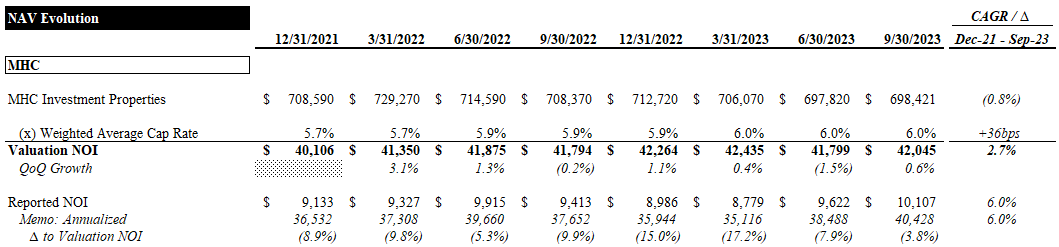
The MHC portfolio value remained relatively stable, declining ~1%. Its average cap rate expanded ~40bps, implying a ~3% CAGR on stabilized NOI. Total MHC sites declined ~0.6% over the period, indicating an increase in value/site of ~0.2%.
Our key takeaway from this analysis is that CAPREIT's Canadian portfolio value has proved far more resilient than ERE's, largely due to greater stability in its cap rates. Considering CAPREIT has been a net seller of Canadian suites/sites, the value of its assets has remained essentially flat. In EUR terms, ERE's investment properties value has declined ~8% despite a ~5% increase in its suite count. In CAD terms, it has declined by ~5%.
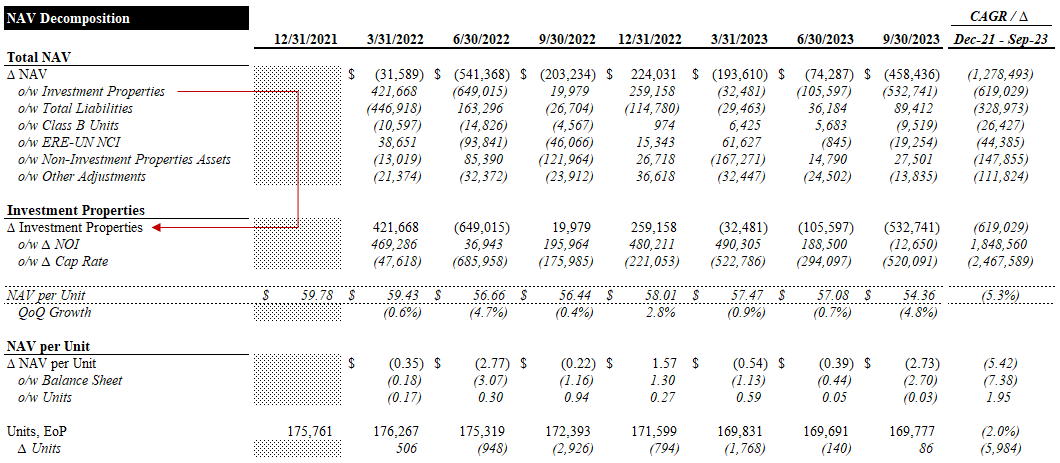
As we've seen with most residential REITs in recent quarters, CAPREIT's NOI growth has been overshadowed by significant cap rate expansion. Consolidated NAV per unit has declined at a ~5% CAGR over this period (vs ~7% for the total NAV) due to net unit repurchases under the NCIB.
Next, we present three scenarios exploring the theoretical NAV evolution holding certain variables constant. First, we look at the average cap rate. As seen below, holding the portfolio cap rate constant would have resulted in a total NAV and NAVPU CAGR of ~7% and ~9%, respectively. This would have resulted in a NAVPU ~30% higher than reported.
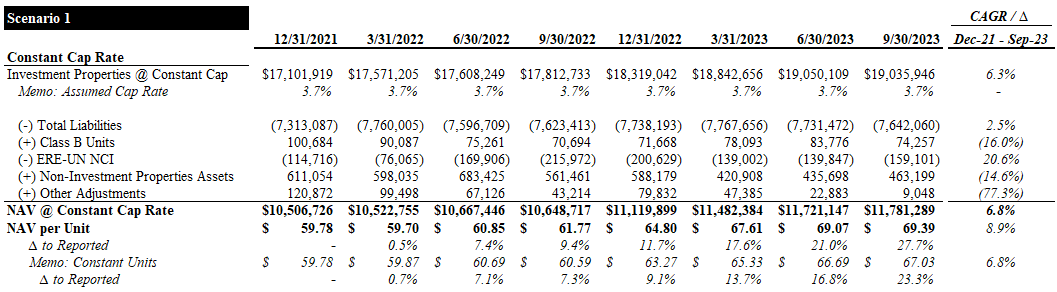
Second, we look at NOI. As seen below, holding stabilized NOI constant, total NAV and NAVPU would have declined at a ~17% and ~16% CAGR, respectively. This would have resulted in a NAVPU ~18% lower than reported.
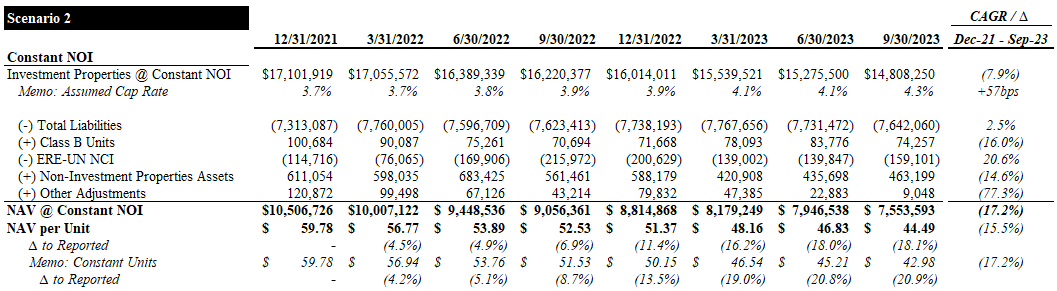
Lastly, we look at the other balance sheet items. As seen below, holding liabilities, Class B units, and other assets constant, total NAV and NAVPU would have declined at a ~3% and ~2% CAGR, respectively. This would have resulted in a NAVPU ~7% higher than reported.
Leverage
As discussed earlier, rising interest costs have been a headwind for CAPREIT's FFO and ACFO. The REIT was in good shape from a debt perspective going into '22, with a 5.7-year weighted average term to maturity ("WATM") on its mortgages, which were >99% fixed rate or swapped to fixed.
Since then, its average mortgage interest rate has increased ~26bps to 2.73%, and its mortgage WATM has decreased to 5 years. Its mortgage maturity profile is well staggered and still >99% fixed rate or swapped. Overall leverage is comparable to multi-family peers at ~47% D/GBV and ~11x EBITDAFV. Its only material floating rate exposure is its acquisition and operating credit facility and ERE's revolver. These floating-rate credit facilities collectively account for ~7% of gross debt.
The table below depicts CAPREIT's debt structure and key leverage ratios, excluding ERE's mortgages and credit facility. Due to historically tighter cap rates in the European market, ERE has used higher leverage to satisfy the return requirements of CAPREIT, its Canada-based majority owner. As expected, leverage is significantly lower when we exclude ERE, at ~38% D/GBV and ~9x EBITDAFV.
Debt Structure (Empyrean; CAPREIT)
YTD, CAPREIT has entered ~$606MM of consolidated mortgages with a ~7-year WATM and 4.4% WAIR (n.b., consolidation of ERE's new mortgages skews the rates lower).
Valuation
CAPREIT trades for 19.4x and 20.1x LQA consolidated FFO and ACFO, respectively (n.b., 20.8x and 25.0x LTM, respectively). With a $1.45 per unit annual distribution, it yields ~2.9%. Based on our NAV estimate, the market is pricing CAPREIT at a ~7% discount and a ~4.2% implied cap rate.
Excluding ERE (n.b., shorting 0.65 ERE units per CAPREIT unit and adjusting per share metrics accordingly) implies ~21.5x LQA FFO and ACFO (n.b., 23.2x and 27.6x LTM, respectively). Because ERE trades at a more significant NAV discount to CAPREIT, excluding it narrows the discount slightly to ~5% and increases the implied cap rate by ~9bps. Additionally, shorting ERE with its current ~7% yield dilutes the effective yield of the CAPREIT-only position by ~14bps.
Valuation Summary (Empyrean)
While we have a Hold rating on ERE, it is statistically cheaper than CAPREIT, which makes it difficult for us to feel comfortable shorting. We also note that if we exclude ERE's NAV from our valuation, current prices still provide a ~2% discount to CAPREIT's Canada-only NAV, and investors can get the stake in ERE as a free option. Therefore, the synthetic Canada-only position does not offer much benefit, as it dilutes the yield and multiples with little benefit.
Our NAV estimate of ~$53.6 per unit assumes ~$563MM of NTM NOI for the Canadian residential portfolio (n.b., ~4.7% YoY growth) valued at a ~4.2% cap rate, and ~$39MM for the MHC portfolio at a ~6% cap rate. We included our own NAV estimate for ERE at CAPREIT's 65% share, the market value of its stake in IRES, and ~$27MM for the value of its ERE management agreement (n.b., 3.5x fee earnings less expenses).
The major balance sheet adjustments for the NAV are shown in the table below.
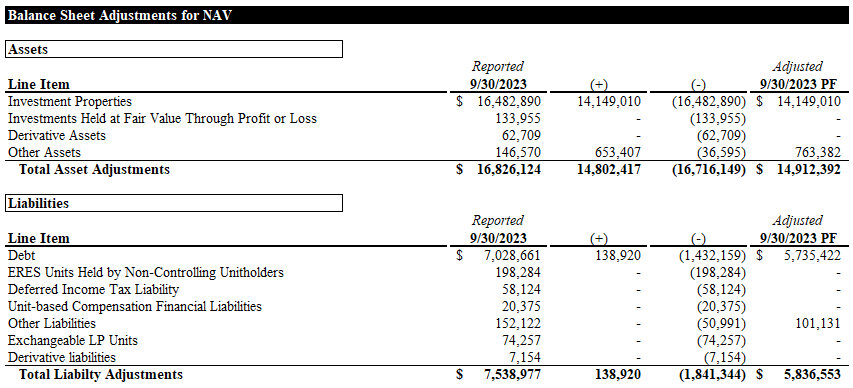
Our NAVPU implies ~8% upside and LQA FFO / ACFO multiples of 21.0x / 21.7x. We note that YTD, CAPREIT's repurchases under the NCIB have been executed at an average price of ~$46.5 (n.b., ~$45.4 in '22). We think this price range is where the units become more attractive to us (n.b., $46.5 per unit entry price only implies ~15% upside to our NAVPU).
Target Price and Returns (Empyrean)
We like CAPREIT's portfolio and believe management has shown an ability and willingness to allocate capital effectively to preserve and grow value for unitholders. Its size and market awareness make highly attractive buying opportunities rare and short-lived. Our understanding of its core Canadian portfolio and ERE may provide interesting pair-trade opportunities in the future, so we will continue to monitor the unit prices for more attractive opportunities.
Risks
Rent Control
CAPREIT's assets are regulated by various rent control regulations. A detailed discussion of the Dutch rent control framework and recent developments can be found in our ERE report . Over the past 2 years, guideline rent increases in its 2 largest Canadian markets, Ontario and BC (n.b., ~70% of residential suites and NOI in Q3), have been capped at 2.0%-3.5% (see below). As described in the footnotes, these increases have been ~300bps below CPI inflation. While CAPREIT can still realize larger rent increases through turnovers, above-guideline increases ("AGIs"), and additional rental increases ("ARIs"), the broader rent control framework has been restrictive.
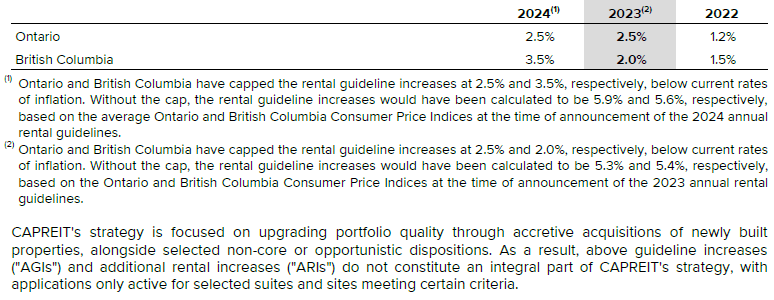
With the cost of living, particularly housing, being a prime concern for all levels of government, there is a risk of further restrictive measures. We seek to address this risk through conservative underwriting for stabilized NOI and requiring a margin of safety in our valuation.
Catalysts
ERE Strategic Review
As discussed in our ERE report, the REIT is undergoing a strategic review. If this process is successful, it will likely result in a takeover bid. An attractive bid from a third party could be a material catalyst for CAPREIT. Because our valuation already gives full credit to ERE's NAV, there would likely be little upside to our view of CAPREIT's intrinsic value. However, it would simplify the REIT's structure and free up capital for unit repurchases or acquisitions that could be accretive.
NCIB Activity
Since Q4 '21, CAPREIT has reduced the unit count by ~3% through net repurchases under its NCIB. As discussed earlier, this has been of great help to FFO, ACFO, and NAV per unit. Further activity on the NCIB could help generate unit returns in excess of organic cash flow and earnings growth.
Conclusion
CAPREIT's consolidation of ERE has obscured its core Canadian portfolio's true operating and financial performance, which has remained relatively robust. We like its management team for their ability to accretively allocate capital, and their quality portfolio. With an understanding of the Canadian portfolio and ERE as separate entities, we will continue to monitor the companies for attractive and creative opportunities. For now, we do not see a large enough margin of safety to warrant a Buy rating.
For further details see:
Canadian Apartment Properties: Keep Your Stick On The Ice