QVMS - Capital Preservation And Patience Only Then A Happy New Year
Summary
- Lehman declared bankruptcy on September 15, 2008. Let’s compare SPY in 2022 to the experience of 2008 before the Lehman bankruptcy which then punctuated a year-long downside drift.
- 2022 has exhibited a downside drift much like early 2008. Now what? There will be a capitulation, and it is likely to come in a rush with little warning.
- I dropped the Nasdaq and most bonds in early ’22, and I’ve been overweighting floating-rate treasuries for months, constraining equity holdings to small commitments at select times.
- That plan avoided most of the damage from both stocks and bonds, but gains have been elusive. Now I’m holding 95% floating-rate treasuries and 5% SDS (4% yields with inverse S&P).
- Big gains will come from modest participation in a precipitous decline, identifying the bottom, and riding the 50% rise on the rebound. Capital preservation and patience will be rewarded.
My working title for this article was "We Ain't Seen Nothin' Yet!" but in truth, I'm not big on predictions; I prefer to think in probability terms related to the near-term risk-reward profile. So, while I do believe this market is poised for a precipitous decline, let's consider how different strategies might fare in relative likely and unlikely near-term market environments.
Background
The past year has been a tug of war between market forces that recognize the reality of a determined Fed and those who hope for that same Fed to relent early and re-establish the Fed put. Frankly, I've been surprised at how that hopeful faction has been able to moderate the decline. The S&P is down only about 18% in the face of corrective policies reversing ludicrous largess, and a relentless stream of bad news.
The Fed is fighting inflation by breaking demand in the face of unprecedented recent monetary stimulus, unprecedented and ongoing fiscal stimulus, and substantially constrained supply chains due to COVID, world-wide government policies, over-dependence on China, etc. Stimulus and constrained supply are a perfect storm for inflation, so the Fed has a tough row to hoe.
By the way, counterproductively, Fed policies will also fight the supply side because investments will lag, directly as interest rates rise and indirectly as companies reassess prospects in a falling economy.
It's worth repeating how aberrant Fed policy has been since 2008. This is an excerpt from my October 12, 2022 article Navigating This 100-Year Market .
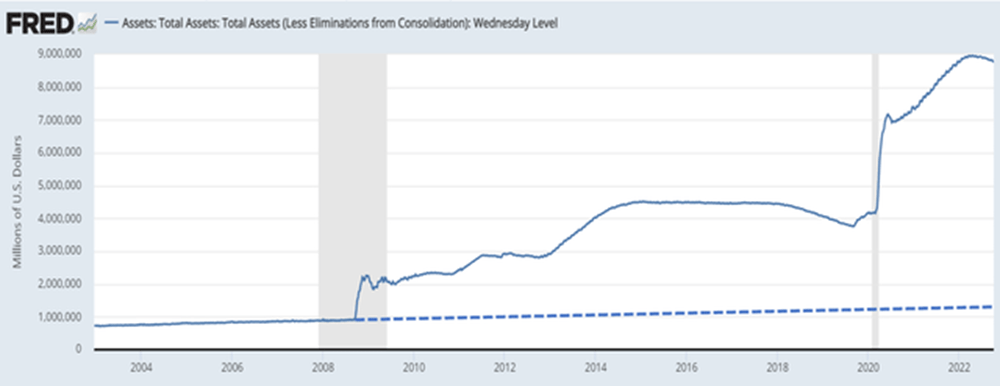
"This basic chart of the Fed balance sheet is taken from the Federal Reserve Bank of St. Louis ("FRED"); the dotted line is mine.
If the Fed is targeting a 2% inflation rate, it seems rational that their balance sheet might grow at 2%. That is the approximate slope of the line on the left third of the FRED graph and my extrapolated dotted line from August 2008. In that context, their response to the Great Financial Crisis ("GFC") and then COVID looks ridiculous."
The current conditions and corrective steps will inevitably lead to some major element in the economy breaking. For a historical lesson, I'll focus here on the Lehman bankruptcy of September 15, 2008. But first, let's step back and consider likely market scenarios.
Likely Market Environments
I'm sure you'll make your own assessments, but my expectations are these:
1. By far, the most likely scenario is a precipitous decline. It will reflect some bankruptcy or system-related breakage, or just a dawning recognition of a sharp collapse in economic activity and, market prices. That will be followed by inflation relief and the Fed relenting, triggering a sharp price rebound. Until that precipitous decline, the Fed will persist in policies that are likely to break something.
2. The next small likelihood would be a continued 'orderly' decline as earnings estimates fall and the Fed continues to tighten, but more moderately. That process would continue until reported inflation dips below the Fed's benchmark interest rate, i.e., finally positive real rates. (Now, despite tightening to date, real rates are materially negative, about 3%-plus depending on what benchmarks are preferred.)
3. Least likely, and almost inconceivable to me, would be the Fed deciding to reverse course as year-over-year inflation falls gradually over the next six months or longer.
So, the most likely way that 2023 will play out includes a precipitous decline driven by capitulation by the hopeful-investor crowd. The entire year 2022 has been characterized by a series of declining peaks and troughs as hopeful rallies were met with emerging realities.
Consider where that intermittent hope finds support. Earnings estimates are just now accepting that no growth is likely. For most of the year, they showed continued growth. These excerpts regarding Goldman can be found here .
- "Over the long-term, corporate earnings growth and stock prices have a direct relationship.
- Goldman Sachs downgraded its outlook to 0% earnings per share growth for the S&P 500 next year, and they could get worse.
- In a recession, we expect S&P 500 EPS would fall by 11%," Goldman Sachs' David Kostin said."
Other than optimistic earnings forecasts, this next source of hope is a bit less obvious. This year will mark 15 years since an economic downturn lasted more than a few months. Many investors have never experienced a sustained downturn and many of those who have, barely recall the details.
The 'Fed put' had been in effect for 15 years until it was finally withdrawn a few months ago. Investors have been trained to expect the cavalry to arrive before serious pain is ever realized. A "normal market" has been defined as short-lived transient declines followed by another injection of happy juice per the FRED chart above.
The VIX & 2008 Parallels
I use VIX futures in quantitative models to assess market risk. The gradual-and-stammering S&P decline over the last 12 months has been problematic; algorithm metrics have been cycling too rapidly saving only about two-thirds of the S&P decline. While a small loss is far better than a big one, I much prefer the 2020 experience when, after sidestepping the Q1 COVID crash, the algorithm ultimately gained more than 50% that year. But this cycle is still yet to play out.
In light of the stammering market, some have raised the question "Is the VIX broken?" and that has caused me to look for historical parallels. I was amazed at how 2008 lined up, but to fully appreciate the similarities, it's necessary to understand how outlier VIX values relate to decisive moments like something breaking with contagion implications.
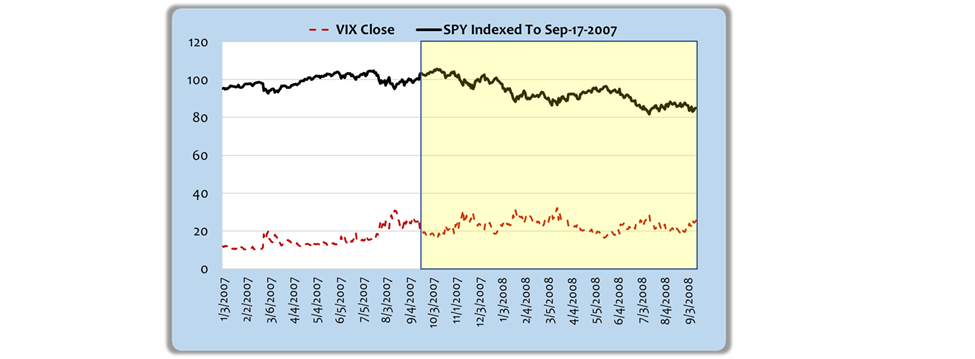
Recall that Lehman Bros. declared bankruptcy on September 15, 2008. This chart shows the S&P indexed to a starting value one year prior to that bankruptcy along with spot VIX quotes at that time. The one-year is highlighted in yellow, and the left side is simply there for context.
2008 SPY & VIX Pre-Lehman (Yahoo Finance)
I want to call your attention to two facts. Over that period, despite all kinds of emerging concerns, the S&P dropped only 15%, much like 2022. The second fact is that spot VIX never exceeded mid-30 quotes over those 12 months, again much like 2022.
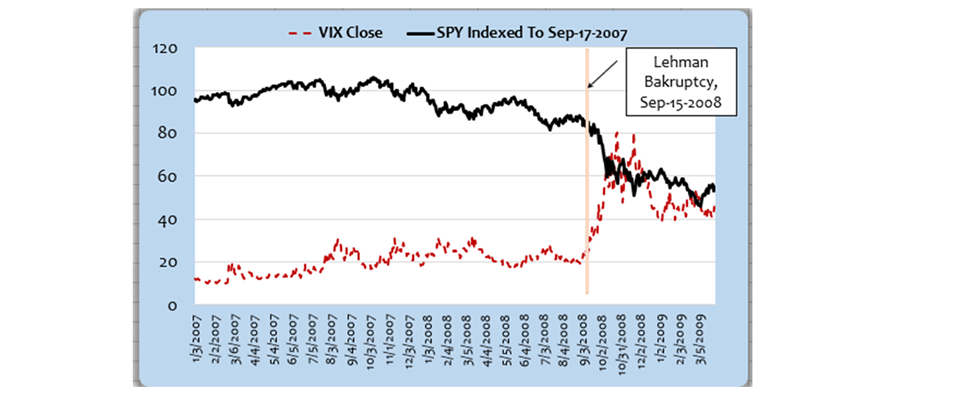
And then Lehman declared bankruptcy, and this happened. VIX spiked to 80 and markets crashed decisively. The S&P, which had lost less than 20% before the Lehman event, was down more than 50% at its trough.
SPY & VIX, Pre & Post Lehman (Yahoo Finance)
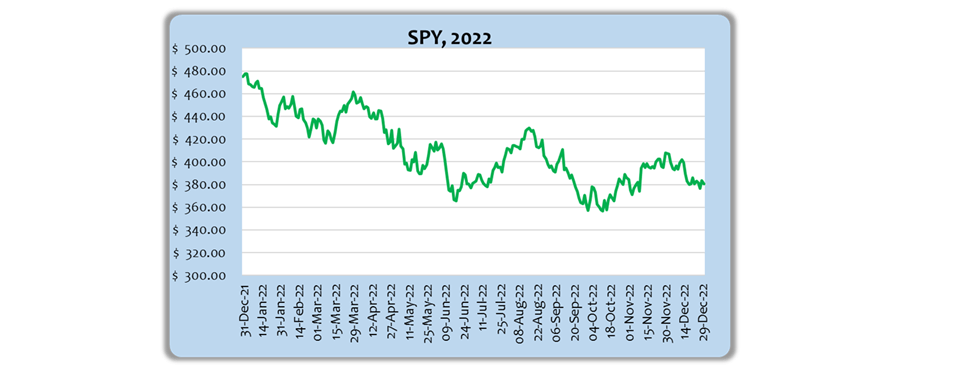
To further the analogy, this chart overlays indexed SPY quotes for 2022 in green against the year prior to and following the Lehman bankruptcy in red.
SPY, 2008 v 2022 (Yahoo Finance)
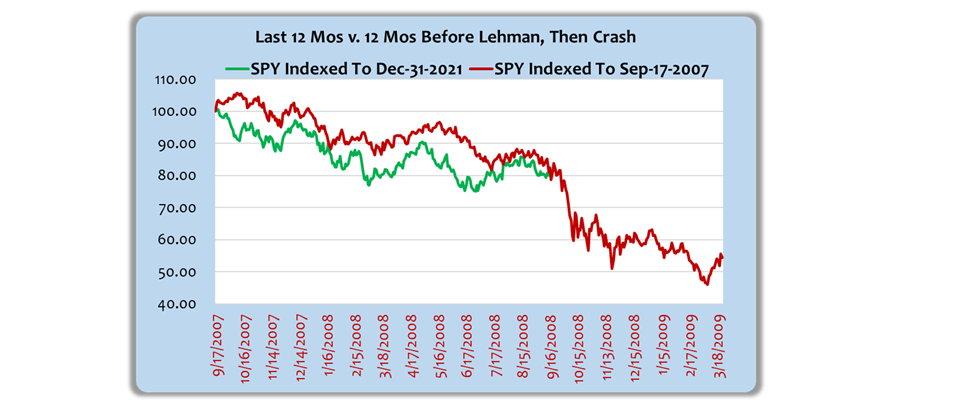
My point is not that prices will fall with exactly the same timing or intensity as 2008, but that anyone looking for a dramatic rise in VIX will search in vain until capitulation. VIX levels in 2022 are consistent with the stammering downward price drift we've experienced.
But ultimately VIX will spike and it will do so coincident with capitulation. Capitulation and VIX outliers occur together. But after that, identifying the market bottom will be possible when VIX peaks and begins to run out of steam. Here's how.
VIX futures trade under the symbol 'VX'. Spot VIX is closely aligned with the first VX futures month ("prompt month"), and under severe stress that prompt month spikes more dramatically than later-month futures contracts. In other words, the shape of the VX structure becomes 'backwardated' or slanted downward on a left to right graph.
That structural shape can be quantified and then put into context of historical shapes spanning different look-back horizons. Analyzing such structural changes can provide an early warning of a coming inflection point, signaling a reversal and market bottom. Only by constantly monitoring relative VX futures quotes and the rates of change in their structure can the market bottom be reliably identified before it is too late to capture initial gains. And initial gains are often the largest.
Now, here's the rub. While algorithm signals have consistently beaten a buy-and-hold strategy by about 12 percentage points, that will not be good enough if the market falls by half in a capitulation event. From a strategic perspective, equity risk far exceeds potential rewards right now, even with a 12 percentage point algorithm advantage. All that will change when a bottom forms, but not until then.
So What?
Going back to my section on likely market environments, I'm positioned for scenario #1. I'm holding about 95% of my portfolio in floating-rate treasuries which pay about 4% now. They have no rate risk or credit risk. For those who value simplicity, there are some money market funds with similar yields. I've also got 5% of my portfolio in [[SDS]], a 2X-inverse S&P ETF. I'm taking very modest risk, purely on my market view.
Let's suppose that scenario #2 emerges instead. In the event of orderly S&P declines, my 4% yield plus modest SDS gains are likely to be competitive with any prudent equity allocation even if a 12% advantage were to be realized.
It's unlikely, but if scenario #3 occurs, and the Fed pivots early, they will announce it, and I'll reconsider my strategy after missing out on a day or two of rising prices. I'll forego that immediate rise of 3% or so on my normal equity commitments; I value safety more than speculating on a low-probability outcome.
So, for a little while, I've decided that a strategic view should dominate the tactical approach offered by the algorithm. There will be tremendous gains available once we hit bottom, and I'm confident I will recognize when an aggressive posture is appropriate again. But for now, capital preservation and patience are my watchwords.
So have a happy new year, even if it comes a month or more late this time.
For further details see:
Capital Preservation And Patience, Only Then A Happy New Year