ENSG - CareTrust REIT: The Best Real Estate Investment In Senior Care
Summary
- CTRE's triple-net leases are a huge strength when real estate investing in the difficult senior care space.
- CTRE boasts a best-in-class portfolio anchored by a large exposure to the Ensign Group as its largest tenant.
- Management is disciplined and patient acquirers of new properties and have been proactive in their portfolio repositioning efforts.
- CTRE also boasts a best-in-class balance sheet.
CareTrust REIT (CTRE) just released Q4 2022 and full-year earnings , and it confirms the thesis I've presented in my last few articles written about CTRE (see here and here ) that skilled nursing facility ("SNF") fundamentals are firmly in the midst of recovery.
Resident occupancy is improving, partially due to improvements in the nursing facility labor market, while management's portfolio repositioning plan is nearly complete. The environment now looks to be more amenable to external growth through acquisitions, while CTRE enjoys the cost of capital and liquidity with which to invest.
As of this writing, CTRE offers a dividend yield of 5.6% with a strong dividend growth track record that looks likely to keep extending. While I recently explained " Why I Sold National Health Investors ," I want to talk about why I will keep holding CTRE and may even buy more.
Overview of CareTrust REIT
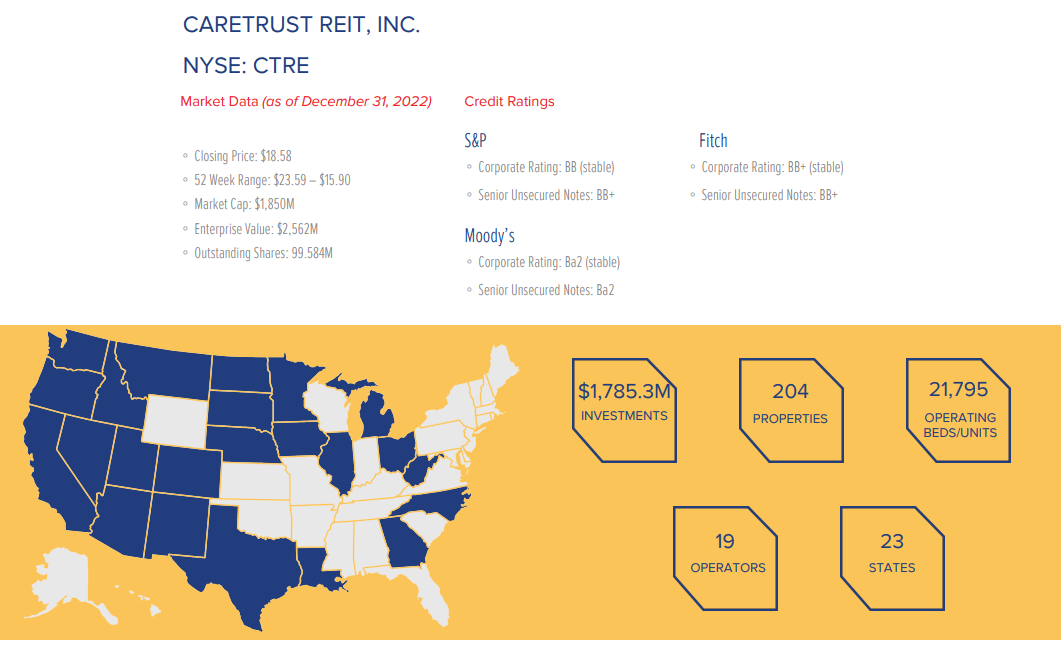
CTRE owns a fully triple-net leased portfolio of mostly SNF properties mixed with some multi-service campuses and senior housing. Of its 204 properties, about 3/4ths are SNFs, with the remainder in multi-service campuses and senior housing.
Also, CTRE works with only 19 tenant-operators, which it views as some of the best of the best in their industry.
The portfolio is overwhelmingly located in two primary states: California and Texas, together accounting for about half of base rent.
As a reminder, all properties in the portfolio are triple-net leased, which means that the tenant is responsible for property maintenance, taxes, and insurance.
The triple-net leases may not be the only reason why I own CTRE, but they are a necessary part of why I own it. Unlike in the senior housing operating portfolio ("SHOP") model, wherein the landlord forms a joint venture with the tenant and takes on operational risk, triple-net leases insulate the landlord from swings in the tenant's operational performance - as long as the tenant remains able to pay rent, that is.
Triple-net leases are extraordinarily efficient. Even with around 5% of contractual rent unpaid (as we'll discuss below), CTRE's EBITDA margin in Q4 2022 sat at 92.8%. The normalized funds available for distribution ("FAD") margin stood at 75.3%, while the unadjusted FAD margin came in at 68.2%.
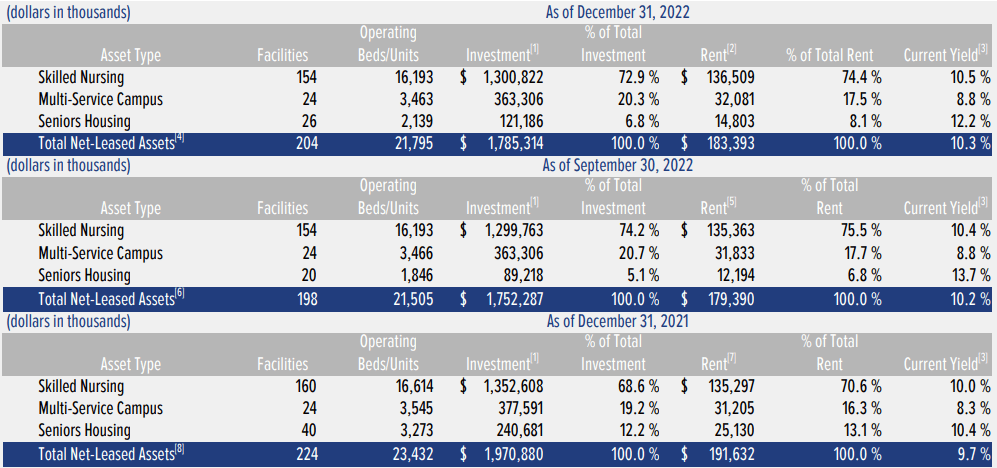
As stated above, about 3/4ths of rent derives from SNFs, and most of the remainder comes from multi-service campuses where, for example, residents can start out with assisted living and transition to SNF as needed.
The "current yield" listed on the far right is actually total rent as a percentage of the purchase price. That may sound odd, but since CTRE's operating expenses are extremely low or nonexistent (courtesy of the triple-net leases), net operating income ("NOI") is very close to rental revenue. So, the 10% reported yield-on-cost is actually a 10% yield-on-cost.
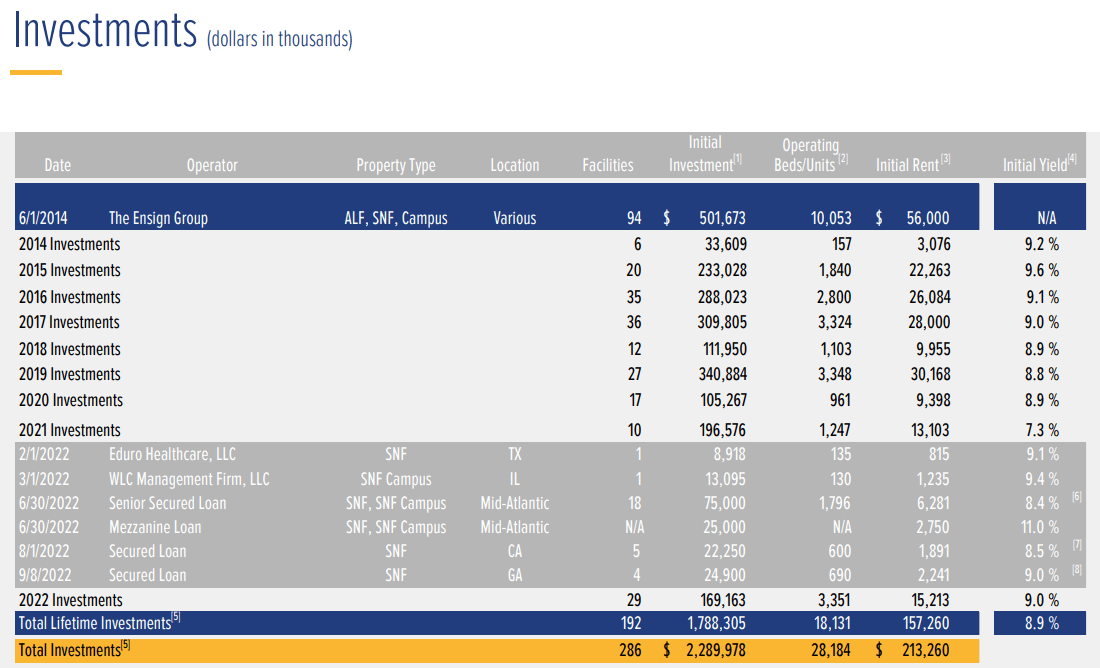
This 10%+ YoC comes from a 9.1% historical initial yield plus 1-3% annual rent escalations on real estate equity investments.
Last year, as you can see above, CTRE invested in a handful of loans because of its inability to find property acquisition opportunities at adequate prices to suit its cost of capital. I appreciate the fact that management showed restraint and refused to overpay for properties.
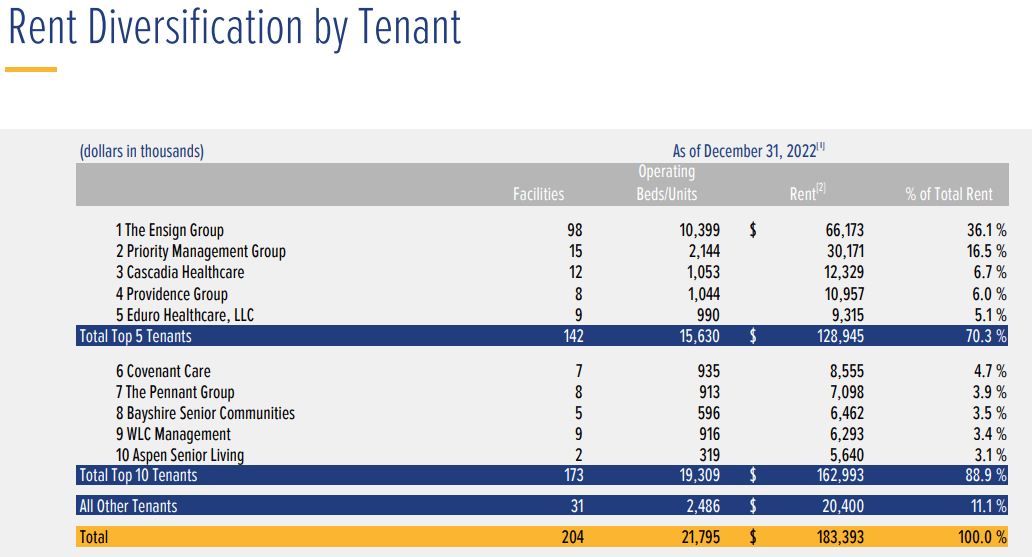
One of CTRE's biggest strengths is the fact that the Ensign Group ( ENSG ) is its largest tenant at over 1/3rd of rental revenue.
Normally, this kind of concentration would be seen as a negative, except when your largest tenant is one of the strongest and best operated players in the industry. What's more, when CTRE was spun off from ENSG in 2014, they purposely set the rent at a low enough level that the initial 97 ENSG properties would have sustainably comfortable rent coverage levels.
We can see those comfortable rent coverage levels in the TTM EBITDAR and EBITDARM coverage multiples, which are now higher for ENSG properties than their pre-pandemic levels.
For the most part, CTRE's top 10 tenants are doing well and showing improvement, aside from the 10th largest tenant, Aspen Senior Living, which still struggles to get rent coverage even up to 1x.
A year ago, CTRE announced its intention to "reposition" roughly 10% of the portfolio, meaning that management set out to decide whether it would be best to sell, re-tenant, or redevelop these properties for other uses. It has taken all year, but it appears that this repositioning process is nearing its completion.
Here's Dave Sedgwick from the Q4 2022 earnings release :
After an exhaustive process during a volatile year, we have sold 13 properties and decided to retain 14. That now leaves only 5 facilities that are still on the market. Two of those are under contract to sell.
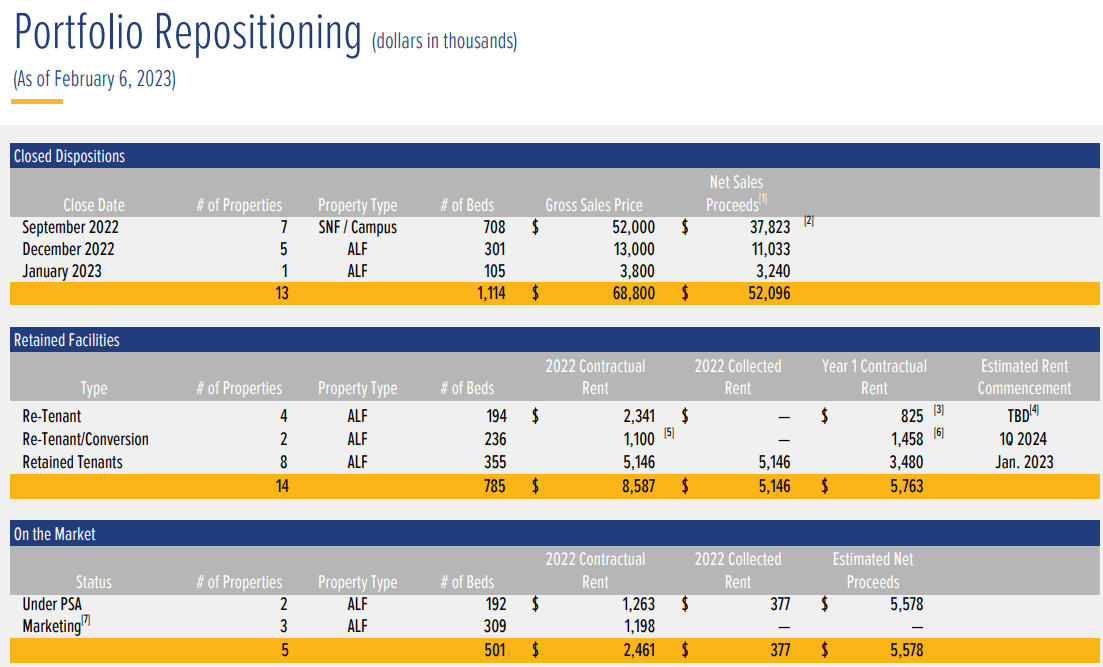
As you can see, the vast majority of properties being repositioned are assisted living facilities ("ALF"), which perhaps signifies that CTRE has been more fortunate with its SNF investments.
End of Year Financial Update
Occupancy at both skilled nursing facilities and senior housing increased 70 basis points sequentially in the fourth quarter to around 74% for SNF and 77% for senior housing, compared to pre-pandemic levels of 78% and 81%, respectively.
This somewhat muted recovery in occupancy is due in no small part to the fact that the skilled nursing labor market has been persistently tight. The industry has been rebuilding its workforce after the negative spiral of burnout leading to more worker exhaustion and burnout played out in 2020 and 2021.
The nursing care industry is still down around 200,000 workers from its pre-pandemic level, but higher pay and benefits from operators seems to have halted the negative spiral and begun the employment rebound.
As operators are able to increase staffing, occupancy should likewise increase and bring rent coverage up with it.
In Q2 2022, CTRE collected 92% of contractual rent. In Q3, that ticked up to 93.4%. And in Q4, that number rose further to 95.5%. For the full year, CTRE's rent collection rate was 95.2%.
Currently, there is one main problematic tenant for CTRE representing 2.8% of rent that has not paid any rent since November 2022.
In Q4 2022, CTRE's normalized FFO per share came in at $0.38, up a penny from Q3's $0.37. Meanwhile, normalized FAD per share increased to $0.40 in Q4 from $0.39 in Q3. Both metrics are down a penny from the year prior quarter, though.
For the full year, CTRE generated $1.49 in normalized FFO per share and $1.57 in FAD per share, compared to $1.49 and $1.59 respectively for 2021.
It may not be dramatic growth, but at least the numbers are moving in the right direction.
In Q3, CTRE's FAD payout ratio came in at 71%, dropping to 69% in Q4 for an average of 70% in the second half of 2022. For the full year, the FAD payout ratio was 71%.
As for the balance sheet, CTRE ended 2022 with (deep intake of breath) net debt to annualized normalized run rate EBITDA of 3.7x, flat from the 3.7x net leverage ratio reported at the end of 2021.
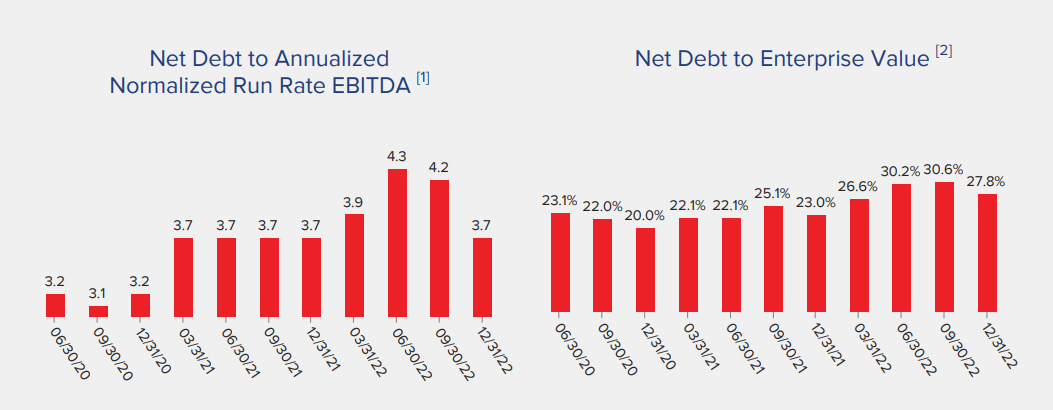
That is below CTRE's target range of 4-5x, but CTRE has almost always operated under the target. I doubt the REIT will purposely raise its net leverage ratio into its target range until interest rates come down enough to accommodate lower-cost borrowing.
As for net debt to enterprise value, this metric did tick up a bit from 2021's 23.0% to 2022's 27.8%. That may be due solely to the increase in borrowings on CTRE's $600 million credit facility from $90 million at year-end 2021 to $125 million at year-end 2022.
Moreover, CTRE recently extended the maturity of this credit facility to 2027 while also eliminating all debt maturing in 2024. Management's proactiveness on refinancing has led to a very comfortable situation wherein CTRE's weighted average debt maturity is about 4.5 years, with no maturities until 2026.
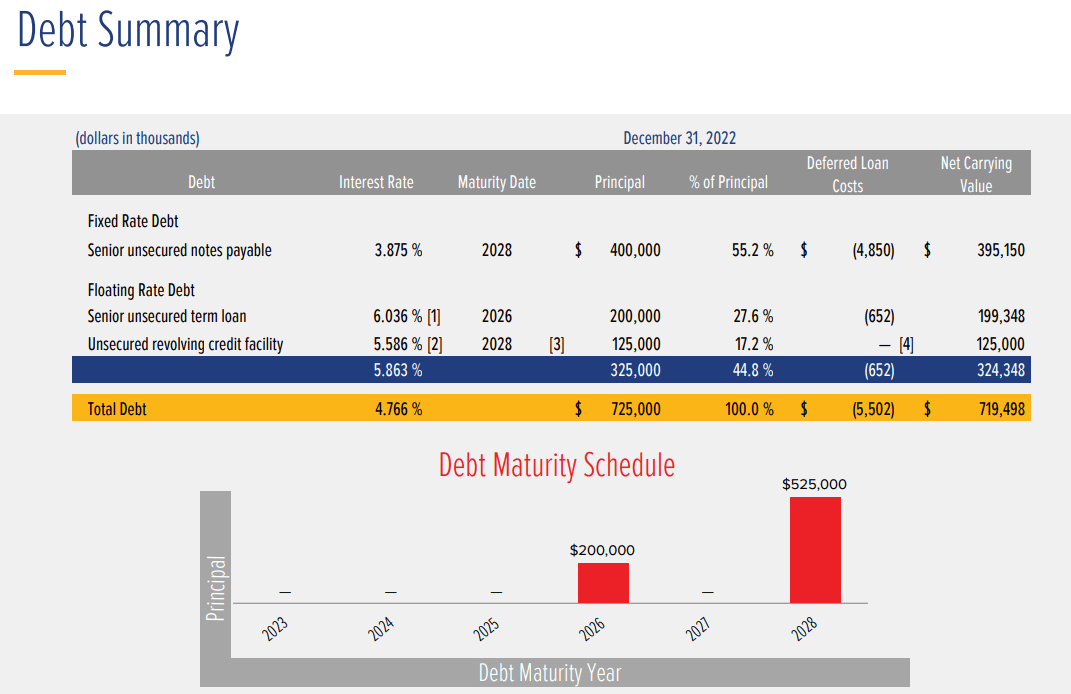
CTRE also ended 2022 with $20 million in cash, which, combined with the $375 million available on the credit facility, results in $395 million in total liquidity (about 20% of market cap).
Bottom Line
CTRE is, in my opinion, the best-in-class skilled nursing and senior care REIT. It has the strongest balance sheet and arguably the best portfolio, anchored by the heavy weighting in ENSG. Best of all, CTRE takes no operational risk because of its strict use of only triple-net leases.
It's no wonder, then, that CTRE's total returns have absolutely crushed those of its closest peers:
If you trust only one REIT to provide solid returns in the troubled senior care space, I believe it should be CTRE.
For further details see:
CareTrust REIT: The Best Real Estate Investment In Senior Care