CRS - Carpenter Technology: Volatile Earnings Resulting In Poor Cyclical Performance
2023-11-17 07:06:20 ET
Summary
- CRS is not a growth company, with low revenue growth and volatile earnings. Sales volume shrunk from 2013 to 2023.
- The company has poor fundamentals. There was no evidence of improvements in operating efficiencies or capital spending. I also have concerns about its financial standing.
- This is a cyclical company and a valuation based on such a lens showed that there is no margin of safety.
Investment thesis
Carpenter Technology Corporation (CRS) is not a growth company. Over the past 11 years, its revenue only grew at 1.2 % CAGR. Sales volume declined. Its earnings have been very volatile and I have concerns about its business fundamentals.
The company has set a goal to double the 2019 operating profits by 2027. However, it did not have a track record of improving capital efficiency. Its unsustainable Reinvestment rate is contrary to its goal of better capital spending discipline.
CRS is a cyclical company and my valuation on such a basis showed that there is no margin of safety. From a fundamental perspective, this is not an investment opportunity.
Business background
CRS is engaged in the manufacturing, fabrication, and distribution of specialty metals. The company has 2 reportable segments.
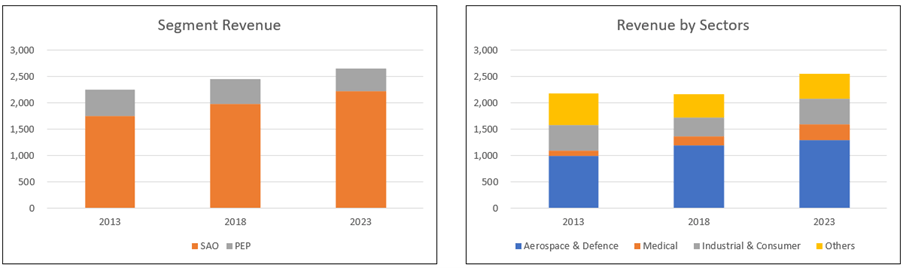
- Specialty Alloys Operations (SAO). This comprised the company's major premium alloy and stainless steel operations. This is the larger revenue contributor. In 2023, it accounted for about 87 % of the external revenue.
- Performance Engineered Products ((PEP)). This comprised the company's differentiated operations. You can see from Chart 1 that the % contribution by this segment had shrunk over the past 11 years.
While it serves several sectors, the Aerospace & Defence sector accounted for about half of the revenue. Refer to Chart 1. In 2023, sales in the US accounted for about 60 % of its revenue.
Note that CRS has June as its financial year-end. As such, unless stated otherwise, the years in this article refer to the financial years.
Chart 1: Revenue profile (Author)
Cyclical sector
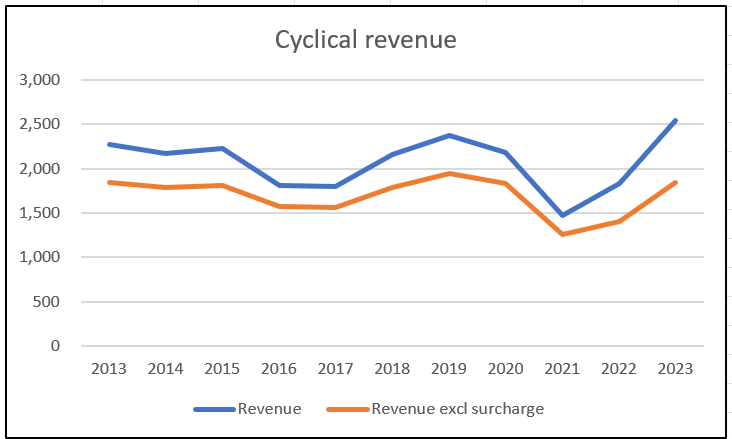
According to the company, the demand for its products is cyclical. This is clearly illustrated in Chart 2.
At the same time, the prices of certain of the raw materials used are volatile. To manage this, the company uses pricing surcharges, indexing mechanisms, base price adjustments, and raw material forward contracts.
But as illustrated in Chart 2, even if we exclude the surcharges, the revenue also shows a cyclical pattern.
Chart 2: Cyclical nature of revenue (Author)
Valuation of cyclical companies
Damodaran opined that cyclical companies' performance depends on where they are in the cycle. Extrapolating the performance based on the current earnings can lead to misleading valuations.
To overcome the cyclical issue, we have to normalize the performance over the cycle. In this context, I analyzed the performance of CRS from 2013 to 2023 so that I covered at least 2 cycles.
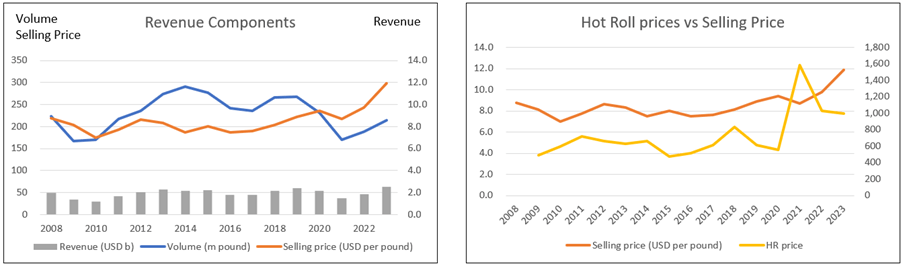
I also decomposed the revenue into shipment volume and average selling prices. As can be seen from Chart 3 (the left chart):
- Shipment volume, while cyclical, also had a declining trend from 2013 to 2023. If you traced the volume back to 2008, there was hardly any change in volume comparing 2008 with 2023.
- While cyclical, the average selling price experienced an uptrend. I hasten to add that the price changes could also be the results of different product mixes. Secondly, over the past 2 years, steel prices have been extraordinarily high as can be seen from the right chart in Chart 3
Chart 3. Volume and price trends (Author)
To reflect the current size of the business, Damodaran suggested that we should take the current revenue and determine the earnings by multiplying it with the normalized margins.
However, there are several challenges in doing this for CRS.
- What should be the current volume? Using the 2023 volume does not take into account the higher historical volume achieved.
- The 2021 to 2022 average selling prices appear to be outlier prices. In the long run, prices would revert to their "non-outlier" situation.
Operating trends
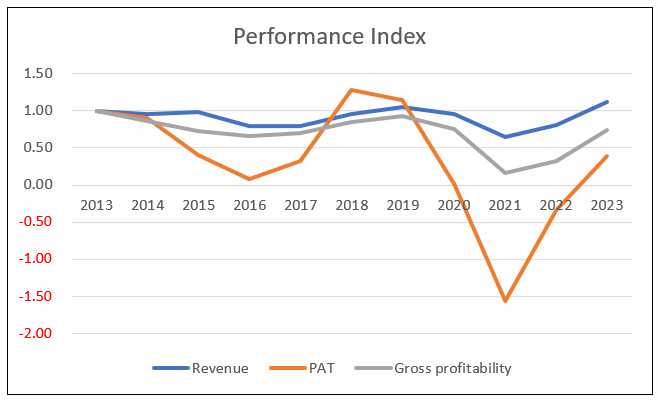
I looked at 3 metrics to get an overview of the overall performance - revenue, PAT, and gross profitability (gross profits / total assets). Refer to Chart 4.
Over the past 11 years, revenue only grew at 1.2 % CAGR. The bulk of the growth came in the past 2 years. This is not a growth company.
The PAT was volatile. The decline in profits in 2015, 2016, 2020, and 2021 was due to declining revenue as well as impairments and restructuring charges.
The other concern was the declining gross profitability. This meant that there was no improvement in the capital efficiency.
Chart 4: Performance Index (Author)
Note to Chart 4. To plot the various metrics on one chart, I have converted the various metrics into indices. The respective index was created by dividing the various annual values by the respective 2013 values.
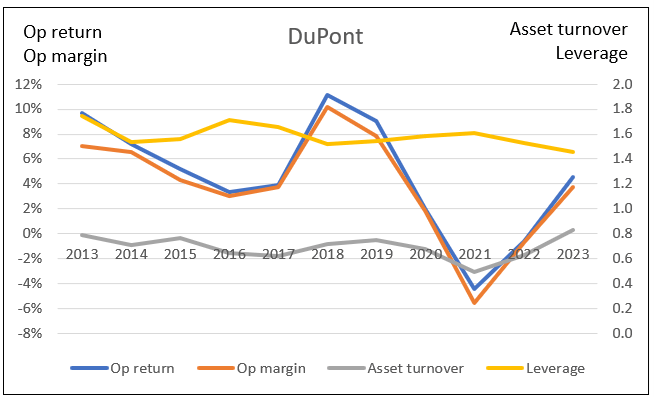
We see a similar dismal picture in the operating returns. I defined this as after-tax operating profit divided by Total capital employed or TCE.
TCE = Equity + Debt - Cash.
From 2013, the return ranged from negative 4.4 % to positive 11.1 % with an average of 4.6 %. I also carried out a DuPont Analysis based on this return as shown in Chart 5.
- The return showing a similar pattern as the PAT. The current return is lower than that in 2013.
- The operating margin accounted for the bulk of the variability of the return.
- There were some slight improvements in the Asset turnover and Leverage.
In 2016, the company launched the Carpenter Operating Model to:
"…unlocking manufacturing efficiencies and commercial opportunities, while also driving further improvements in working capital efficiency and capital spending discipline."
The company has also stated that its goal is to double the 2019 operating profits by 2027. (Source: Q1 2024 Press Release )
As such I was expecting improvements in the gross profitability and more significant improvement in the asset turnover and leverage. But these did not happen.
Chart 5: DuPont Analysis (Author)
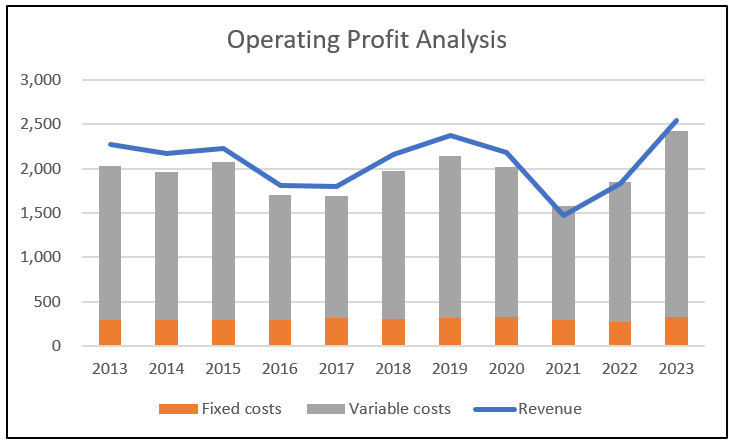
Operating profit
Comparing Charts 3 and 4, you can see that shipment volume plays an important role here. To understand this better, I broke down the operating profits into "fixed-costs" and "variable-costs". I defined these as:
Fixed cost = Selling, General and Administration expenses + Depreciation & Amortization.
Variable cost = Cost of Sales - Depreciation & Amortization.
Contribution = Revenue - Variable Cost.
Contribution margin = Contribution / Revenue.
Operating profit = Contribution - Fixed cost.
Chart 6 summarizes the past 11 years' performance. You can see that the Fixed cost is a relatively small portion of the total cost. It also seemed relatively "stable" over the past 11 years.
Chart 6: Operating profit profile (Author)
Note to Chart 6: There is an operating profit if the Revenue is above the combined Fixed cost and Variable cost.
3 months ended Sep 2023
In the 3 months ended Sep 2023, revenue increased by 24 % compared to that for the same period in 2022. For the same period, there was a PAT of USD 44 million compared to a loss of USD 7 million for the same period in 2022.
According to the company, this was due to strong demand.
In the context of long-term cyclical performance, I consider quarterly results as "noisy". I pay less attention to them compared to the longer-term trends.
Growth
As mentioned earlier, revenue only grew at 1.2 % CAGR over the past 11 years. Over this period the company spent USD 128 million on acquisitions compared to USD 1,741 million on CAPEX.
Reinvestments
Growth needs to be funded and one metric for this is the Reinvestment rate. This is defined as:
Reinvestment with acquisitions = CAPEX & Acquisitions - Depreciation & Amortization + Net Changes in Working Capital.
I then determined the Reinvestment rate = Reinvestment / after-tax EBIT.
Acquisitions are an integral growth driver for the company. As such I have included the annual acquisition expenditure as part of the CAPEX.
Over the past 11 years, the total Reinvestment amounted to USD 1.29 billion. The after-tax EBIT for the same period came to USD 0.95 billion. This resulted in an unsustainable Reinvestment rate of 136 %.
There is another perspective on the Reinvestment rate that is derived from the fundamental growth equation.
Growth = Return X Reinvestment Rate.
Return = EBIT(1-t) / TCE = 4.6 % stated earlier.
Taking the historical growth as 1.2 % and the Return as 4.6 %, the fundamental Reinvestment rate = 1.2 / 4.6 = 26 %.
Comparing the historical 136 % and the 26 %, I would conclude that management needs to re-look at its capital allocation plan.
Capital allocation
Over the past 11 years, the company generated about USD 2.0 billion of funds from cash flow from operations. Refer to Table 1.
You can see that the cash flow from operations was not sufficient to fund the dividends & buybacks as well as CAPEX and acquisitions. It had to issue new net debt to help fund its expenditure.
Table 1: Sources and Uses of Funds (Author)
Shareholders' value creation
Did the company manage to create shareholders' value? To create shareholders' value, the returns have to be greater than the cost of funds.
Over the past 11 years, the average return as measured by EBIT(1-t) / TCE was 4.6 %.
As can be seen from Table 2, this 4.6 % is far below the weighted average cost of capital of 10.3 %. The company did not create shareholders' value.
Table 2: Estimating the Cost of Capital (Author)
Note to Table 2: Based on the Google search for the term "CRS WACC"
Financial position
I have concerns about CRS's financial position:
- It has a 0.30 Debt Capital ratio as of the end of Sep 2023. As per the Damodaran Jan 2023 dataset , the Debt Capital ratio for the steel sector was 0.22.
- As of the end of Sep 2023, it had USD 18 million in cash. This was only about 1 % of its total assets.
- I have already mentioned its poor capital allocation track record and low returns.
But on the positive side, it does not have a liquidity problem.
- Over the past 11 years, it generated positive cash flow from operations every year.
- It generated about USD 2.0 billion in cash flow from operations compared to its PAT of USD 0.5 billion. This is a good cash conversion ratio.
What are the key takeaways from the company analysis? This is not a growth company. I also have concerns about its business fundamentals.
- The historical returns are low and I am not sure whether it has achieved its goal of improving efficiency.
- It has an unsustainable Reinvestment rate.
- Its financials are not so great.
Valuation
I do not consider CRS a growth company. As such I valued it based on an Earnings Power Value basis using the Free Cash Flow to the Firm (FCFF) model as represented by:
Value of firm = FCFF / WACC.
FCFF = EBIT(1-t).
My valuation model is based on the operating profit profile as shown in Chart 6.
- Revenue = Volume X Selling price.
- Contribution = Revenue X Contribution margin
- EBIT = Contribution - Fixed costs.
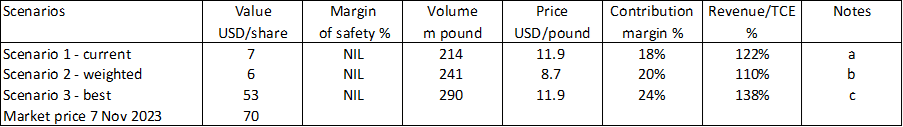
I considered 3 scenarios in my valuation:
- Scenario 1. This is based on the 2023 values for the key variables.
- Scenario 2. This is based on weighted average values for the key variables to account for the past 2 years' outlier prices. I assumed an 80% probability for the 2013 to 2021 average values and a 20% probability for the 2022 to 2023 average values.
- Scenario 3. This assumes that the company can achieve the historical best performance for the key variables.
The results of the valuation are shown in Table 3. There is no margin of safety even in the best case Scenario 3.
Table 3 Summary of valuation (Author)
Notes to Table 3.
a) 2023 values.
b) Weighted average values based on 80:20 probability
c) Best respective values from 2013 to 2022.
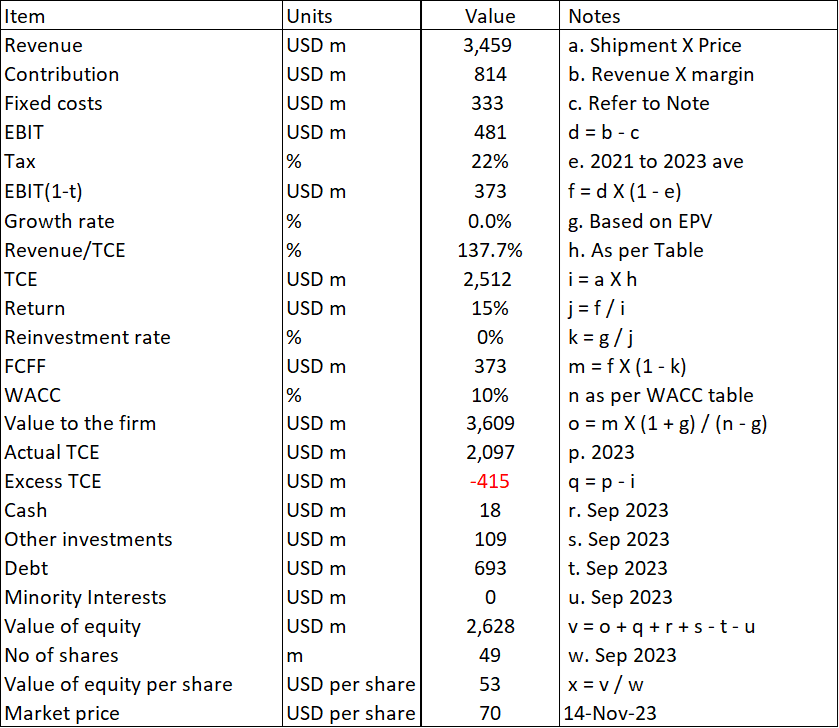
Valuation model
The key variables in my model are:
- Volume. This was based on the poundage data.
- Price. This was the average selling price. I derived this by dividing Revenue by the sales poundage.
- Contribution margin = I derived the annual margin by dividing the Contribution by the respective annual Revenue.
- Revenue / TCE = This is the capital turnover.
A sample calculation is shown in Table 4.
Table 4: Estimating the intrinsic value (Author)
Most of the items in Table 4 are self-explanatory except for the following:
Item c. Apart from the SGA and Depreciation & Amortization, I included an amount to account for the past 11 years' average other costs such as restructuring and asset write-downs. The SGA and Depreciation & Amortization were based on the past 3 years' average values.
Item g. The growth rate is set to zero for the EPV case.
Item q. This is to account for the difference in the derived TCE and the actual TCE.
Item v. Value of equity = Value of the firm less Debt and Minority Interests plus non-operating assets such as Cash and Other Investments.
Risks and limitations
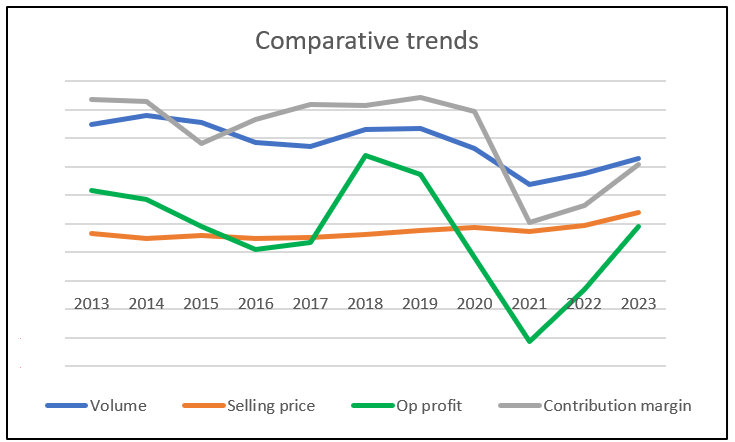
I was very surprised that the intrinsic values under Scenarios 1 and 2 were low. This was because the operating profits were very volatile. You can get a sense of the volatility from Chart 7.
Chart 7: Comparative trends (Author)
Note to Chart 7. To be able to plot all the metrics on the same chart, I had to scale some of them. The goal is to see how the metrics move about each other rather than focus on the absolute values.
2 things stood out when looking at Chart 7.
- The operating profits were more affected by changes in volume and contribution margin. It is less sensitive to changes in selling prices. The best operating profit was when high volume coincided with a high contribution margin as in 2018. The losses occurred in 2021 when low volume coincided with a low contribution margin.
- There seemed to be a high correlation between volume and contribution margin. This could be a characteristic of its business model.
I have already concluded that there was no margin of safety at the current price. The market seemed to be pricing CRS as if the profits were high and not volatile.
The market could also be pricing CRS taking into account its goal of doubling the 2017 operating profits.
In this context, I would like to point out that the goal of doubling the 2019 operating profits is a tall one. To achieve this, the company has to increase its sales volume, maintain at high selling price and improve its contribution margin.
This is because in Scenario 3, I have assumed the best volume (2014 level), best selling price (2023) and the best contribution margin (2013 level).
Given its poor track record in all these areas, I think it is a tall order for these 3 best performances to occur together.
Conclusion
CRS is not a growth company. On top of this, I have concerns about its fundamentals:
- Its average returns are lower than its cost of funds
- There is no clear evidence that it has become more efficient.
- It had an unsustainable Reinvestment rate.
- I also have concerns about its financial standing.
The positive thing is that it does not have a liquidity problem. It had been able to generate positive cash flow from operations every year over the past 11 years, despite 2 years of losses.
CRS is a cyclical company and as such I valued it based on its performance over the price cycle. There is no margin of safety based on such a lens.
Together with my concerns about its fundamentals, this is not an investment opportunity.
I am a long-term value investor and my analysis and valuation are based on this perspective. This is not an analysis for those hoping to make money over the next quarter or so.
For further details see:
Carpenter Technology: Volatile Earnings Resulting In Poor Cyclical Performance