TEX - Caterpillar: Strong Prospects But Overvalued
2023-08-01 09:19:12 ET
Summary
- A comprehensive DCF analysis suggests that Caterpillar stock is currently overvalued at its current market price.
- Drivers of risk include rising interest rates, reduced demand and capital spend in the mining sector, and recent share price strength.
- Share price has increased over the past quarter, yet there has been no significant change in the future prospects.
All figures are listed in unless otherwise noted.
All financial information is sourced from Capital IQ unless otherwise noted.
Price at Time of Writing: $260.90
Investment Thesis
Caterpillar ( CAT ) is well-positioned to benefit from the increased infrastructure spending in the US and boasts a market moat deserving a premium. However, a comprehensive DCF analysis reveals that the recent share price surge over the past 3 months renders CAT overvalued at current market prices.
DCF Analysis & EV/EBITDA Exit
The assumptions that I used can be seen below:
| Tax Rate |
| 25% |
| Discount Rate ((WACC)) |
| 9% |
| Perpetual Growth Rate |
| 2% |
| EV/EBITDA Multiple |
| 12.4x |
Please refer to the supporting work section to see a detailed breakdown of how I arrived at these assumptions.
Forecasting EBIT:
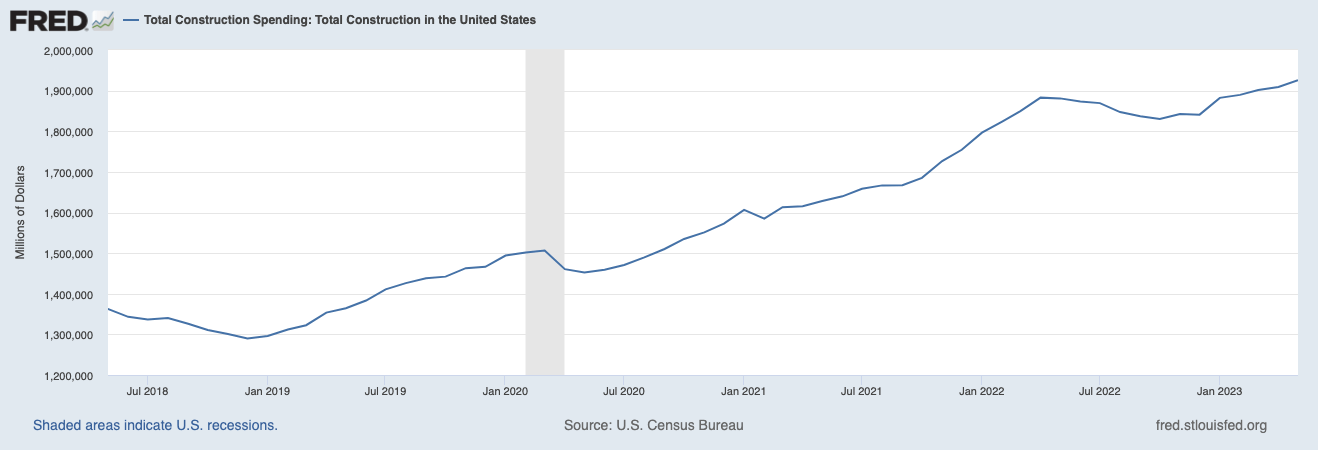
Based on data from FRED , there has been a clear increase in the amount of money spent on construction in the United States. This trend is also prevalent in other countries that CAT operates in, including China.
Total Construction Spend in the USA (FRED)
Over the past 5 years, construction spending in the US has increased at a staggering ~7.2% CAGR. While growth is expected to remain strong in the US, a report completed by Oxford Economics forecasts worldwide construction expenditure to increase from $9.7 trillion in 2022 to $13.9 trillion in 2037, representing a ~2.4% CAGR. While it's hard to quantify the effects of increasing interest rates, the economy tends to lag the rate cycle. I think that this will cause construction growth to decrease from its current pace, but given the infrastructure bill, it will still be above worldwide growth.
With respect to the mining industry, rising interest rates have dampened the commodity demand outlook. While I note that growth in clean energy will be a potential catalyst, overall CAPEX in the mining industry is expected to decrease as lower spending on iron and gold developments begin to materialize.
Capital Spending in Mining Industry (S&P Global Market Intelligence)
Based on both forecasted construction spending and forecasted mining expenditures, I have grown Caterpillar's sales by 5% through 2027. Over the past 5 years, CAT has seen an average operating margin of around 14.5%. Noting certain cost initiatives taken by management and the significant decrease in operating margin through COVID, I have decided to use an operating margin of 15% for the DCF:
| 2023 |
| 2024 |
| 2025 |
| 2026 |
| 2027 |
| Revenue |
| $59.403 billion |
| $62.373 billion |
| $65.492 billion |
| $68.766 billion |
| $72.204 billion |
| EBIT |
| $8.911 billion |
| $9.356 billion |
| $9.824 billion |
| $10.315 billion |
| $10.831 billion |
Results
The price target derived from the DCF model was: $170.94 representing a -34% difference from the current share price.
Fair Value Waterfall Chart (Author's Illustration)
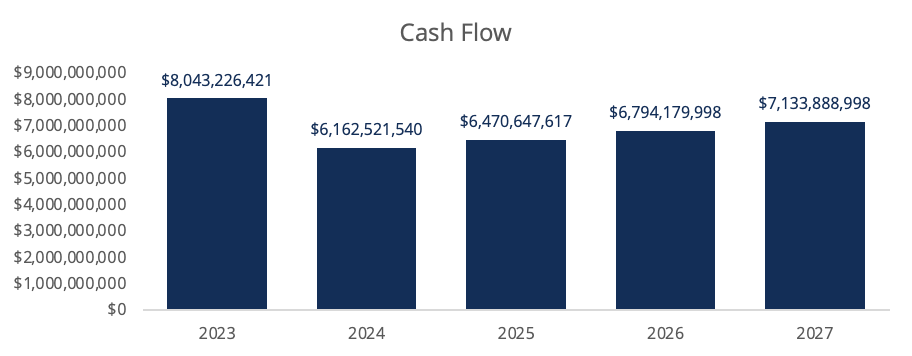
The FCFF forecast shows a higher FCFF in 2023, a decrease in 2024, and then a stabilized period of growth from 2024-2027. The FCFF is higher in 2023 due to Caterpillar's intention to keep CAPEX at $1.5 billion however, in order to maintain and increase revenue this figure will have to increase as seen in the FCFF chart.
FCFF Forecast (Author's Illustration)
Deriving The Discount Rate
The discounted cash flow analysis will use FCFF (unlevered free cash flow or free cash flow to the firm) as the proxy for cash flow. Therefore, I calculate the WACC for Caterpillar as we are basing the valuation on a firm-wide level (if you use FCFE, you should only use the cost of equity as your discount rate).
- The 5-year monthly beta for CAT is 1.11
- The 2023 ERP in the United States is estimated to be 5.70%
- The risk-free rate used was the 5-year yield on US government bonds which as of July 27th, 2023 was 4.09%
- Therefore, the CAPM suggests a required return on equity of 10.42%
- The LTM interest expense for CAT was $463 million
- The average debt on the balance sheet in the LTM was $36.864 billion
- Therefore, the pre-tax cost of debt is 1.26% and the after-tax cost of debt using a 25% tax rate is 0.94%
- Total equity stands at $134.6 billion and total debt at $37.038 billion
To ensure accuracy in the calculation of WACC, I confirmed that the current capital structure was consistent with the historic capital structure. Using all the inputs listed above, the WACC for CAT is 8.37%.
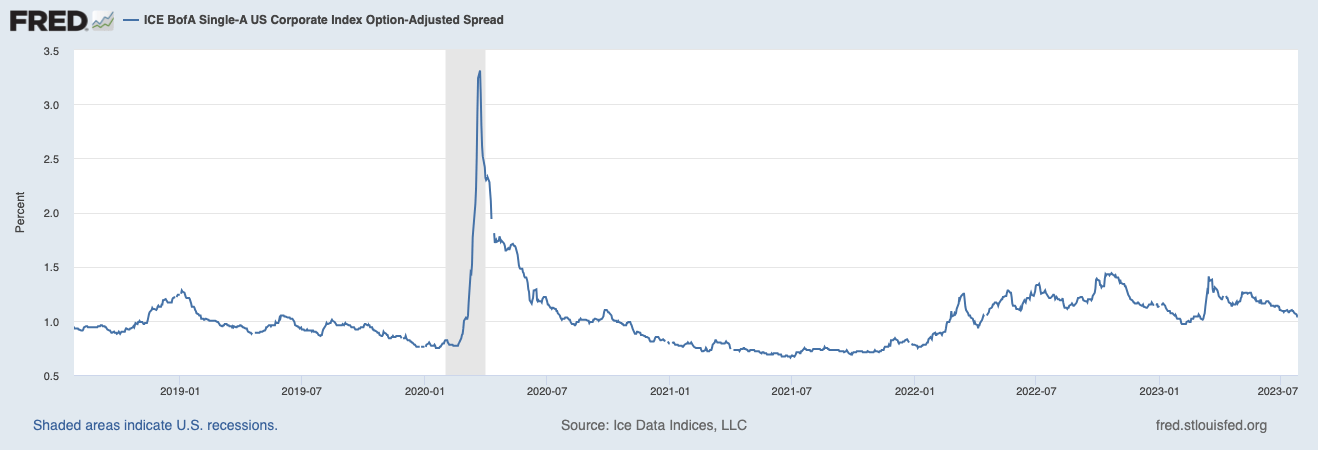
Given that the cost of debt is quite low, it didn't make intuitive sense to use this as the WACC. I replaced the pre-tax cost of debt with the risk-free rate + the current credit spread on A-rated bonds (as CAT is rated A). This brings the after-tax cost of debt to 3.85% and therefore, the resulting WACC is 9%.
OAS Credit Spread on A-rated Bonds (FRED)
Deriving The EV/EBITDA Multiple
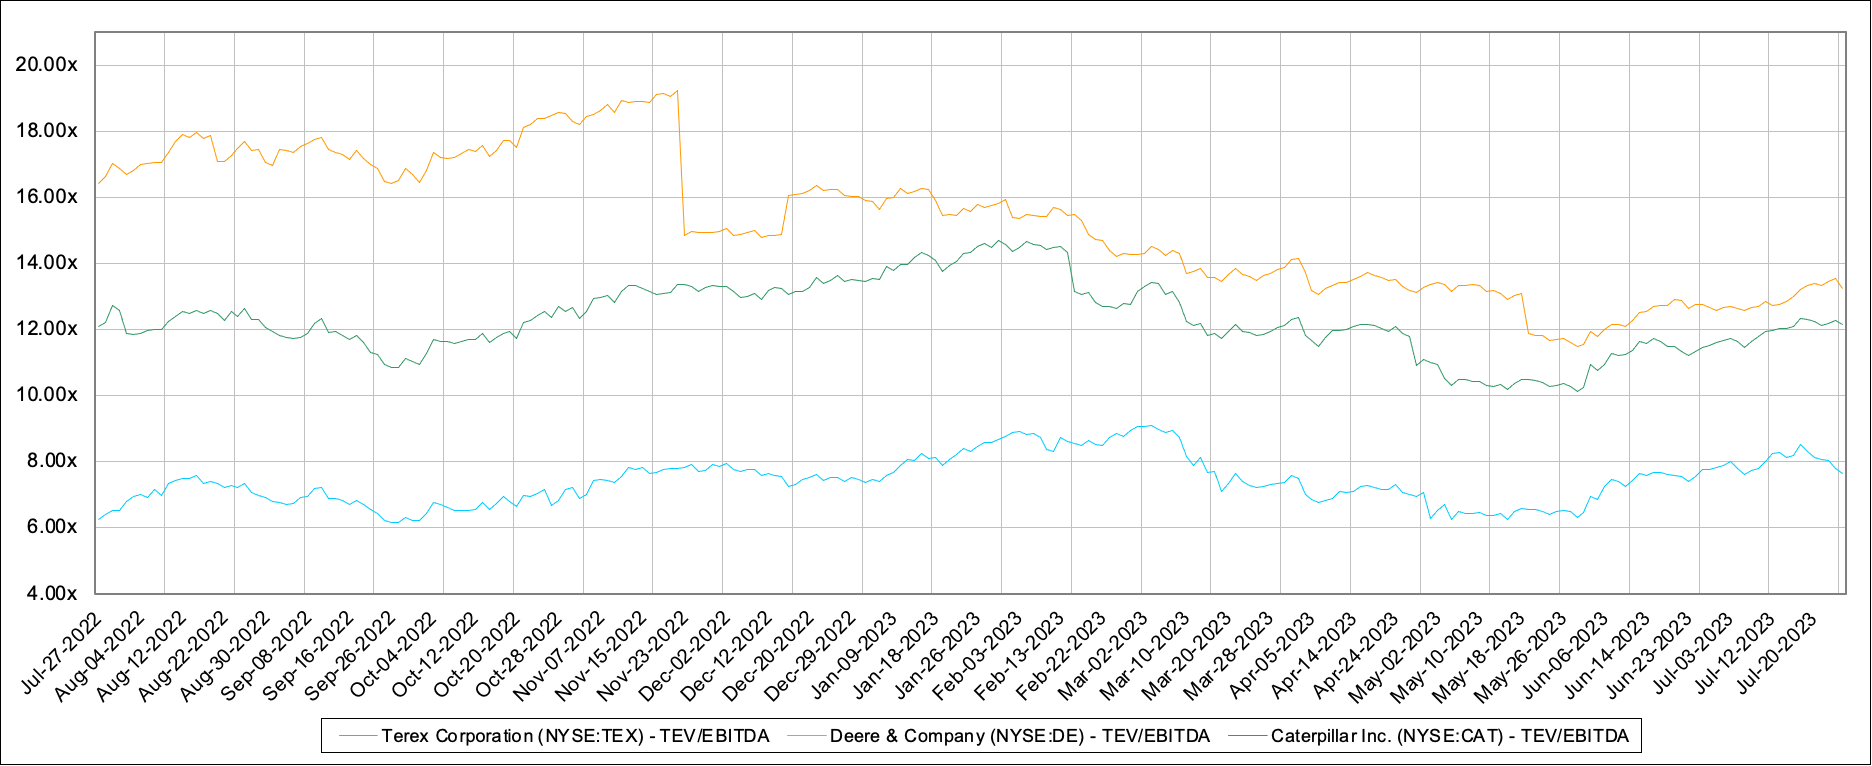
To confirm that the market gives CAT a slight premium on the valuation multiple due to their economic moat, I looked at both Deere & Company ( DE ) and Terex Corporation ( TEX ) EV/EBITDA multiples over the same period. The chart below shows that both Deere & Company and Caterpillar have a higher multiple than Terex. This confirms my intuition that there is a size premium as Deere & Company is only slightly smaller than Caterpillar whereas Terex is much smaller than both.
TEV/EBITDA Multiples (Capital IQ - Author's Illustration)
Using Capital IQ's historic multiples based on the LTM EBITDA, the average EV/EBITDA multiple for CAT has been:
Q2 2022 Average = 13.28x
Q3 2022 Average = 11.88x
Q4 2022 Average = 12.76x
Q1 2023 Average = 13.33x
Q2 2023 Average = 11.16x
Average = 12.4x
Other Assumptions
- The current marginal US tax rate stands at 25%.
- The perpetual growth rate is 2% as this matches the inflation targets set by the Federal Reserve.
Forecasting Depreciation And Amortization
Depreciation and Amortization aren't accounted for directly on their financial statements, therefore, I used a PPE schedule provided by Financial Modelling Prep . Depreciation and amortization have historically been around 5% of revenue, so I will maintain this level in the future:
| 2023 |
| 2024 |
| 2025 |
| 2026 |
| 2027 |
| D&A |
| $2.970 billion |
| $3.119 billion |
| $3.275 billion |
| $3.438 billion |
| $3.610 billion |
Forecasting CAPEX
The forecast for CAPEX is built around Caterpillar's guidance, revenue growth, and historic CAPEX levels relative to revenue. Caterpillar has said CAPEX will be around $1.5 billion in 2023, however, historically it's been around 5% of revenue. We will forecast CAPEX to be 5% of revenue, consistent with what they have historically done except for in 2023 which I will use their guidance.
| 2023 |
| 2024 |
| 2025 |
| 2026 |
| 2027 |
| CAPEX |
| $1.500 billion |
| $3.119 billion |
| $3.275 billion |
| $3.438 billion |
| $3.610 billion |
Forecasting Net Working Capital
I forecasted NWC using accounts receivables, accounts payable, and inventory days. Using the median of these measurements from 2018-2022, I applied them to the sales forecast to get the NWC:
- AR Days = 58
- AP Days = 53
- Inventory Days = 143
Once applied to the sales forecast, I calculated the NWC using:
- NWC = AR + Inv. - AP
Risks To DCF
The main risk to the DCF model is that results vary from the assumptions used. The key assumption that would detract from the investment thesis would be growth in revenue. If revenue growth comes in higher than 5%, the estimated intrinsic value changes by roughly ~3.1% for every 1% change:
| Revenue Growth |
| Intrinsic Value |
| Growth in Price |
| 0% |
| $145.92 |
| N/A |
| 1% |
| $150.65 |
| 3.24% |
| 2% |
| $155.51 |
| 3.23% |
| 3% |
| $160.51 |
| 3.22% |
| 4% |
| $165.65 |
| 3.20% |
| 5% |
| $170.94 |
| 3.19% |
| 6% |
| $176.38 |
| 3.18% |
| 7% |
| $181.96 |
| 3.16% |
| 8% |
| $187.70 |
| 3.15% |
| 9% |
| $193.60 |
| 3.14% |
| 10% |
| $199.65 |
| 3.13% |
When considering an increase in revenue growth, the estimated fair value still falls well below the current share price of CAT.
Another risk to consider is a change in the EV/EBITDA multiple. Due to the cyclical nature of CAT, post-recession multiples inflate significantly against the normalized multiples. For example, the average EV/EBITDA multiple was 17.3 (Capital IQ) in the year following the pandemic. Should another recession ensue, this would imply an increase in the estimated fair value.
Conclusion
In conclusion, Caterpillar has demonstrated a substantial increase in its share price over the past quarter, while the outlook for the future remains relatively stable. However, based on a careful evaluation, I find CAT to be currently overvalued at its current share price. Several factors contribute to my sense of caution, including the potential impact of rising interest rates, reduced demand in the mining industry, and a considerable premium to fair value as revealed through the discounted cash flow analysis. These elements collectively fuel my prudent reservations towards CAT's prospects.
For further details see:
Caterpillar: Strong Prospects, But Overvalued