CAT - Caterpillar: Future Consolidations Are Likely (Technical Analysis)
2023-05-10 17:32:28 ET
Summary
- The slight increase in construction spending may suggest a possible revival in demand for construction equipment and services, which could have positive long-term implications for Caterpillar's stock.
- The appearance of a reverse triangle pattern with a head and shoulder formation could suggest a continued downward trend for Caterpillar's stock price.
- If Caterpillar's stock price breaks below the $204 level, it may indicate further declines in the future.
In this article, the financial performance of Caterpillar Inc. ( CAT ) for 2022 is examined, and the company's growth prospects are analyzed in the context of some microeconomic factors and strategic initiatives. Despite facing challenges such as a potential global economic slowdown and increased competition in the electrification space, Caterpillar remains a compelling long-term investment opportunity. With a focus on customer value, digital offerings, and commitment to sustainability, the company is well-positioned for continued growth. However, short-term stock price volatility may occur due to increased research and development expenses to electrify its products. Investors should closely monitor the evolving economic landscape and weigh the potential effects of both contracting manufacturing and expanding services sectors on Caterpillar's stock price. The appearance of the reverse triangle pattern, succeeded by the head and shoulders formation, suggests that Caterpillar may experience further decline before rebounding upward.
Caterpillar's Performance and Growth Prospects
In the first quarter of 2023, Caterpillar showcased a strong performance, reporting a 17% increase in sales and revenues to $15.9 billion, driven by favorable price realization and higher sales volume. The company's operating profit margin reached 17.2%, with an adjusted operating profit margin of 21.1%. The first-quarter 2023 earnings per share amounted to $3.74, while the adjusted earnings per share was $4.91. Caterpillar returned $1.0 billion to shareholders through dividends and share repurchases in the quarter, underlining the company's solid operational performance and ability to serve increasing demand. These results reflect Caterpillar's commitment to executing its strategy for long-term profitable growth. Currently, the dividend yield stands at 2.25%, and given Caterpillar's robust financial position, investors anticipate a higher dividend yield in the future.
In 2022, Caterpillar experienced growth across all segments compared to 2021, with the Construction Industries segment leading in sales and segment profits at $25.3 billion and $4.7 billion, respectively. This growth is due to the global economic recovery, government investments in infrastructure projects, urbanization, and population growth. The Resource Industries segment received the highest sales growth at 26% compared to 2021, driven by the rebound in commodity prices.
Strategic Focus and Long-Term Investment Potential
Caterpillar presents an attractive long-term investment opportunity due to its strategic focus on increasing service sales and enhancing customer value. The company aims to achieve $28 billion in ME&T services sales by 2026, with over 60% of equipment now delivered with a Customer Value Agreement. These agreements boost aftermarket parts and service sales for dealers while benefiting customers through reduced downtime, improved utilization, and extended product life. Caterpillar is also expanding its digital offerings, such as the Cat Central App and data analytics tools, to support eCommerce sales growth and improve customer experience.
However, short-term stock price declines may occur due to Caterpillar's ongoing efforts to electrify its product portfolio, which could involve significant research and development expenses. The company might face challenges related to technology adoption, market acceptance, and competition, leading to short-term volatility in its stock price. Nevertheless, Caterpillar's emphasis on safety, efficiency, quality, and investment in energy transition solutions further solidifies its long-term investment prospects. The company's autonomous technology solutions, such as Cat Command, address labor market challenges, remote job sites, and the need for increased safety and productivity. Additionally, Caterpillar's acquisition of Tangent Energy Solutions and investment in Lithos Energy demonstrates its commitment to helping customers achieve their sustainability goals. While these initiatives may cause short-term fluctuations in the stock price, they ultimately strengthen Caterpillar's market position and growth potential in the long run.
Construction and Manufacturing Sectors
Over the last two quarters, construction spending has remained relatively flat, with a slight increase observed in May to $1.835 trillion, as illustrated in the chart below. This modest uptick in spending could have implications for Caterpillar's stock price, as it indicates a potential resurgence in demand for construction equipment and services that may lead to improved revenue for the company. However, given the modest nature of this increase, the impact on Caterpillar's stock price could be limited in the short term.
April 2023 saw a contraction in the US manufacturing sector, with a PMI of 47.1%, which has mixed implications for Caterpillar's stock price. A contracting manufacturing sector signals reduced demand for industrial machinery and equipment, potentially negatively impacting Caterpillar's revenues and stock price. This downturn resulted from supply chain disruptions, reduced global demand, and broader economic concerns affecting the manufacturing industry. Conversely, the positive growth in the services sector, as evidenced by the ISM service PMI increasing to 51.90%, suggests that the US economy is expanding, albeit unevenly. This expansion in the services sector could partially offset the negative impact of the contracting manufacturing sector on Caterpillar's stock price, as other segments of the economy continue to grow. For example, an expanding services sector could lead to increased construction activity, driving demand for construction equipment and machinery supplied by Caterpillar. Investors should closely monitor the evolving economic landscape and weigh the potential effects of both contracting manufacturing and expanding services sectors on Caterpillar's stock price.
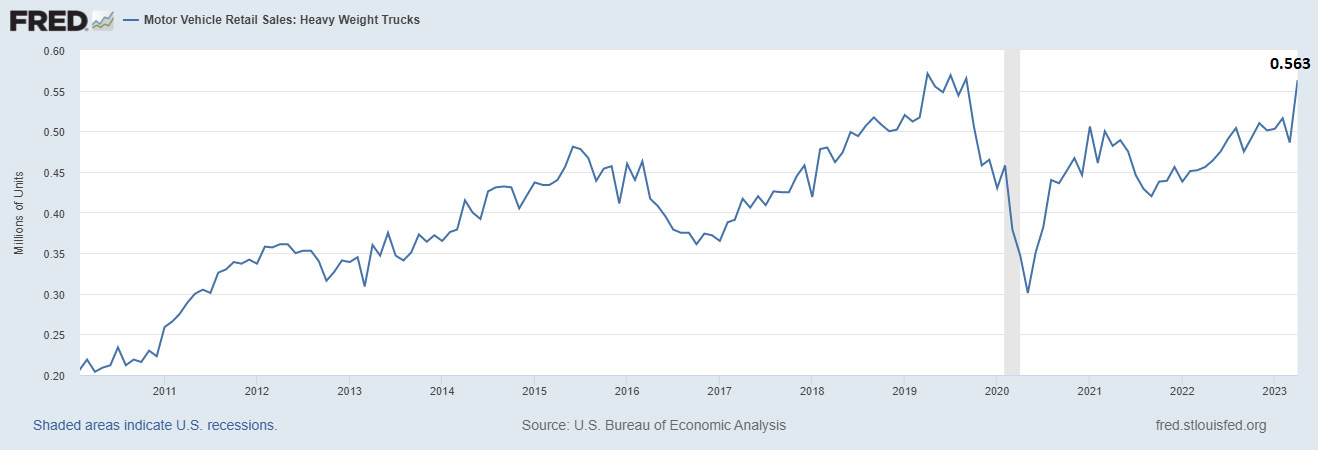
Furthermore, the unexpected increase in heavy truck sales in April, to 563 thousand units, has positive implications for Caterpillar. As heavy truck sales are often considered a reliable leading indicator of economic activity, this jump signals an upturn in the economy, particularly in sectors such as construction, infrastructure development, and transportation. As a leading manufacturer of construction and mining equipment, as well as diesel and natural gas engines, an uptick in heavy truck sales could translate into increased demand for Caterpillar's products and services. This increase in demand could potentially boost Caterpillar's revenues and positively impact its stock price. While an uptick in heavy truck sales has positive long-term implications for Caterpillar's stock price, short-term volatility may occur due to ongoing uncertainty in the market.
Long-Term Perspective for Caterpillar
Historical Analysis
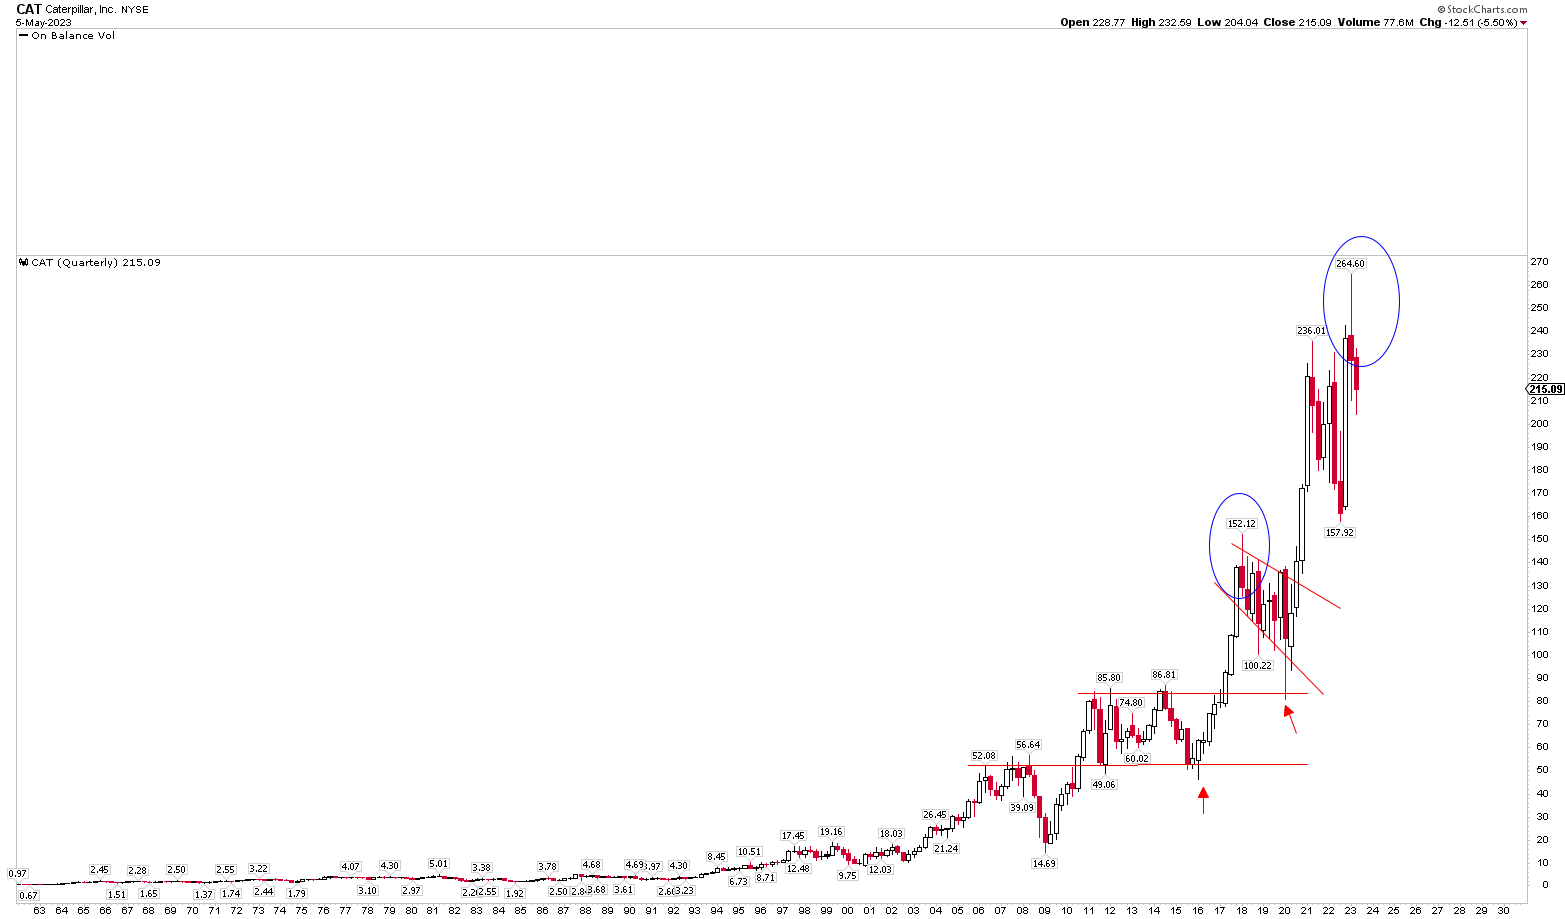
The long-term perspective of Caterpillar can also be seen in the technical quarterly chart below, showcasing a robust bullish run spanning the past decade. This ascent, with gains of over 1700% from the 2009 low to 2023 high, was marked by bullish price action formations that often generated considerable uncertainty and rapid declines before the actual breakout. After establishing a solid base in 2009, the price reached a peak in the $85-$86 range, followed by consolidation between $49 and $86 before breaking out in 2017. This surge took the price to $152.12 in 2018. Subsequently, the price consolidated within broader ranges, forming additional bullish patterns which were disrupted in 2020 during the Covid-19 crisis. With a peak of $264.60, the first quarterly candle of 2023, marked a reversal on the chart, suggesting the bottom is yet to be established.
Present Outlook and Consolidation Patterns
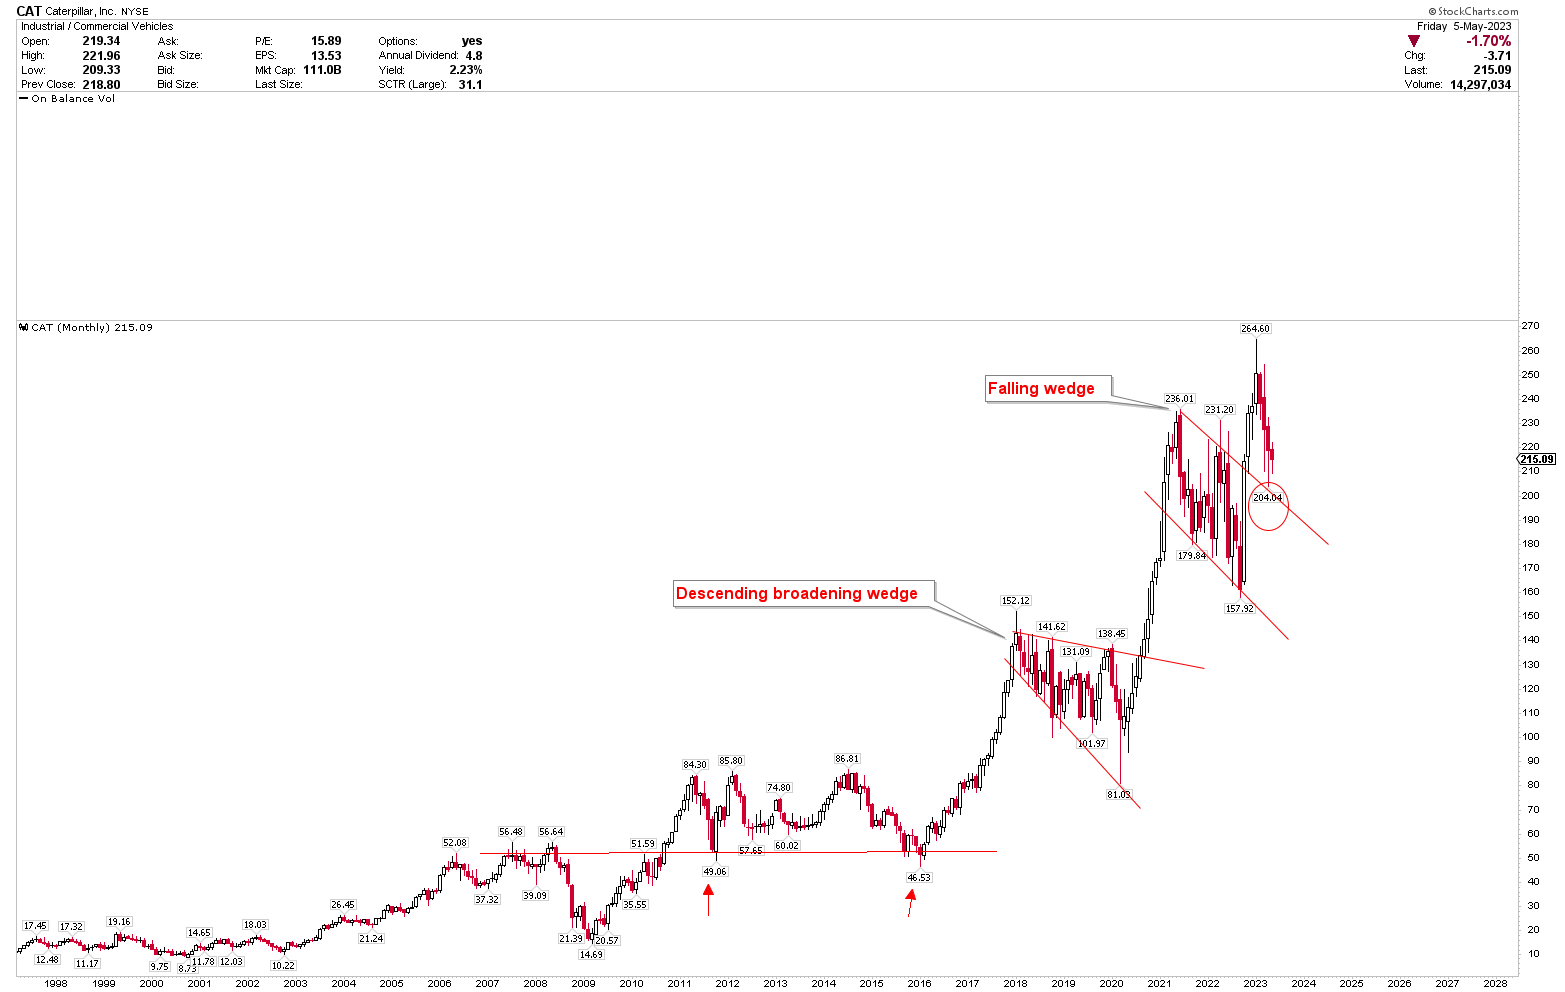
The discussion on the quarterly chart is continued on the monthly chart which echoes the aforementioned price action, as the stock retraces from its peak. Notably, Caterpillar tends to trade within wide ranges before breaking out, with prices often moving in a straight-line post-breakout. Presently, the stock is retracing to support levels, potentially indicating further consolidation before the next upward movement. The emergence of descending broadening wedge and bull flag patterns signifies a robust bullish trend; once the decline ends, prices may climb higher. However, current testing of the previously broken bull flag suggests that the near-term outlook for Caterpillar may not be bullish, and further consolidation might be required to confirm a bottom.
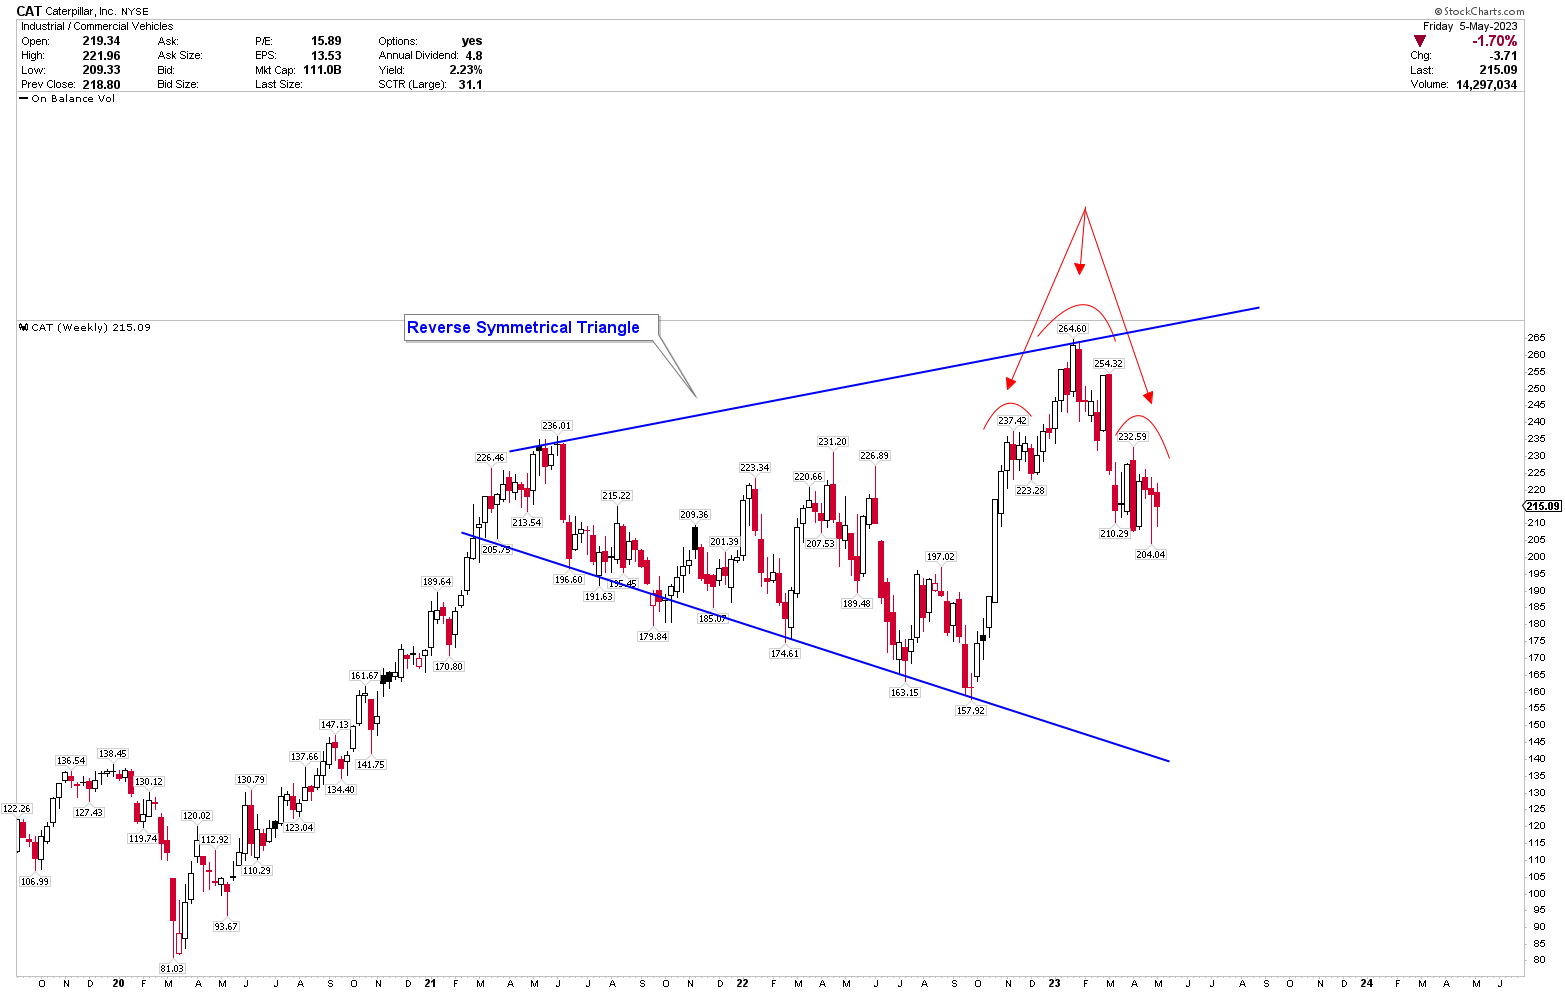
To further understand the short-term outlook of Caterpillar, the weekly chart is presented below, which displays a reverse symmetrical triangle formed between April 2021 and February 2023. After reaching a peak of $264.60 in 2023, the stock exhibits a bearish price pattern characterized by a head and shoulders formation. The reverse symmetrical triangle signals indecision and volatility among market participants, arising during periods of conflicting market forces as investors evaluate potential risks and rewards. The prospect of a 2023 recession has triggered the reverse symmetrical triangle, and the emergence of a head and shoulders pattern at the triangle's resistance indicates that Caterpillar may have further room to decline.
Key Takeaways for Investors
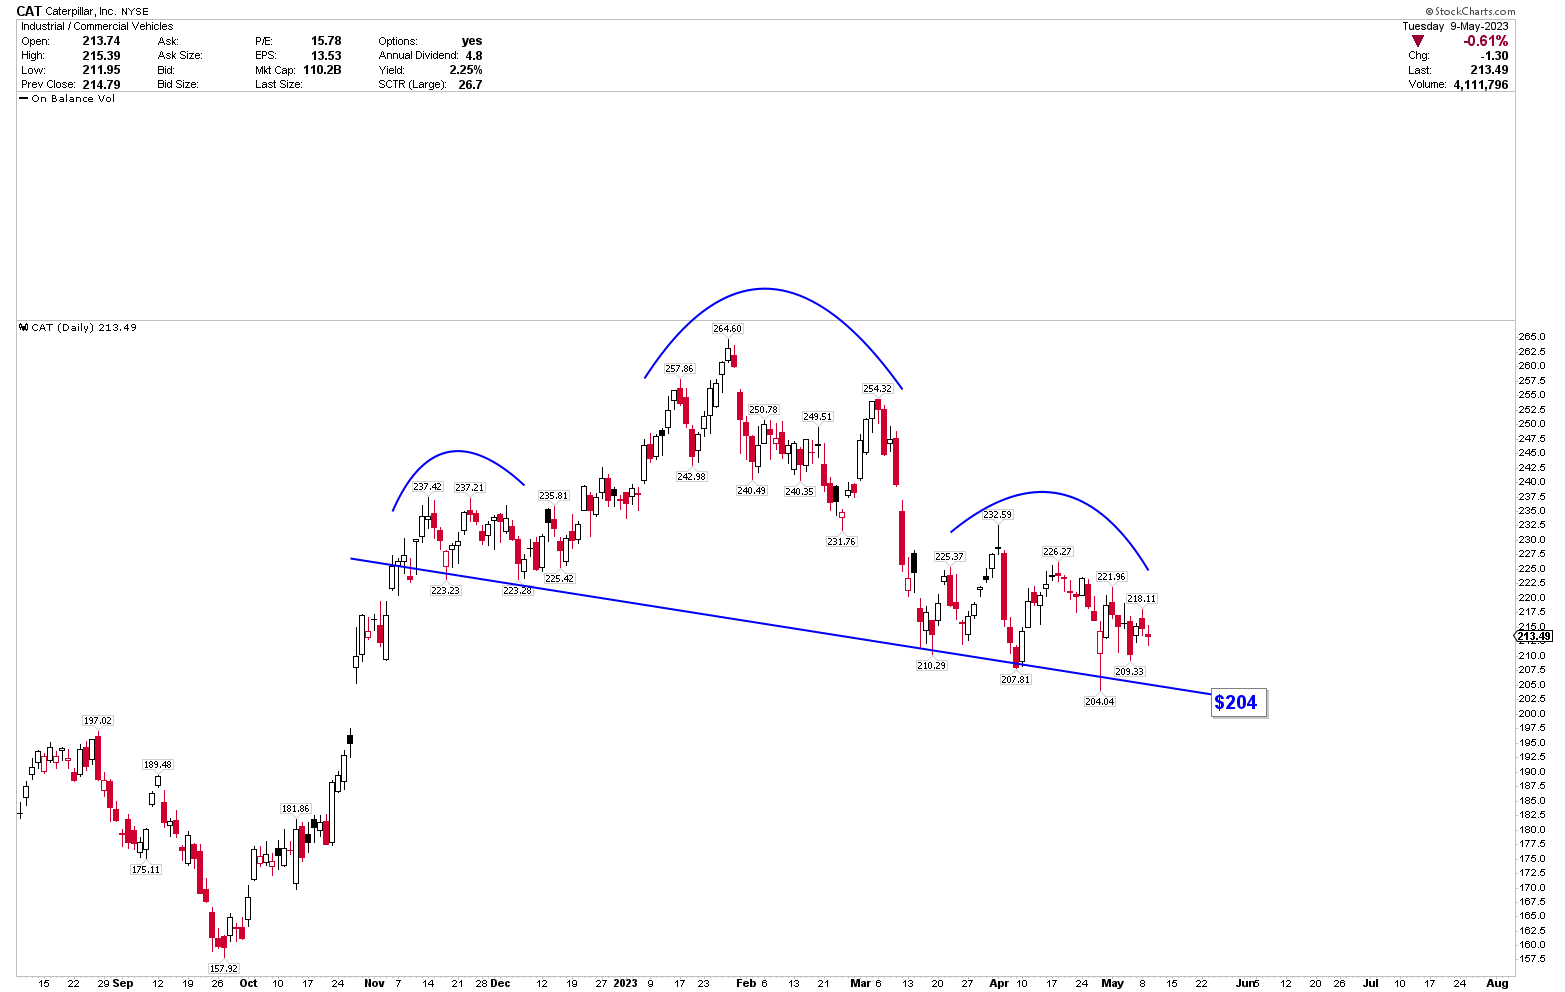
The above discussion suggests that Caterpillar may have additional room to decline, with the head and shoulders pattern on the weekly chart indicating increased selling pressure. However, the bull flag on the monthly chart provides support at current levels, where a slight bounce in price is observed, implying a minor risk of upside in the market. The daily chart below reveals a neckline at $204; if Caterpillar breaks this level, the price may trend lower.
Conversely, if the price fails to descend and surpasses $254, the likelihood of continued price appreciation remains. Long-term investors may consider holding their positions, as there are no definitive clues for Caterpillar's bottom. New investors seeking to buy Caterpillar should wait for the market to resolve the current financial crisis and establish more confirmed patterns signaling a turnaround. Meanwhile, investors aiming to capitalize on short-term positions can sell the market to take profits in the $180 region.
Risk Factors
Caterpillar's business performance is significantly influenced by global and regional economic conditions, including factors such as economic growth, commodity prices, infrastructure spending, and construction activities. The accelerating regional banking crisis presents considerable risks to the manufacturing and construction sectors, potentially impacting Caterpillar's stock price. Fluctuations in commodity prices, material costs, and labor availability, driven by these uncertainties, may affect the company's financial results and its ability to meet customer demands.
The ongoing banking crisis also poses challenges to Caterpillar's liquidity, as well as the liquidity of its customers, dealers, and suppliers. Disruptions or volatility in global financial markets may adversely affect the company's ability to access capital and credit markets, fund its operational needs, and maintain a competitive position. Moreover, the quarterly chart for Caterpillar's stock price indicates significant volatility, with wide ranges that increase market risk in any direction. The heavy volatility within these ranges can result in significant movements in either direction.
Conclusion
Based on the above discussion, Caterpillar's strong performance and growth across all segments, driven by global economic recovery and strategic initiatives, showcase the company's strong position and promising long-term prospects despite potential challenges. The strategic focus on enhancing customer value, expanding digital offerings, and investing in energy transition solutions highlights Caterpillar's commitment to market leadership and solid long-term investment potential. Moreover, the modest increase in construction spending, combined with mixed implications from the US manufacturing and services sectors, could result in limited short-term fluctuations in Caterpillar's stock price. However, the rise in heavy truck sales signals potential long-term growth opportunities. Furthermore, Caterpillar's technical evaluation demonstrates a pattern of consolidation followed by any upward movement, suggesting a potential decline before the next bullish phase.
The appearance of a reverse triangle pattern, followed by a head and shoulder pattern, reinforces the bearish outlook for the short term and suggests more decline is possible. If the stock price breaks below the $204 level, it may continue to fall, and investors should be careful. However, a breakout above $254 would indicate a shift toward a bullish outlook. Long-term investors might consider holding their positions, but new investors must exercise patience before entering the market due to short-term bearish bias.
For further details see:
Caterpillar: Future Consolidations Are Likely (Technical Analysis)